





A majority of trace elements are non-essential dietary factors, many of which are not typically addressed in standard works on human nutrition(Reference Lanham-New, Hill and Gallagher1,Reference Ross, Caballero and Cousins2) . To date, little research has been conducted on potential differences in the status of non-essential trace elements, as well as certain essential elements such as Cu and Mo, among vegans, lacto-ovo-vegetarians (LOV) and omnivores (OMN)(Reference Simon, Lossow and Pellowski3–Reference Simon, Richter and Lossow8).
For many trace elements, no clear physiological requirement has been established. Some, such as Al(Reference Yokel and Caballero9), Cd, Pb, Hg and Tl(Reference Kowalczyk, Givelet and Amlund10), are primarily considered harmful. Others, such as Ag(Reference Tóth, Marschalkó and Hársing11), Au and Pt, have uncertain dietary relevance at typical exposure levels. All trace elements might be beneficial to human health in certain amounts, but all are clearly toxic if intake is excessive(Reference Nielsen and Caballero12).
For Al, essentiality for humans was previously suggested but remains unconfirmed(Reference Nielsen and Caballero12). Diet is the main source of Al exposure, but levels in foods are typically low(Reference Yokel and Caballero9). For As, neither essentiality nor beneficial effects have been established(Reference Nielsen and Caballero12). In addition to certain occupations and drinking water, diet is a main contributor to As exposure, particularly via fish, shellfish, certain seaweeds(Reference Makkar, Tran and Heuzé13) and rice(Reference Nielsen and Caballero12,Reference Scott and Wu14) . Limited evidence suggests that urinary As levels are lower in vegans compared with regular fish eaters(Reference Henjum, Groufh-Jacobsen and Aakre15). As is classified as carcinogenic(16), and its toxicity is associated with skin conditions, hair loss, liver damage, neuritis, depression, CVD(Reference Karachaliou, Sgourou and Kakkos17) and certain cancers, such as bladder cancer(Reference Nielsen and Caballero12). For Cd, neither essentiality nor beneficial effects have been credibly confirmed(Reference Nielsen and Caballero12). Along with cigarette smoke, diet is a major contributor to Cd exposure(Reference Ougier, Fiore and Rousselle18). Limited evidence suggests that vegans may have higher(Reference Krajčovičová-Kudláčková, Ursínyová and Mašánová19) or similar(Reference Fløtre, Varsi and Helm20) blood Cd levels compared with OMN. Cd is classified as carcinogenic(16), and its toxicity adversely affects the lungs, kidneys, bones and cardiovascular system(Reference Nielsen and Caballero12). Co is often described as an essential nutrient for humans(Reference Lauwerys and Lison21,Reference Paustenbach, Tvermoes and Unice22) . However, this is only accurate insofar as Co is a component of vitamin B12 (Reference Nielsen and Caballero12,23) . The human health relevance of consuming varying amounts of Co remains highly uncertain(Reference Nielsen and Caballero12). Apart from occupational exposure in certain industrial settings, diet is the primary source of Co exposure(Reference Lauwerys and Lison21). Based on mass spectrometry methods that measure a combination of free Co and Co complexed within vitamin B12, high-dose vitamin B12 supplementation, which may be common among vegans, may increase total Co intake. However, the Co within the vitamin B12 molecule is not released as free Co under physiological conditions. Unabsorbed vitamin B12 is excreted through urine and faeces, either intact or after structural modifications by the microbiome forming vitamin B12 analogues, but none of these molecules release free Co(Reference Fedosov24). Cu is a dietary essential, and diet is typically the main factor influencing Cu exposure. Limited evidence suggests that, compared with OMN, serum Cu levels in vegans are either lower(Reference Galchenko, Rizzo and Sidorova4,Reference Medkova, Mosiakina and Biriukova6) or similar(Reference Simon, Lossow and Pellowski3,Reference Klein, Dawczynski and Schwarz5–Reference Simon, Richter and Lossow8) . For Pb, essentiality has not been confirmed in humans(Reference Nielsen and Caballero12). In addition to occupational exposure and drinking water from Pb pipes, food is typically the main source of exposure(Reference Nordberg, Fowler and Nordberg25). Limited evidence suggests that whole blood Pb levels are similar in vegans, LOV and OMN(Reference Fløtre, Varsi and Helm20). Hg is considered a non-essential element, and diet is a major source of exposure. Individuals who do not eat fish, including LOV and vegans, appear to have considerably lower Hg levels in whole blood(Reference Fløtre, Varsi and Helm20,Reference Jose and Ray26) , hair(Reference Endo, Hayasaka and Ogasawra27–Reference Yamaguchi, Matsumoto and Kaku31) and urine(Reference Vogel, Murawski and Schmied-Tobies32). Mo is considered an essential element, and diet is a main source of exposure. Despite its essentiality, no studies to date appear to have assessed the Mo status of vegans. For Ni, essentiality has not been confirmed in humans, although several potentially beneficial effects on the cardiovascular system, kidneys and other organs have been proposed(Reference Nielsen and Caballero12). Diet appears to be the primary source for Ni exposure for most individuals. Plant foods, particularly legumes, are generally rich in Ni(Reference Nielsen and Caballero12), and intake in LOV and vegans may be somewhat higher than in OMN(Reference Clarke, Barnes and Castle33–Reference Fleury, Rivière and Allès35). Tl is highly toxic(Reference Pearson and Ashmore36,Reference Hologgitas, Ullucci and Driscoll37) , with no known beneficial effects. Diet appears to be a main factor in Tl exposure, and vegetables have been described as a main contributor to intake(Reference Sherlock and Smart38–Reference Weinig and Zink40). For Sn, neither essentiality nor beneficial effects have been demonstrated in humans(Reference Nielsen and Caballero12). Diet appears to be a relevant factor for Sn exposure. Limited evidence suggests that Sn intake might be higher in LOV and vegans compared with OMN(Reference Clarke, Barnes and Castle33,Reference Fleury, Rivière and Allès35) . Zn is an essential element with potentially increased relevance in vegan nutrition(Reference Koeder and Perez-Cueto41). On average, Zn status in vegans (as measured in blood, urine and saliva) appears to be somewhat lower than in OMN(Reference Weikert, Trefflich and Menzel42–Reference Freeland-Graves, Bodzy and Eppright45). Furthermore, dietary, urinary and faecal Zn levels appear to correlate(Reference Trame, Wessels and Haase46). Excretion via urine appears to be the primary route for dietary Al(Reference Yokel and Caballero9), As(Reference Mohri, Hisanaga and Ishinishi47), Mo(Reference Turnlund, Keyes and Peiffer48) and Ni(Reference Nielsen and Caballero12,Reference Kent and McCance49) . Conversely, excretion in faeces appears to predominate for dietary Co(Reference Kent and McCance49), Cu(Reference Bush, Mahoney and Markowitz50), Pb(Reference Ziegler, Edwards and Jensen51,Reference Kehoe52) , Hg (particularly methylmercury(Reference Ye, Kim and Jeon53))(Reference Nordberg, Fowler and Nordberg25) and Zn(Reference King, Cousins, Ross, Caballero, Cousins, Tucker and Ziegler54). Dietary Cd(Reference Yabe, Nakayama and Ikenaka55), Tl(Reference Hologgitas, Ullucci and Driscoll37) and Sn(Reference Kent and McCance49,Reference Gil, Olmedo and Caballero56,Reference Calloway and McMullen57) (possibly varying for different Sn compounds(Reference Lehmler, Gadogbe and Liu58)) appear to be similarly excreted in faeces and urine.
The present study aimed to assess the urinary levels of twenty trace elements. However, eight elements were not detected in most or all participants. Therefore, the aim of the present paper was to compare the detected twelve urinary trace element concentrations among vegans, LOV and OMN in southern Germany.
Materials and methods
Study design
The present article describes an exploratory secondary analysis of a cross-sectional study, the design of which has been described previously(Reference Storz, Müller and Niederreiter59–62). In brief, participants were recruited in Freiburg (southwest Germany) via newspaper advertisements and social media. Inclusion criteria required participants to be generally healthy, ≥ 18 years old and willing to complete weighed food protocols on 4 days, as well as to have sufficient knowledge of the German language and a BMI of 18·6–29·9 kg/m2. Furthermore, participants had to follow (long-term, consistent adherence) either a vegan diet (excluding all animal products), an LOV diet (excluding meat, fish and seafood but including dairy products and/or eggs) or an omnivorous diet (for ≥ 2 years continuously). Exclusion criteria were regular smoking, alcohol intake > 30 g/d(Reference Storz, Müller and Niederreiter59), use of medications that may interfere with vitamin B12 metabolism (e.g. proton pump inhibitors and antacids), chronic illness (e.g. diabetes, thyroid disease and coeliac disease), eating disorders (self-reported), pregnancy, lactation, blood donation within 6 weeks prior to recruitment into the study and participation in another study within 4 weeks prior to recruitment. The study was approved by the ethics committee of the University Medical Center of Freiburg, Germany (reference: 21-1442), registered in the German Clinical Trials register (reference: DRKS00027425) and performed in accordance with the Declaration of Helsinki. All participants gave written and oral consent before inclusion in the study.
A vegan diet was defined by the strict exclusion of all animal-source foods, including meat, fish, eggs and dairy products. An LOV diet was defined by the exclusion of flesh foods (including meat and fish) but inclusion of dairy products and eggs. An OMN diet included animal-source foods, including flesh foods, eggs and dairy products. Self-reported diet group was confirmed using the available food diaries.
The most common specimen types utilised for trace element analyses are serum, plasma, whole blood and urine, although analysis in hair and nails is also possible(Reference Bornhorst and McMillin63). The present study was restricted to urinary analyses(Reference Moore, Rehkämper and Kreissig64) due to a lack of other biomaterials (e.g. whole blood) still available from the main study. Urine is the preferred material for elements that are excreted by the kidneys and that are rapidly cleared from blood, which applies in particular to As(Reference Mohri, Hisanaga and Ishinishi47). Nevertheless, the use of whole blood samples is preferred for Cd and Pb because most of these elements (> 90 %) is found in erythrocytes.
Urine sample acquisition and laboratory analysis
All data and urine samples (morning urine; 10 ml per person) were collected between December 2021 and May 2022. The samples were stored at −80℃ and transported to the laboratory (MLHB) on dry ice in July 2024. Laboratory staff were blinded to the dietary groups. Urine concentrations of all twenty elements were assessed by inductively coupled plasma MS, using an Agilent 8900 inductively coupled plasma MS /MS (Agilent Technologies), as described previously(Reference Heitland and Köster65). Accepted results were 75–125 % recovery for spiked concentrations in the range 0·04–0·1 μg/l. All methods were previously established and validated. Validation parameters are given in online Supplementary Table 1. Urinary creatinine concentrations were also assessed at MLHB, using the Jaffé method with a Cobas c501 (Roche Diagnostics) according to the manufacturer’s procedure. The control materials Lyphochek 1 and 2 (Bio-Rad) were used for quality control.
Assessment of covariates
Assessment methods for other parameters have been published previously(Reference Storz, Müller and Niederreiter59,62) . In brief, socio-demographic parameters were evaluated using a printed questionnaire. Anthropometric parameters and supplement intake were assessed at the study centre (participants brought their supplements and reported their intake over the past 12 months). Cystatin C was measured in serum using a particle-enhanced immunonephelometric assay at the accredited Central Laboratory of the University Medical Center of Freiburg (Institute of Clinical Chemistry and Laboratory Medicine, Medical Centre – University of Freiburg, Germany). Physical activity was assessed as median metabolic equivalent (MET) minutes, categorised as a binarised score (low or moderate v. high)(Reference Storz, Müller and Niederreiter59,62) , using the International Physical Activity Questionnaire long-form(Reference Craig, Marshall and Sjöström66). Binarisation was applied due to the expected imprecision of the self-assessed MET data(Reference Joseph, Dagfinrud and Christie67).
Dietary intake assessment
Dietary intake estimations were previously discussed in great detail(Reference Storz, Müller and Niederreiter59,62) . In brief, we estimated nutrient intakes based on four weighed food diaries. This approach was suggested by Kristensen et al. (2015)(Reference Kristensen, Madsen and Hansen68,Reference Kristensen, Madsen and Hansen69) . It considers nutrient intakes on two working days and two weekend days. The average daily intake of nutrients was estimated with the following formula: average daily intake = ((average on working days × 4) + (average on weekend days × 3))/7.
Excluded outcome variables
Eight of the twenty trace elements assessed were excluded from further analysis (Ag, Au, Bi, In, Ir, Pd, Pt and Zr), as urinary levels for six elements (Ag, Au, Bi, In, Ir and Pd) were below their respective limit of quantification (LOQ) in all samples. For Pt and Zr, levels above the LOQ were detected in only one (1 vegan) and five (2 OMN, 2 LOV and 1 vegan) participants, respectively. The twelve remaining trace elements (Al, As, Cd, Co, Cu, Hg, Mo, Ni, Pb, Sn, Tl and Zn) were included in the analyses. The LOQ (µg/l) for the twenty elements and the proportion of samples below the LOQ were as follows (% < LOQ): Al (3, 81 %), As (1, 10 %), Bi (0·2, 100 %), Cd (0·2, 57 %), Co (0·2, 30 %), Cu (2, 10 %), Au (0·2, 100 %), In (0·2, 100 %), Ir (0·2, 100 %), Pb (0·2, 33 %), Hg (0·1, 76 %), Mo (0·2, 0 %), Ni (0·2, 3 %), Pd (0·05, 100 %), Pt (0·2, 99 %), Ag (0·2, 100 %), Tl (0·2, 47 %), Sn (0·2, 48 %), Zn (20, 3 %) and Zr (0·2, 96 %). Urinary Pt above the LOQ was observed in one participant (0·9 %), a female vegan (0·24 µg/l). Urinary Zr above the LOQ was observed in five participants (4·3 %): two female OMN (0·42 and 0·23 µg/l), one female LOV (0·48 µg/l), one male LOV (0·32 µg/l) and one male vegan (0·48 µg/l). For the twelve elements included in the analyses, the proportion of samples below the LOQ by diet group is given in online Supplementary Table 2. Identical LOQ thresholds and analytical procedures were used across diet groups.
Urinary levels v. urinary levels normalised to urinary creatinine
Spot urine analyte levels are often normalised to urinary creatinine (UCr) to control for urine dilution(Reference Abraham, Penczynski and Monien70). However, in the context of comparing OMN with LOV or vegans, this method has been questioned(Reference Lombard and Mock71) and was recently recommended against, based on data from the ‘Risks and Benefits of a Vegan Diet’ (RBVD) study in northeast Germany(Reference Abraham, Penczynski and Monien70). Individuals who do not consume meat or fish ingest less (or no) creatine and creatinine, which lowers UCr levels(Reference Abraham, Penczynski and Monien70,Reference Lombard and Mock71) . While the ‘Risks and Benefits of a Vegan Diet’ study found significantly lower UCr levels (–26 %) in vegans compared with OMN(Reference Abraham, Penczynski and Monien70), the present study found no significant difference in UCr levels between vegans and OMN.
Water intake and 24-h urine volume are often higher in vegans(Reference Abraham, Penczynski and Monien70), although not all studies have shown this(Reference Baroni, Bonetto and Rizzo72). If urine is diluted, unadjusted urinary analyte levels may appear falsely low. Adjusting urinary levels for specific gravity has been suggested as a potential alternative to normalisation to UCr. However, urinary specific gravity was not assessed in the present study, may not be suitable for certain trace elements (including Cd, Cu and Ni)(Reference Hoet, Deumer and Bernard73) and does not appear to be suitable for comparing OMN with LOV or vegans(Reference Abraham, Penczynski and Monien70).
Statistical analysis
The present study involved a secondary data analysis with an exploratory design. Single, fixed-value imputation was applied to urinary levels below the LOQ. Specifically, values for Al (< 3 µg/l), As (< 1 µg/l), Cu (< 2 µg/l), Hg (< 0·1 µg/l) and Zn (< 20 µg/l) were imputed as 2·9 µg/l (Al), 0·99 µg/l (As), 1·9 µg/l (Cu), 0·09 µg/l (Hg), 19 µg/l (Zn), respectively. For Cd, Co, Ni, Pb, Tl and Sn, all values below the LOQ (0·2 µg/l) were imputed as 0·19 µg/l. All Mo measurements were above the LOQ (0·2 µg/l). Consequently, except for Mo, all analyses are based on partially imputed data. The percentage of values below the LOQ (which were therefore imputed) varied between 3 % (Zn, Ni) and 81 % (Al). Boxplots showing the univariate distributions of non-imputed and imputed trace element levels are shown in online Supplementary Figure 1.
Linear correlation coefficients were calculated to examine bivariate correlations between dietary intake of Zn, Cu and vitamin B12 (including supplements) and urinary levels of Zn, Cu and Co, respectively. Additionally, correlation coefficients were calculated to assess bivariate correlations between supplement intake and urinary trace element levels, as supplements may influence urinary levels through their ingredients or potential contaminants. For non-supplementing participants, the supplementation dose was set to 0. Due to the descriptive, exploratory nature of these correlations, no respective P values were reported(Reference Wasserstein, Schirm and Lazar74).
Dietary between-group differences in the concentrations of the twelve urinary trace elements were compared by estimating one linear regression model for each element(Reference Fahrmeir, Kneib and Lang75). In addition to the categorical dietary group as the independent variable, the models controlled for the covariates age (metric variable), sex (categorical), educational level (categorical), subjective social status (measured on a scale from 1 [low] to 10 [high], using the MacArthur scale of subjective social status(Reference Hoebel, Müters and Kuntz76); metric variable) and a binary physical activity score (categorical). These covariates were selected as they may influence trace element levels directly (e.g. age, sex and exercise) or indirectly through differences in diet, supplementation and health behaviours.
Each model was re-estimated twice: once analysing the urinary trace element levels normalised to UCr levels instead of the non-normalised values and once (as a sensitivity analysis) with serum levels of cystatin C as an additional covariate. Model assumptions were evaluated graphically, and no regression model showed relevant deviations from these assumptions. Multiple testing correction was applied individually per model to adjust the three pairwise dietary group comparison P values, using the Benjamini–Hochberg correction(Reference Benjamini and Hochberg77). All analyses were conducted with the open-source software R (version 4.5.0)(78). Regression models were estimated using the function ‘lm’ from the base package ‘stats’. The statistician (AB) was blinded to dietary group identity.
The present study constitutes an exploratory investigation based on available data from a previously conducted cross-sectional study.
Initially, the minimum sample size was estimated using G * Power software for a single primary outcome (the cB12-index, as reported previously)(Reference Storz, Müller and Niederreiter59,62) ; considering a statistical power of 80 %, a hypothesised large effect size (Cohen’s f value: 0·4) and main effect of group (OMN, LOV, vegans) with blocking factors of sex (female, male), BMI (normal, overweight), vitamin B12 supplementation (yes, no) and level of physical activity (low, medium and high), we calculated that a minimum of eighty-four participants (twenty eight per diet group) would be required to detect differences between groups at a statistical significance level of P < 0·05. The complexity of regression models in the present study does not deviate substantially from the described setup used in the preceding study.
Results
Between-group differences in covariates
A total of 115 participants, comprising thirty-eight vegans (44·7 % male), thirty-seven LOV (32·4 % male) and forty OMN (40·0 % male), were recruited and included in the analyses. A flow chart has been published previously(Reference Storz, Müller and Niederreiter59,62) .
There were no significant between-group differences in terms of age, sex, physical activity, dietary supplement use (yes/no), multivitamin supplement use (yes/no), Zn supplementation (yes/no, dose and frequency; Table 1), marital status (P = 0·817), educational level (P = 0·993), ethnicity (P = 0·652), subjective social status (P = 0·365) or fortified food consumption (P = 0·717). However, duration of diet adherence and vitamin B12 supplementation (yes/no; dose; frequency) were significantly different between groups (all: < 0·001; Table 1).
Covariate differences by diet group

Table 1. Long description
The table compares covariate differences by diet group across various variables. It includes data for vegan, LOV, OMN, and all participants. The table has 115 rows and 12 columns. Column headers are Variable, Vegan, LOV, OMN, and All participants. Each diet group column is further divided into sub-columns: n, percent, median, and IQR. Row labels include variables such as age, sex, physical activity, dietary supplement use, multivitamin supplement use, Zn supplementation, educational level, subjective social status, creatinine, and cystatin C. Row 1: Variable, Vegan, n, percent, median, IQR, LOV, n, percent, median, IQR, OMN, n, percent, median, IQR, All participants, n, percent, median, IQR. Row 2: n, 38,, , , , 37,, , , , 40,, , , , 115,, , . Row 3: Female, 21, 55.3,, , , 25, 67.6,, , , 24, 60.0,, , , 70, 60.9,, . Row 4: Age (years),, , 27.5, 24.0-35.0,, , 27.0, 24.0-33.0,, , 30.5, 25.0-35.5,, , 28.0, 24.0-35.0. Row 5: Duration of diet adherence (years),, , 4.0, 2.2-6.4,, , 5.8, 3.0-17.0,, , 28.0, 20.0-33.5,, , 7.0, 3.3-24.0. Row 6: BMI (kg/m^2),, , 22.6, 20.8-24.6,, , 21.6, 20.2-22.5,, , 22.9, 20.2-25.2,, , 22.2, 20.2-24.3. Row 7: Physical activity (MET min),, , 4130, 3014-5859,, , 5116, 3491-8169,, , 4514, 3432-8367,, , 4599, 3372-7317. Row 8: Physical activity (MET category) Low, 1, 2.6,, , , 0, 0.0,, , , 1, 2.5,, , , 2, 1.7,, . Row 9: Physical activity (MET category) Moderate, 6, 15.8,, , , 5, 13.5,, , , 4, 10.0,, , , 15, 13.0,, . Row 10: Physical activity (MET category) High, 31, 81.6,, , , 32, 86.5,, , , 35, 87.5,, , , 98, 85.2,, . Row 11: Any supplement use (yes), 36, 94.7,, , , 30, 81.1,, , , 31, 77.5,, , , 97, 84.4,, . Row 12: Multivitamin supplement use (yes), 18, 47.4,, , , 10, 27.0,, , , 9, 22.5,, , , 37, 32.2,, . Row 13: Vitamin B12 supplement use Yes, 35, 92.1,, , , 19, 51.4,, , , 11, 27.5,, , , 65, 56.5,, . Row 14: Vitamin B12 supplement use Usual dose (µg),, , 250, 20-1000,, , 400, 23-1000,, , 25, 3-338,, , , 253, 20-500. Row 15: Vitamin B12 supplement use Frequency (d/year),, , 365, 156-365,, , 40, 12-156,, , 180, 78-365,, , , 183, 78-365. Row 16: Vitamin B12 supplement use Average dose (µg/d),, , 214, 20-379,, , 49, 8-171,, , 9, 3-167,, , , 100, 10-285. Row 17: Zn supplement use Yes, 14, 36.8,, , , 7, 18.9,, , , 16, 40.0,, , , 37, 32.2,, . Row 18: Zn supplement use Usual dose (mg),, , 10, 10-13,, , 10, 5-10,, , 10, 5-15,, , , 10, 5-15. Row 19: Zn supplement use Frequency (d/year),, , 365, 183-365,, , 156, 30-365,, , 168, 36-365,, , , 260, 120-365. Row 20: Zn supplement use Average dose (mg/d),, , 10, 9-11,, , 4, 1-5,, , 2, 1-15,, , , 5, 1-10. Row 21: Educational level Secondary school, 4, 10.5,, , , 3, 8.1,, , , 4, 10.0,, , , 11, 9.6,, . Row 22: Educational level University entrance qualification (German: Abitur), 18, 47.4,, , , 17, 46.0,, , , 17, 42.5,, , , 52, 45.2,, . Row 23: Educational level University degree, 18, 47.4,, , , 17, 46.0,, , , 17, 42.5,, , , 52, 45.2,, . Row 24: Subjective social status (MacArthur Scale),, , 6.0, 6.0-7.0,, , 7.0, 6.0-7.0,, , 7.0, 5.5-7.0,, , , 6.0, 6.0-7.0. Row 25: Creatinine (urine, g/l),, , 0.89, 0.53-1.75,, , 0.96, 0.46-1.73,, , 0.73, 0.36-1.65,, , , 0.87, 0.41-1.75. Row 26: Cystatin C (serum, mg/l),, , 0.87, 0.78-0.94,, , 0.84, 0.80-0.91,, , 0.84, 0.81-0.89,, , , 0.85, 0.80-0.91.
IQR, interquartile range; LOV, lacto-ovo-vegetarians; MET min, metabolic equivalent minutes; OMN, omnivores.
Continuous variables are presented as medians (25th percentile–75th percentile). Vitamin B12 supplement use is highlighted because this vitamin contains Co.
* Median (interquartile range) in those taking the respective supplements.
Furthermore, compared with OMN, vegans showed significantly higher supplementation rates for Ca, choline, folic acid, Fe and Se, with no significant differences for biotin, DHA, EPA, iodine, Mg, niacin, pantothenic acid or vitamins A, B1, B2, B6, C, D, E, K1 and K2.
Supplement use did not differ significantly between OMN and LOV, except for a higher prevalence of vitamin B12 supplementation among LOV (Table 1) and a higher prevalence of vitamin C supplementation among OMN. Details of supplementaion behaviour have been published(Reference Storz, Müller and Niederreiter59,62) . Compared with OMN, plasma vitamin B12 levels (which might affect total urinary Co levels) were about 6 % higher in vegans and about 18 % lower in LOV. However, these differences were not statistically significant after adjustment for covariates (P > 0·110, data not shown).
Urinary concentrations of twelve trace elements
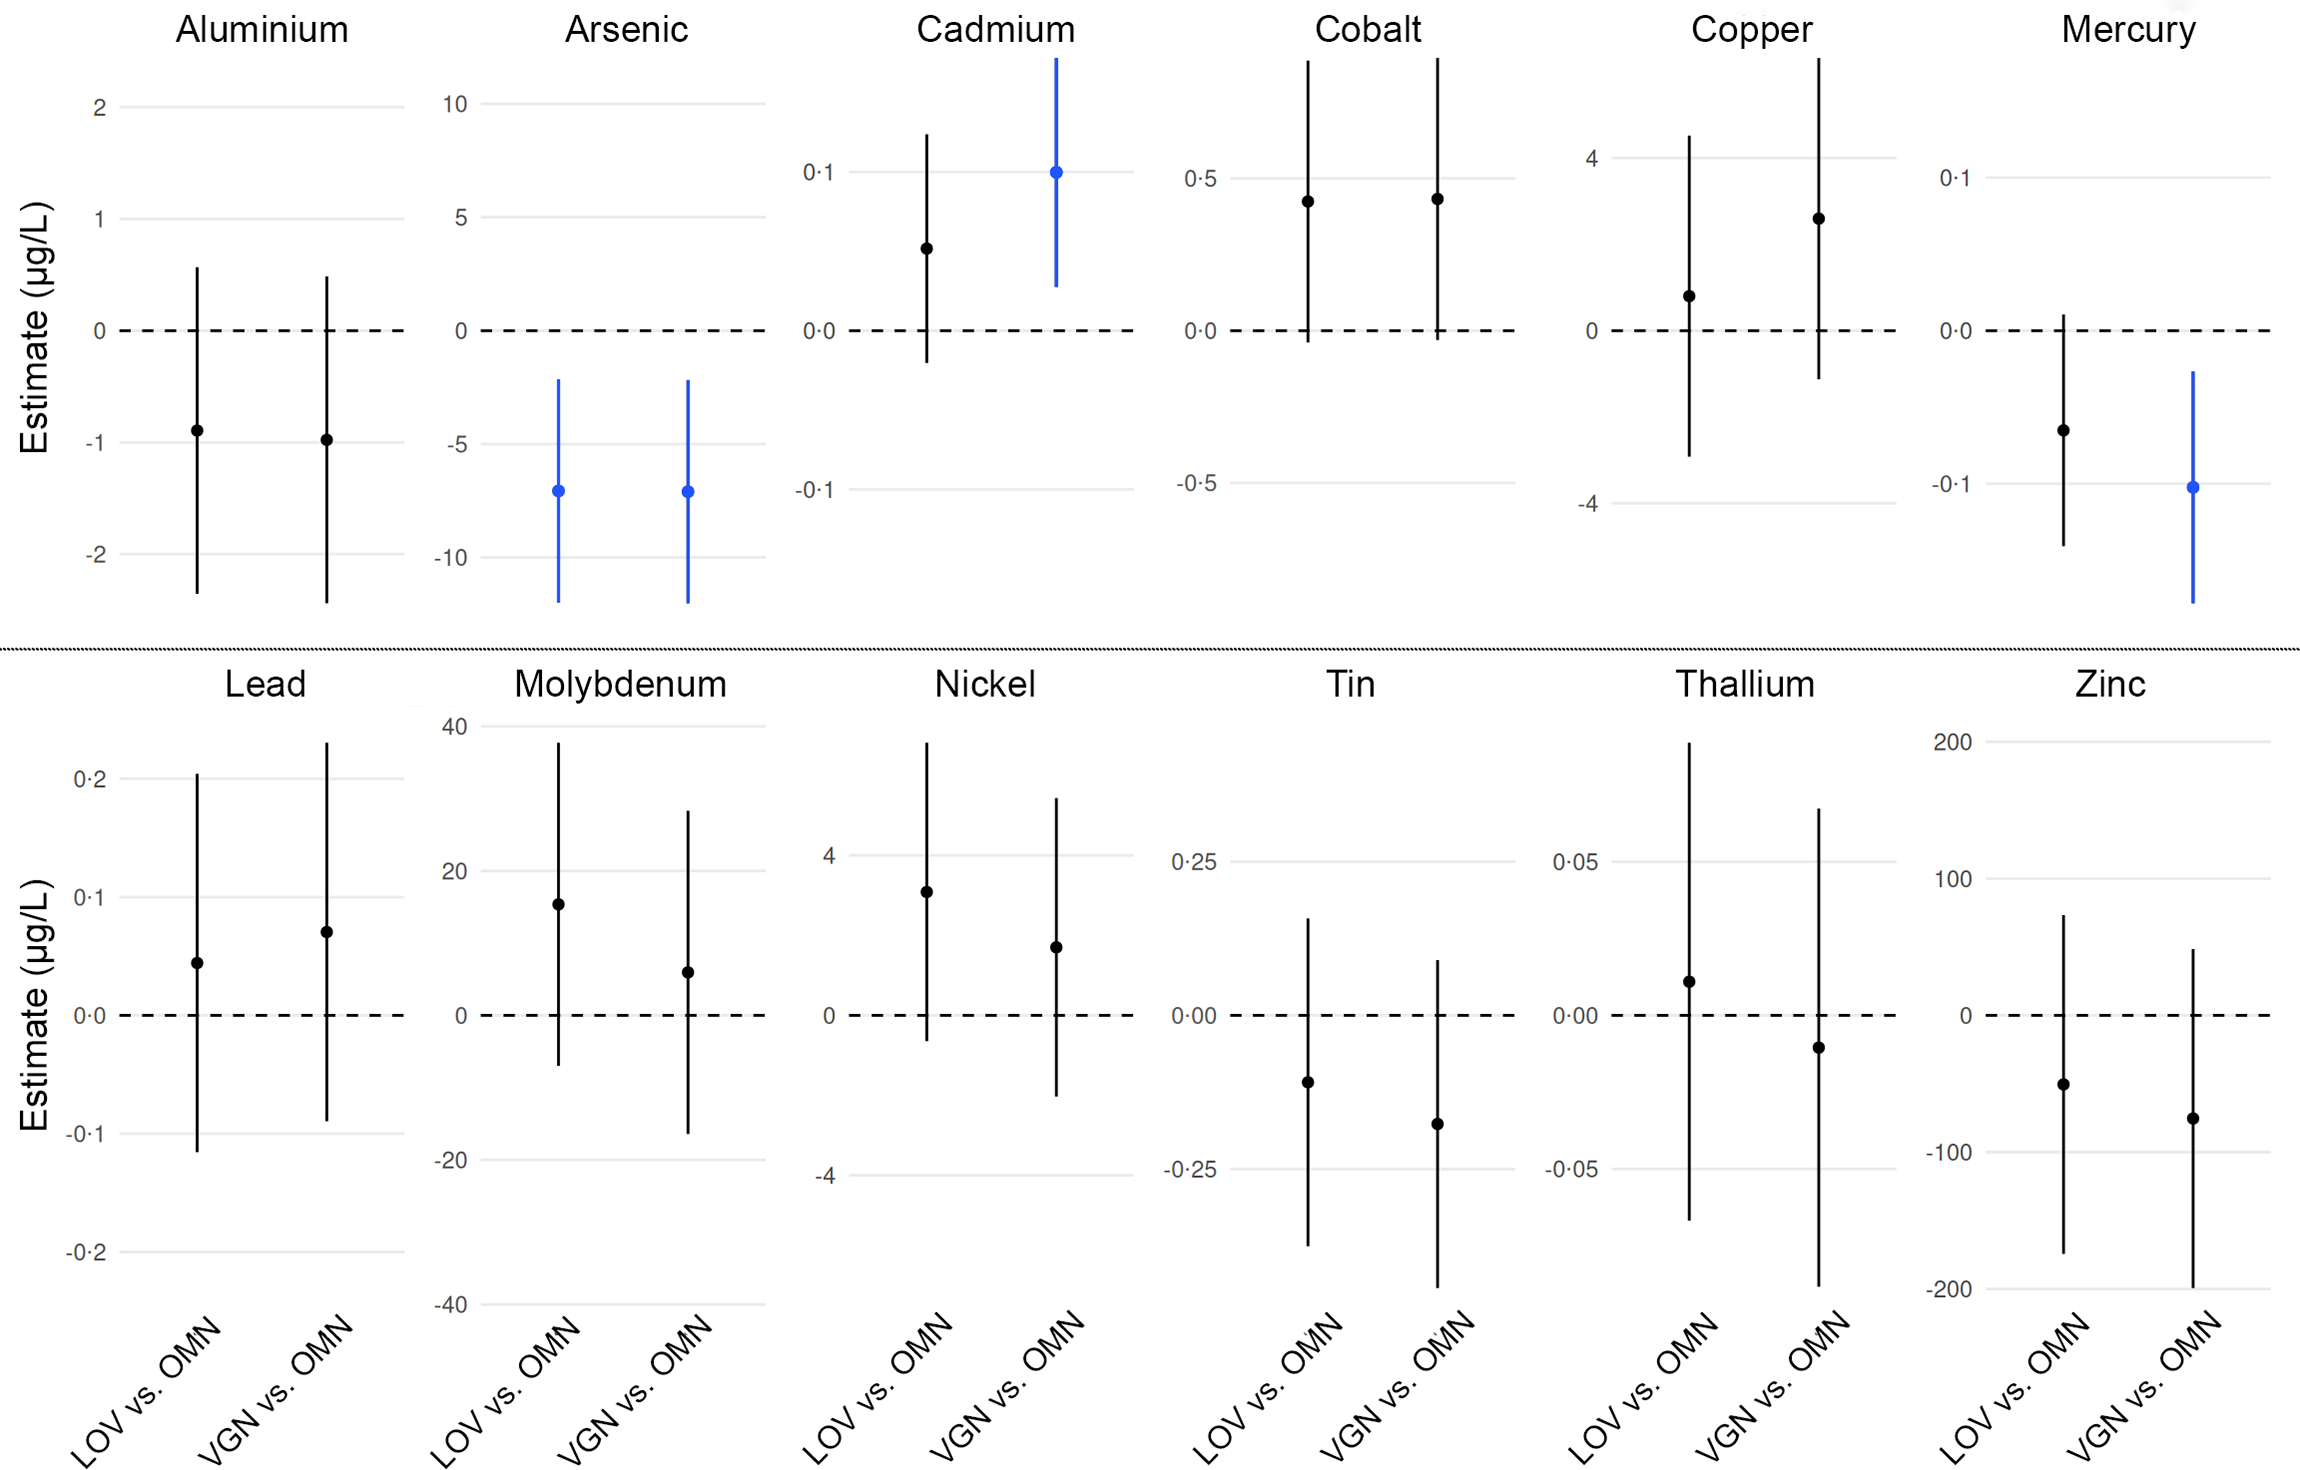
Distributions of the unadjusted urinary trace element levels in the three diet groups are presented in Figure 1. After adjustment for potential confounders, significant differences between OMN and LOV, or OMN and vegans, were observed for three of the twelve elements (Figure 2). Compared with OMN, urinary As levels were significantly lower in both LOV (–54·1 %) and vegans (–54·4 %; both: P = 0·009). Urinary As ranges were 1–71 µg/l, 1–55 µg/l and 1–17 µg/l in OMN, LOV and vegans, respectively.
Distributions of imputed urinary trace element levels in the OMN, LOV and VGN groups. Imputed, unadjusted data not normalised to creatinine are presented. Boxplots show the minimum, 25th percentile, median, 75th percentile and maximum values. For nickel, one outlier (89·6 µg/l) in the LOV group was not visualised in the figure to improve the readability of the overall distribution. LOV, lacto-ovo-vegetarians (n 37); OMN, omnivores (n 40); VGN, vegans (n 38).

Figure 1. Long description
Panel A: A box-and-whisker plot showing urinary aluminium levels across three dietary groups: omnivores (OMN), lacto-ovo-vegetarians (LOV), and vegans (VGN). The horizontal axis represents the dietary groups, and the vertical axis represents the urinary aluminium level in micrograms per liter (µg/L), ranging from 0 to 30. Each box plot shows the minimum, 25th percentile, median, 75th percentile, and maximum values. Panel B: A box-and-whisker plot showing urinary arsenic levels across the same dietary groups. The vertical axis ranges from 0 to 60 µg/L. Panel C: A box-and-whisker plot showing urinary cadmium levels, with the vertical axis ranging from 0 to 0.75 µg/L. Panel D: A box-and-whisker plot showing urinary cobalt levels, with the vertical axis ranging from 0 to 4 µg/L. Panel E: A box-and-whisker plot showing urinary copper levels, with the vertical axis ranging from 0 to 40 µg/L. Panel F: A box-and-whisker plot showing urinary lead levels, with the vertical axis ranging from 0 to 2 µg/L. Panel G: A box-and-whisker plot showing urinary mercury levels, with the vertical axis ranging from 0 to 1.25 µg/L. Panel H: A box-and-whisker plot showing urinary molybdenum levels, with the vertical axis ranging from 0 to 300 µg/L. Panel I: A box-and-whisker plot showing urinary nickel levels, with the vertical axis ranging from 0 to 10 µg/L. Panel J: A box-and-whisker plot showing urinary thallium levels, with the vertical axis ranging from 0 to 0.9 µg/L. Panel K: A box-and-whisker plot showing urinary tin levels, with the vertical axis ranging from 0 to 4 µg/L. Panel L: A box-and-whisker plot showing urinary zinc levels, with the vertical axis ranging from 0 to 1000 µg/L. Each panel includes box plots for the OMN, LOV, and VGN groups, showing the distribution of urinary trace element levels. Outliers are indicated by individual points outside the whiskers. The data is imputed and unadjusted, not normalized to creatinine.
Between-group differences in urinary trace element levels comparing OMN with LOV (left) and OMN with VGN (right). Data are shown as mean differences and 95 % confidence intervals, adjusted for age, sex, education, subjective social status and physical activity. Differences that remained statistically significant after adjustment for multiple testing are highlighted in blue. No statistically significant differences were observed between LOV and vegans for any elements. LOV, lacto-ovo-vegetarians (n 37); OMN, omnivores (n 40); VGN, vegans (n 38).

Moreover, urinary Hg levels were about 47·6 % lower in vegans than in OMN (P = 0·028), while urinary Cd levels were about 41·7 % higher in vegans than in OMN (P = 0·023). Urinary Hg ranges were approximately 0·1–1·2 µg/l, 0·1–0·8 µg/l and 0·1–0·5 µg/l in OMN, LOV and vegans, respectively, while urinary Cd ranges were approximately 0·2–0·7 µg/l for OMN and LOV and 0·2–1·0 µg/l for vegans.
No statistically significant differences were observed between LOV and vegans for any elements, and no significant differences were found between OMN and LOV or vegans for urinary levels of Al, Co, Cu, Pb, Mo, Ni, Tl, Sn and Zn (online Supplementary Table 3). A sensitivity analysis in which serum cystatin C was added as a covariate confirmed these results (data not shown).
Urinary concentrations normalised to urinary creatinine
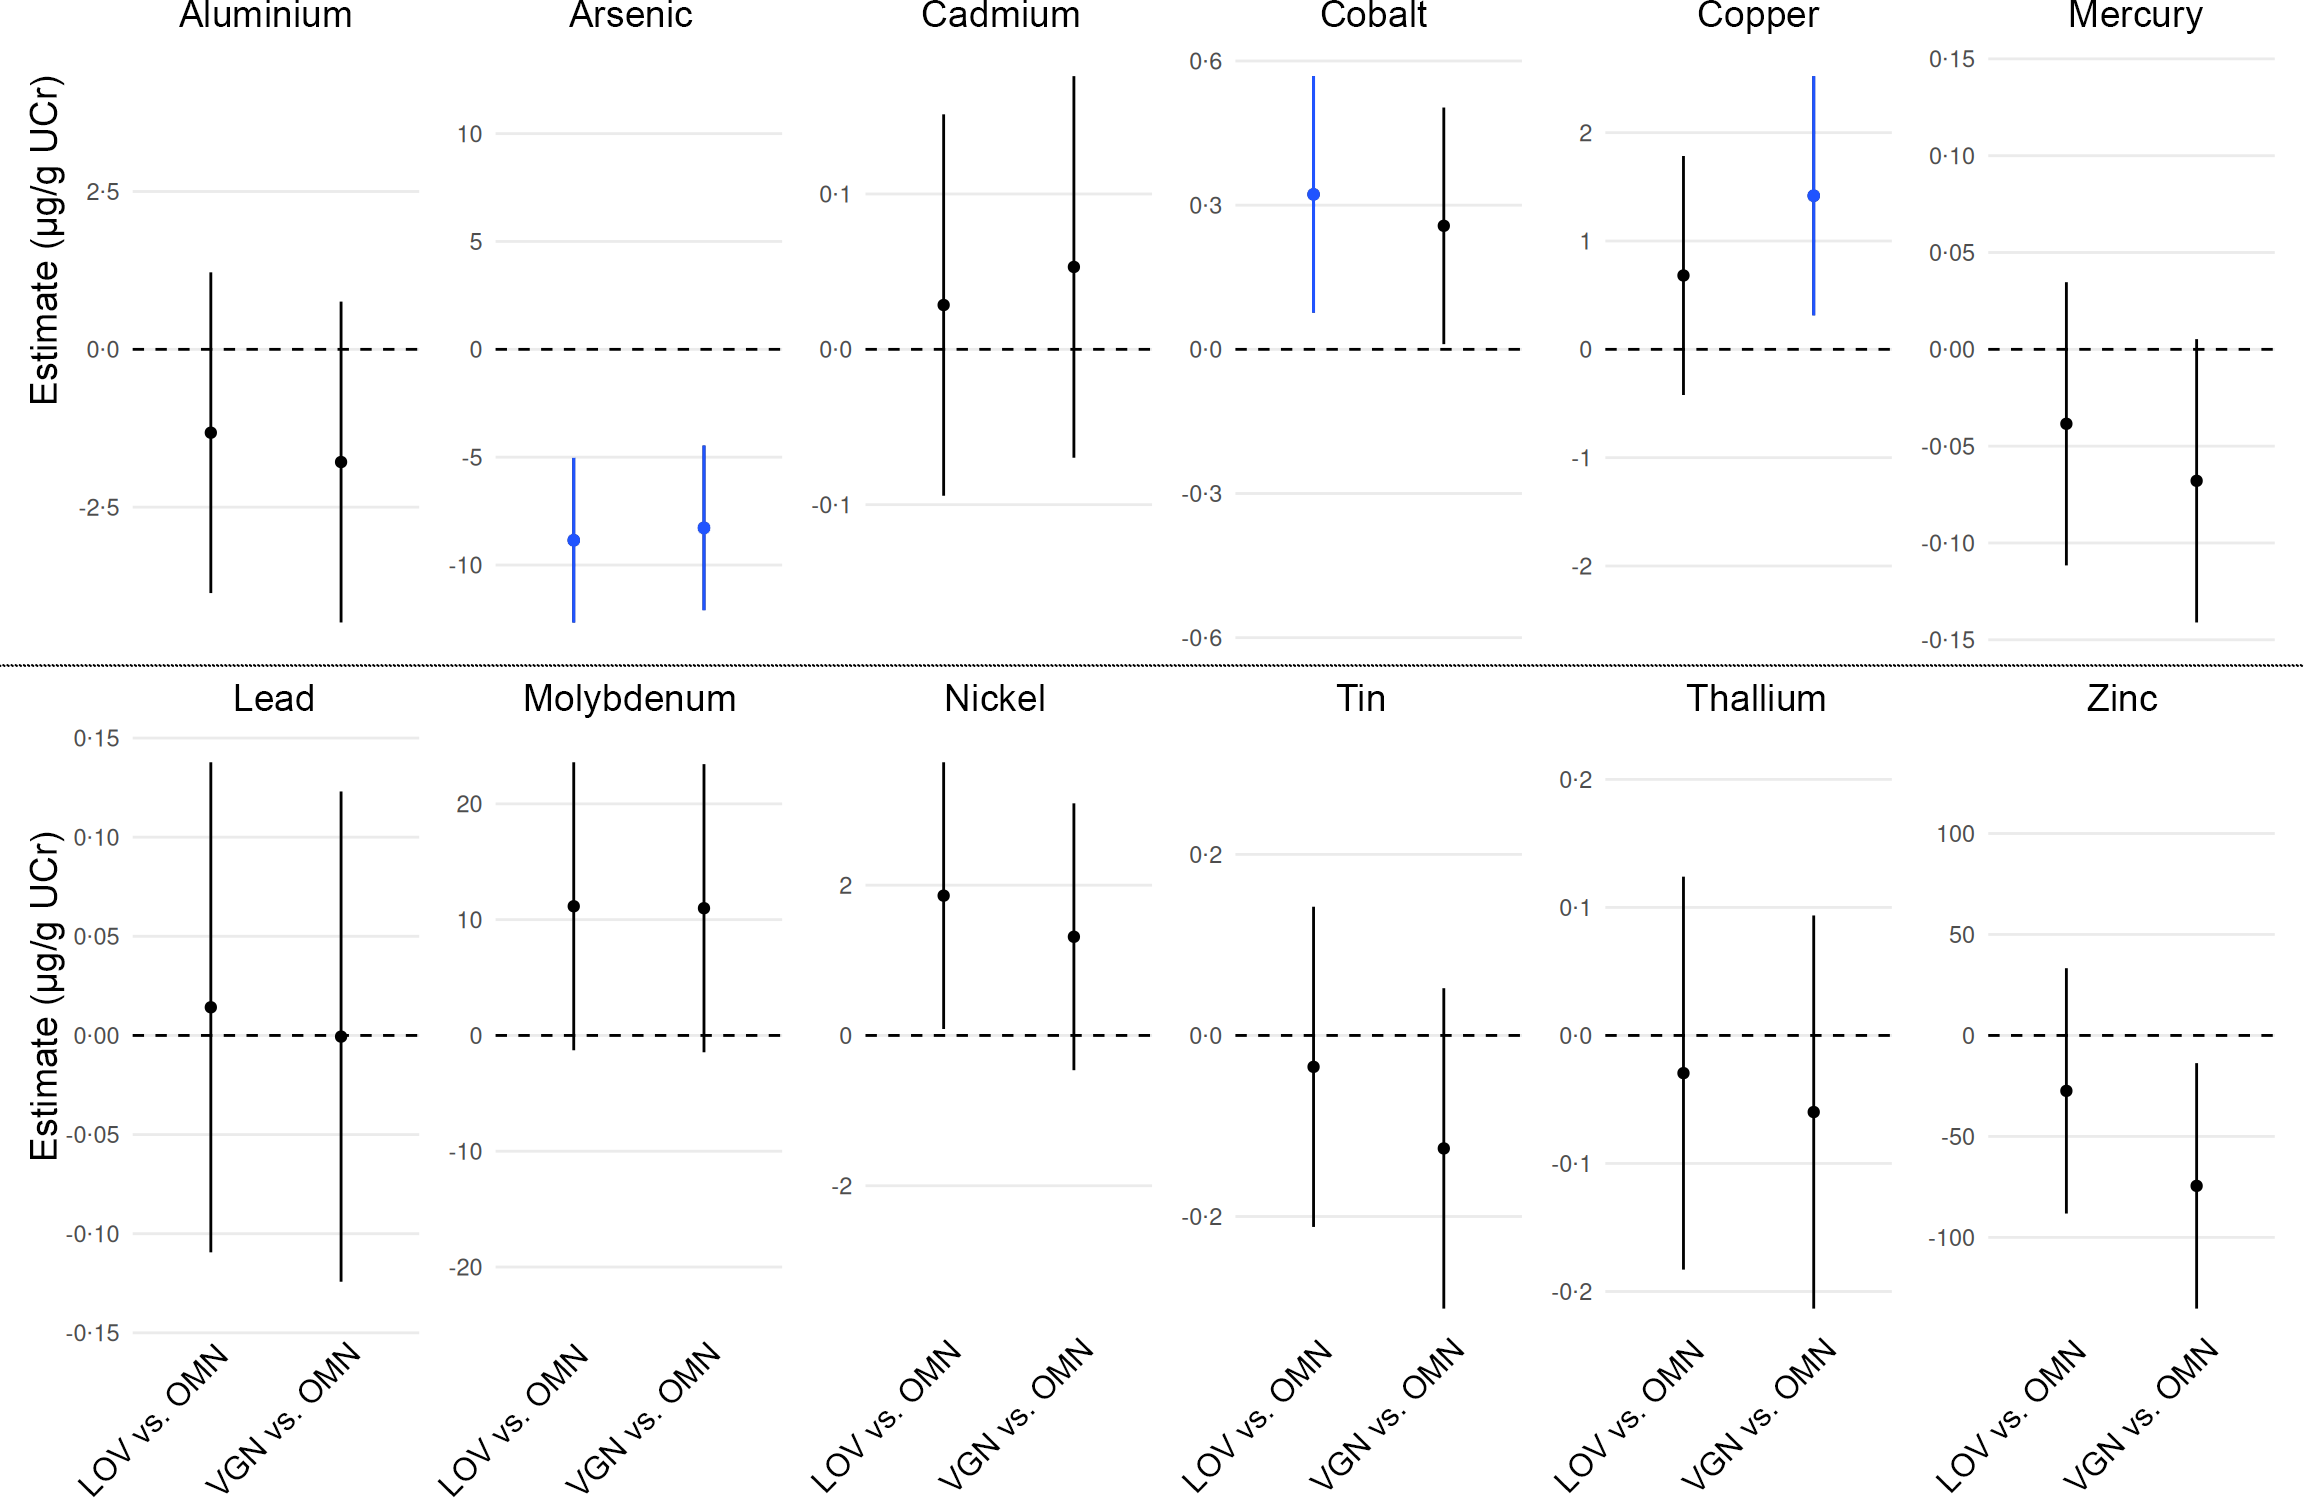
Compared with OMN, unadjusted mean UCr levels were 8 % lower in LOV and 4 % lower in vegans. After adjustment for covariates, these between-group differences in UCr were not significant (P > 0·911). Between-group differences in urinary trace element levels, normalised to UCr levels and adjusted for the same covariates as in the analysis without normalisation to UCr, are shown in Figure 3. This analysis confirmed that there were no statistically significant differences between LOV and vegans, or between OMN and either LOV or vegans in terms of Al, Pb, Mo, Sn and Tl (online Supplementary Table 3). Furthermore, it confirmed that urinary As levels were significantly lower in LOV (–63·4 %) and vegans (–59·4 %) compared with OMN (P < 0·001; Figure 3). Conversely, the significantly higher Cd and significantly lower Hg levels in vegans compared with OMN (found without normalisation to UCr) were not confirmed in the analysis with normalisation to UCr. Moreover, in contrast to the anaylsis without normalisation to UCr, the analysis with normalisation suggested that, compared with OMN, LOV had significantly higher Co levels (+52·5 %; P = 0·035), and vegans had significantly higher Cu levels (+17·3 %; P = 0·040). Additionally, trends were observed suggesting higher Ni levels in LOV (+119·2 %), higher Co levels in vegans (+42·6 %) and lower Zn levels in vegans (–26·1 %) compared with OMN. However, these associations were attenuated after adjustment for multiple testing (P > 0·054; online Supplementary Table 3).
Between-group differences in urinary trace element levels normalised to urinary creatinine. Data shown are mean differences and 95 % confidence intervals, adjusted for age, sex, education, subjective social status and physical activity. Differences that remained statistically significant after adjustment for multiple testing are highlighted in blue. No statistically significant differences were observed between LOV and vegans for any elements. LOV, lacto-ovo-vegetarians (n 37); OMN, omnivores (n 40); VGN, vegans (n 38).

Figure 3. Long description
The image contains multiple vertical line graphs depicting differences in urinary trace element levels normalized to urinary creatinine among different dietary groups. Each graph represents a different trace element: Aluminium, Arsenic, Cadmium, Cobalt, Copper, Mercury, Lead, Molybdenum, Nickel, Tin, Thallium, and Zinc. The x-axis of each graph shows the dietary groups: LOV (lacto-ovo-vegetarians) vs. OMN (omnivores) and VGN (vegans) vs. OMN. The y-axis represents the estimate in micrograms per gram of urinary creatinine (µg/g UCr). Each graph includes mean differences and 95% confidence intervals, adjusted for age, sex, education, subjective social status, and physical activity. Differences that remained statistically significant after adjustment for multiple testing are highlighted in blue. No statistically significant differences were observed between LOV and vegans for any elements. The graphs show varying levels of estimates and confidence intervals for each trace element, indicating the differences in urinary trace element levels among the dietary groups.
Bivariate correlations between urinary trace element levels and dietary or supplementary nutrient intake
No notable correlations were observed between Zn, Cu and vitamin B12 intake (including supplements) and urinary levels of Zn, Cu and Co (r ≤│0·06│). This result was confirmed when urinary trace element levels were normalised to UCr levels (r ≤│0·05│). Dietary supplements included vitamins (A, B1, B2, niacin, pantothenic acid, B6, biotin, folic acid, B12, C, D, E, K1 and K2), minerals (Ca, Cu, Fe, I, K, Mg, Se and Zn) and other substances (choline, coenzyme Q10, DHA, EPA, enzymes, probiotics and quercetin).
No notable bivariate correlations were observed between urinary trace element levels (imputed data) and dietary supplement use as a binary (yes/no; r ≤│0·26│; online Supplementary Figure 2) or metric variable (dosage; r ≤│0·31│; online Supplementary Figure 3). Normalisation to UCr levels yielded comparable results (supplementation yes/no: r ≤│0·33│, online Supplementary Figure 4; dosage: r ≤│0·29│, online Supplementary Figure 5). Additionally, plasma vitamin B12 levels showed no correlation with urinary Co levels (data not shown).
Discussion
Very few studies have assessed urinary trace element levels across different vegetarian diets, defined as diets excluding all flesh foods, such as LOV and vegan diets. Data on vegans are particularly limited, with only single studies reporting urinary As (Norway)(Reference Henjum, Groufh-Jacobsen and Aakre15) and Zn (Germany)(Reference Dawczynski, Weidauer and Richert43,Reference Dawczynski, Weidauer and Richert44) levels. The present study aimed to determine whether vegans, LOV and OMN differ in urinary concentrations of trace elements (Ag, Al, As, Au, Bi, Cd, Co, Cu, Hg, In, Ir, Mo, Ni, Pb, Pd, Pt, Sn, Tl, Zn and Zr). We found lower urinary As levels in vegans and LOV compared with OMN (Figure 2), and this difference remained after normalisation to UCr (Figure 3).
Urinary levels v. Urinary levels normalised to urinary creatinine
The present study found that the only result that persisted after normalisation to UCr were the lower As levels in LOV and vegans (Figures 2 and 3). Higher protein intake, muscle mass and creatine intake all increase UCr levels(Reference Baxmann, Ahmed and Marques79). However, while the ‘Risks and Benefits of a Vegan Diet’ study (Germany) found significantly lower UCr levels (–26 %) in vegans compared with OMN(Reference Abraham, Penczynski and Monien70), the present study found no significant difference in UCr levels between vegans and OMN. Reliable data on total fluid intake are difficult to obtain and were not available in the present study. Nevertheless, it appears unlikely that urine dilution alone could explain the observed differences in urinary As (> 50 % lower in LOV and vegans) or the potential differences regarding Hg (> 40 % lower in vegans) and Cd (> 40 % higher in vegans compared with OMN; online Supplementary Table 3). However, urine dilution in vegans may have somewhat exaggerated the differences for As and Hg and underestimated those for Cd. As the differences for Hg and Cd were both attenuated when urinary levels were normalised to UCr (Figure 3), a dietary influence on these levels appears highly uncertain.
Arsenic
Although one might hypothesise that vegetarians may consume more rice (which can be high in As, particularly brown rice(Reference Scott and Wu14)) and may therefore have higher urinary As levels, the present study found that As levels in LOV and vegans were less than half those in OMN (Figures 2 and 3). Similarly, a study in Norway found significantly lower As levels in spot urine samples from LOV (n 55; median: 3 µg/l) and vegans (n 115; median: 3 µg/l) compared with pescatarians (n 35; median: 21 µg/l)(Reference Henjum, Groufh-Jacobsen and Aakre15). No other studies have reported As status in vegans. However, a study from Kerala, South India, found mean As blood levels to be notably lower in vegetarians (1·2 µg/l; n 40; LOV and lacto-vegetarians) compared with OMN (2·6 µg/l; n 40)(Reference Jose and Ray26). The lower As levels in LOV and vegans may be attributable to the avoidance of fish(Reference Henjum, Groufh-Jacobsen and Aakre15). The health relevance of this finding remains unclear, As in fish is often largely in the form of arsenobetaine, which may be harmless(Reference Henjum, Groufh-Jacobsen and Aakre15). Other factors influencing As exposure include amalgam tooth fillings, As levels in water(Reference Jose and Ray26,Reference Smith, Knight and Fendorf80) and the consumption of rice(Reference Jose and Ray26) (and possibly rice milk(Reference Redan, Zuklic and Hryshko81,Reference Shannon and Rodriguez82) ), seaweed(Reference Bito, Teng and Watanabe83) and dairy products(Reference Henjum, Groufh-Jacobsen and Aakre15,Reference Rock, Thomson and Gansler84,Reference Schrenk and Bignami85) . In Germany, rice is not the main staple grain (unlike in many eastern Asian countries), seaweed intake is generally low (including among LOV and vegans) and rice drinks are not the main milk alternative consumed in Germany. Milk alternatives based on oats and soya (as well as almond) are more commonly consumed.
Cadmium
Cd in food primarily originates from soil, exhibiting considerable regional variation(Reference Harmens, Ilyin and Mills86). Environmental contamination (e.g. from industry and fertiliser) is a main source of dietary Cd exposure(Reference Yabe, Nakayama and Ikenaka55,Reference Gidikova87,Reference Wang, Sang and Guo88) . The present study appears to be the first to report urinary Cd levels in vegans, although the findings were inconclusive (Figures 2 and 3). Only one previous study has reported Cd status in vegans: in Slovakia, whole blood Cd levels in vegans (n 10) were nearly 400 % of those in OMN (n 84)(Reference Krajčovičová-Kudláčková, Ursínyová and Mašánová19). In contrast, whole blood Cd levels in vegetarian women in Norway (n 34, including 15 vegans) were only non-significantly higher (+13 %) compared with OMN (n 124), with similar levels observed in LOV and vegans(Reference Fløtre, Varsi and Helm20). Additionally, an uncontrolled trial in Sweden reported a decrease in Cd hair levels (–50 %)(Reference Srikumar, Johansson and Öckerman30) and an increase in faecal Cd excretion (+17 %)(Reference Vahter, Johansson and Åkesson89) after habitual OMN followed a 3-month lacto-vegetarian diet. Three years after returning to their customary omnivorous diet, Cd levels had reverted to baseline(Reference Srikumar, Johansson and Öckerman30).
The present study found no difference in urinary Cd between LOV and OMN (Figures 2 and 3). Similarly, a study in Sweden found no difference in urinary or blood Cd levels between OMN and individuals adhering to a ‘vegetarian/high-fibre’ diet(Reference Berglund, Akesson and Nermell90). Conversely, a study of children and adolescents in Germany(Reference Vogel, Murawski and Schmied-Tobies32) and a European study across six countries(Reference Snoj Tratnik, Kocman and Horvat91) found urinary Cd levels 35–40 % higher in self-described vegetarians (likely including pescatarians) compared with OMN. Another study in Sweden observed higher median Cd levels in anthroposophic vegetarian women compared with OMN (erythrocytes: +45 %; placenta: +52 %; cord blood: +0 %)(Reference Fagerstedt, Kippler and Scheynius92). Higher Fe stores (ferritin)(Reference Berglund, Akesson and Nermell90,Reference Fagerstedt, Kippler and Scheynius92) and to a lesser extent higher Ca(Reference Srikumar, Johansson and Öckerman30) and Zn intakes(Reference Vance and Chun93) have been suggested to decrease intestinal Cd absorption(Reference Peng, Li and Zhao94). This may be particularly relevant for vegan diets as they are often associated with lower ferritin levels, lower Ca intake and possibly lower Zn bioavailability(Reference Koeder and Perez-Cueto41). The latter also might be decreased by higher Cd intake(Reference Lönnerdal95). Dietary non-haem Fe and Cd share the divalent metal transporter 1 (DMT1) in the duodenum, and higher ferritin stores may downregulate DMT1 activity and thus Cd uptake(Reference Berglund, Akesson and Nermell90). Furthermore, Cd can compete with other divalent cations, such as Ca and Zn, for other intestinal transporters (Ca channels, Zn transporters)(Reference McCarty96). Human data in this regard are largely observational(Reference Gidikova87,Reference Vance and Chun93,Reference Peng, Li and Zhao94,Reference Al-Ayadhi97,Reference Edem, Akintunde and Adelaja98) .
A positive association between urinary Cd levels and cancer risk has been suggested by some(Reference Duan, Xu and Liu99) but not all cohort studies(Reference Filippini, Torres and Lopes100). In a study of colorectal cancer patients in Pakistan, 61 % of whom (n 90) were vegetarians, Cd levels were higher in tumours compared with non-tumour tissue among vegetarians, but not in OMN(Reference Qayyum, Farooq and Baig101). Nevertheless, cohort studies including vegans suggest a reduced cancer risk in vegans compared with OMN(Reference Segovia-Siapco and Sabaté102).
Mercury
The present study appears to be the first to report Hg levels in biosamples of vegans. Although we observed > 40 % lower Hg levels in vegans compared with OMN (Figure 2), this was not confirmed when values were normalised to UCr (Figure 3). Previous studies with vegetarians have shown similar results: a study in Norway reported that vegetarian women (n 34, including 15 vegans) had about 45-fold lower median whole blood Hg levels than omnivorous women (n 124)(Reference Fløtre, Varsi and Helm20). Similarly, a study in India found that vegetarians had more than threefold lower mean blood Hg levels than OMN(Reference Jose and Ray26). Furthermore, lower hair Hg levels in vegetarians compared with OMN have been suggested by studies in New Zealand, the USA(Reference Endo, Hayasaka and Ogasawra27), Hong Kong(Reference Dickman, Leung and Leong28), Sweden(Reference Srikumar, Källgård and Ockerman29,Reference Srikumar, Johansson and Öckerman30) and India(Reference Yamaguchi, Matsumoto and Kaku31). The lower Hg levels in LOV and vegans are likely due to the avoidance of fish(Reference Vogel, Murawski and Schmied-Tobies32). A large study from the USA found that seafood consumers had higher urinary Hg levels than non-seafood consumers(Reference Wells, Kopylev and Nachman103). However, urinary Hg levels may not reflect total Hg body burden(Reference Ye, Kim and Jeon53).
Cobalt, copper, nickel and zinc
In the present study, findings regarding Co, Cu, Ni and Zn were unclear, considering both urinary levels normalised to UCr (Figure 3) and those not normalised to UCr (Figure 2). In contrast, significantly higher median Co levels were found in anthroposophic vegetarian women in Sweden, compared with OMN, both in erythrocytes (+29 %) and placenta (+32 %)(Reference Fagerstedt, Kippler and Scheynius92). Previous studies comparing serum Cu levels in vegans and OMN found lower levels in vegans (Russia)(Reference Galchenko, Rizzo and Sidorova4,Reference Medkova, Mosiakina and Biriukova6) , or similar levels in vegans and OMN (Germany, Russia)(Reference Simon, Lossow and Pellowski3,Reference Klein, Dawczynski and Schwarz5–Reference Simon, Richter and Lossow8) . No previous studies have reported Ni status in vegans. Although an association between diet and Ni allergy has been hypothesised(Reference Röhrl and Stenberg104), a study of students (15–23 years old) in Sweden (2000–2004) found no association between vegetarian/vegan dietary habits and Ni allergy(Reference Fors, Persson and Bergström105). Ni allergy usually occurs as contact dermatitis following dermal exposure. However, in highly sensitive individuals with systemic Ni allergy syndrome, dietary Ni intake can exacerbate symptoms(Reference Angelo Mario106).
Previous studies suggest a lower Zn status (measured in blood, urine or saliva) in vegans compared with OMN(Reference Weikert, Trefflich and Menzel42–Reference Freeland-Graves, Bodzy and Eppright45). A study in eastern Germany found lower 24-h urinary Zn excretion (–36 %) in vegans than OMN, but this was not statistically significant in men(Reference Dawczynski, Weidauer and Richert43,Reference Dawczynski, Weidauer and Richert44) . Similarly, a study from western Germany found lower urinary Zn levels in self-described vegetarians than OMN(Reference Trame, Wessels and Haase46).
Other elements
The present study appears to be the first to report Al, Pb, Mo, Tl or Sn levels in biosamples of vegans, and we observed no significant differences between dietary groups for these elements. Similarly, a study from Norway found comparable whole blood Pb levels in vegetarians (including LOV and vegans) and OMN(Reference Fløtre, Varsi and Helm20), while a study in Germany (1960s) observed lower urinary Tl levels in non-smoking OMN (n 3) than in vegetarians (n 3, presumably non-smokers)(Reference Weinig and Zink40). Furthermore, a study with vegetarians in Pakistan found higher Sn levels in tumour tissues compared with non-tumour tissues(Reference Qayyum, Farooq and Baig101).
In the present study, Bi, Au, In, Ir, Pd, Pt, Ag and Zr were either not detected or found only in a few isolated urine samples, suggesting no notable differences between the three diet groups. Thus, the present study suggests that Al, Bi, Au, In, Ir, Pb, Mo, Pd, Pt, Ag, Tl, Sn and Zr may not typically be of particular concern for LOV and vegans compared with OMN.
Ag may warrant attention, as excessive intake can cause argyria and ‘colloidal Ag’ supplements are sold and recommended by some alternative health proponents (including in Germany). Notably, a case report from Hungary described argyria in a vegetarian following colloidal Ag supplementation(Reference Tóth, Marschalkó and Hársing11).
Predominantly faecal excretion for Ag(Reference DiVincenzo, Giordano and Schriever107), Bi(Reference Qvigstad and Waldum108) and Zr(Reference Schroeder and Balassa109) may explain their absence (Bi, Ag) or limited detection (Zr) in the present study. In contrast, Au(Reference Hadrup, Sharma and Poulsen110), Pt(Reference Begerow111,Reference Munker, Kilo and Röß112) and possibly Pd(Reference Begerow111,Reference Munker, Kilo and Röß112) are predominantly excreted via urine, yet were not detected (Au, Pd) or detected in only one sample (Pt). In and Ir are excreted via both urine and faeces(Reference Munker, Kilo and Röß112,Reference Hines, Roberts and Andrews113) , but human data remain limited.
Using lower LOQ than the present study, a biomonitoring study in Germany (n 102) detected urinary Bi in 14 % (LOQ: 0·01 µg/l), Au in 12 % (LOQ: 0·013 µg/l), Pt in 8 % (LOQ: 0·016 µg/l), Ag in 5 % (LOQ: 0·014 µg/l) and Zr in 62 % (LOQ: 0·01 µg/l) of samples. In, Ir (LOQ: 0·009 µg/l) and Pd (LOQ: 0·02 µg/l) were not detected(Reference Heitland and Köster65). Other German studies detected urinary Bi ≥ LOQ in 33 % participants, with In not detected(Reference Schmied, Murawski and Kolossa-Gehring114), or urinary Pt > LOQ (0·001 µg/l) in 100 % of participants(Reference Munker, Kilo and Röß112). Earlier German biomonitoring data (n 1080) reported mean urinary concentrations of Au (0·046 µg/l), Pt (0·0022 µg/l) and Ir (0·00024 µg/l), with dental restorations strongly influencing Au and Pt but not Ir levels(Reference Becker, Schulz and Kaus115).
A study from France (n 2419) reported urinary levels ≥ LOQ for Au in 100% (LOQ: 2·5 µg/l), Ir in 42% (LOQ: 0·006 µg/l), Pd in 84% (LOQ: 0·06 µg/l) and Pt 62% (LOQ: 0·005 µg/l) of samples(Reference Oleko, Saoudi and Zeghnoun116). In Italy, urinary Ag > LOQ (not specified) was detected in 40% of samples from a rural area compared with 61% of samples from urban or industrially exposed areas(Reference Chellini, Maurello and Cortini117). Urinary Pt > LOQ was detected in 35–40 % of samples across all areas(Reference Chellini, Maurello and Cortini117). Earlier studies in Italy detected urinary Pt in 96% of city police officers(Reference Iavicoli, Bocca and Petrucci118) and 0% of dental care workers(Reference Iavicoli119), as well as urinary Pd in 35% of dental care workers(Reference Iavicoli119). In Australian pregnant women, urinary Bi and Ag were detected in 33% and 43%(Reference Hinwood, Stasinska and Callan120).
Strengths and limitations
The present study appears to be the first to report trace element levels in biosamples from vegans for six (Al, Co, Mo, Ni, Sn and Tl) of the twelve trace elements detected. Moreover, no previous study involving vegans has reported urinary level analyses for the eight elements that were not detected in any samples (Ag, Au, Bi, In, Ir and Pd) or detected in only a few samples (Pt and Zr).
Strengths of the present study include the use of comparison groups that are highly similar apart from diet, detailed assessment of dietary supplement use(Reference Storz, Müller and Niederreiter59,62) , food intake-based dietary classifaction with well-defined criteria and blinding of the statistician to group identity. An additional strength is the dual approach, which includes both crude and creatinine-adjusted urinary trace element concentrations. As noted by Abraham et al., creatinine adjustment of biomarker concentrations in spot urine may lead to falsely lower levels in OMN in the context of dietary patterns with varying protein intake(Reference Abraham, Penczynski and Monien70). Accordingly, we followed the recommendations of Abraham et al. Nevertheless, to provide a more comprehensive overview, we also present creatinine-adjusted values. Advantages and disadvantages of both approached are discussed in detail elsewhere(Reference Abraham, Penczynski and Monien70), including Hoet et al. (2016), who questioned whether systematic creatinine adjustment should be used in environmental and dietary studies(Reference Hoet, Deumer and Bernard73).
Limitations include the small sample size, which prevented sex-stratified analysis, and the use of a single sample of morning urine per participant rather than the gold-standard 24-h urine collection. Morning urine is more concentrated and may overestimate 24-h urine levels(Reference Bottin, Lemetais and Poupin121), and a more standardised protocol for obtaining urine samples has been recommended(Reference Abraham, Penczynski and Monien70). Daily diurnal variation appears to affect the excretion of some elements (e.g. potassium) more than others(Reference Moore, Rehkämper and Kreissig64). Additionally, it is well known that hydration habits affect crude urinary excretion levels(Reference Henjum, Groufh-Jacobsen and Aakre15,Reference Araki and Aono122) . Furthermore, except for Mo, all analyses are based on partly imputed data. Moreover, whole blood is the preferred matrix for Cd and Pb, as more than 90 % of these elements are associated with erythrocytes. Additionally, the set of twenty trace elements analysed excludes several other elements of potential relevance, including Cr, fluoride, iodine, Mn, Ra, Se and uranium. Finally, we acknowledge that no food group analysis was performed, as only nutrient-level intake data were available from the main study. This prevented corresponding correlation analyses, such as examining associations between rice intake and urinary As concentrations. We acknowledge that an approach based on more than a single biomaterial (e.g. a combination of blood and urine) would have been preferable and could have allowed for additional insights into trace element levels in vegans as comparted with vegetarians and OMN. Dietary intakes were based on a previously introduced formula by Kristensen et al. (Reference Kristensen, Madsen and Hansen68,Reference Kristensen, Madsen and Hansen69) and reflect usual intakes over a period of a week. Nutrient intakes thus do not reflect the 24-h period prior to spot urine sample provision.
Future studies
It would be useful if future studies assessed the content of non-essential trace elements in foods to allow for better estimates of dietary intake(Reference Doulgeridou and Amlund123). Additional human studies regarding the potential health relevance of As, Cd and Hg for LOV and vegans would be helpful, given the increasing interest in such plant-based dietary patterns(Reference Kwiatkowska, Olszak and Formanowicz124). Further studies may assess differences in urinary creatinine levels between vegans, LOV and OMN. Of particular interest would be to identify physiological thresholds (if they exist) for meat intake in omnivorous diets, above which new homeostatic points are reached, characterised by greater urinary excretion of creatinine. Moreover, the relevance of mitigating Cd and enhancing Zn exposure in vegans (e.g. through Zn fortificiation) could be explored in cohort studies and randomised trials. Large international cohort studies involving vegans(Reference Segovia-Siapco and Sabaté102) are required to put isolated findings into context. Our data analysis approach was to present urinary values without and with normalisation to UCr. However, a novel approach has recently been suggested that uses a variable power functional creatinine correction method, taking into account factors (sex, age, diet and renal function) that affect UCr levels(Reference Carmine125) (for which the present study adjusted). Future studies may assess the suitability of this method for comparing OMN, LOV and vegans. Additionally, future well-powered studies may investigate the potential contribution of supplement contamination in greater detail.
Conclusions
The present study suggested lower urinary As levels in vegans and LOV than in OMN. Furthermore, previous evidence suggesting that individuals who do not eat fish have lower Hg levels was confirmed for vegans when values were not normalised to UCr, but not when normalised to UCr. Similarly, earlier findings that Cd exposure may be higher in vegans were confirmed without normalisation to UCr, but not after normalisation. Importantly, the present study does not support hypotheses regarding potential Cu deficiency or Mo or Pb excess in LOV or vegans. Moreover, lower Zn levels in vegans were not clearly shown. The potential differences observed only after normalisation to UCr (regarding Co, Cu, Ni and Zn) require confirmation in future studies involving vegans.
Supplementary material
For supplementary material/s referred to in this article, please visit https://doi.org/10.1017/S0007114526108071
Acknowledgements
We are grateful to the participants for their participation in the study. Maximilian A. Storz would like to express his deep gratitude to the Karl und Veronica Carstens Foundation in Essen, Germany.
Funding for this secondary analysis was provided by internal resources of the Institute for Prevention and Cancer Epidemiology (IPE). The study and the position of Maximilian A. Storz were funded by the Karl and Veronica Carstens Foundation in Essen, Germany.
C. K.: Conceptualisation-Lead, Data curation-Equal, Investigation-Lead, Methodology-Lead, Project administration-Lead, Validation-Supporting, Visualisation-Supporting, Writing – original draft-Lead; K. B. M.: Conceptualisation-Equal, Funding acquisition-Lead, Methodology-Equal, Project administration-Equal, Supervision-Equal, Writing – review & editing-Equal; A. B.: Formal analysis-Lead, Visualisation-Lead, Writing – review & editing-Supporting; L. N.: Writing – review & editing-Supporting; S. K.: Writing – review & editing-Equal; L. H.: Project administration-Equal, Writing – review & editing-Equal; R. H.: Conceptualisation-Equal, Supervision-Equal, Writing – review & editing-Equal; M. A. S.: Conceptualisation-Equal, Funding acquisition-Equal, Methodology-Equal, Project administration-Equal, Supervision-Equal, Writing – review & editing-Equal.
All authors have read and approved the final version of the manuscript.
The data are available from M.A.S.(maximilian.storz@uniklinik-freiburg.de) upon reasonable request.




 Open access

