

Introduction
The two hallmarks of obsessive compulsive disorder (OCD) are the presence of repetitive intrusive thoughts and compulsive rituals (APA, 2013). Compulsions are commonly performed to prevent feared outcomes associated with obsessive thoughts, and people with the disorder frequently avoid situations or objects that trigger their obsessions and compulsions (Salkovskis, Reference Salkovskis1991; Storch et al., Reference Storch, Rasmussen, Price, Larson, Murphy and Goodman2010). Although some of the feared outcomes may be as bad as people imagine (e.g. negative repercussions of murder or molestation), there are a host of others that are probably not as detrimental as some patients expect (e.g. becoming ill, insulting someone, etc.). Indeed, many of these outcomes are common occurrences that the majority of people experience at some point in their lives. Cognitive behavioural theorists attribute this proclivity for over-estimating the negative valence of feared outcomes to dysfunctional beliefs held by people with OCD (Rachman, Reference Rachman1997; Salkovskis, Reference Salkovskis1985).
Over-estimation of threat, or the tendency to exaggerate the likelihood and severity of negative events, is one dysfunctional belief associated with OCD (OCCWG, 1997, 2001, 2005; Rouel et al., Reference Rouel, Stevenson and Smith2018). Support for this definition has come primarily from studies that measure over-estimation of threat with the Obsessive Beliefs Questionnaire (OBQ; OCCWG, 2005), which asks individuals to indicate the extent to which they agree with a number of statements about threat and other beliefs associated with the disorder (Moritz and Jelinek, Reference Moritz and Jelinek2009). However, because the OBQ includes questions about both facets, it is unclear if people with OCD over-estimate the likelihood of harm in general or their personal susceptibility to harm (OCCWG, 1997). Using other methods, studies seeking to clarify this distinction have failed to find a relationship between OCD symptoms and general over-estimation of harm in clinical samples (Moritz and Jelinek, Reference Moritz and Jelinek2009; Moritz and Pohl, Reference Moritz and Pohl2006; Woods et al., Reference Woods, Frost and Steketee2002).
Moritz and Jelinek (Reference Moritz and Jelinek2009) found that when asked to guess the frequency of OCD-related, negative and positive events, people with OCD indicated they were more susceptible to experience negative outcomes, whereas healthy subjects believed they were more likely to experience positive events. The authors concluded that people with OCD may lack an unrealistic optimism bias – the belief that one is less likely to experience harm or more likely to experience positive outcomes than are others – that non-anxious individuals possess. More recent studies have likewise found the lack of an unrealistic optimism bias in other OCD samples (Zetsche et al., Reference Zetsche, Rief and Exner2015). A study by Woods et al. (Reference Woods, Frost and Steketee2002) suggested that people with the disorder not only over-estimate the severity of negative events, but also under-estimate their ability to cope with such occurrences. What is unclear is if individuals with OCD also miscalculate the extent to which they will be emotionally impacted by experiences. Given their tendency to over-estimate and avoid threat, it is possible that they are especially inaccurate at predicting their emotional responses to future events, an ability called affective forecasting (Wilson and Gilbert, Reference Wilson and Gilbert2003).
Research on affective forecasting indicates that people generally miscalculate the emotional impact of different experiences. Specifically, people tend to over-estimate both the magnitude and duration of their emotional response to positive and negative events (less common is the tendency to under-estimate one’s emotional response). Although this impact bias error may motivate individuals to avoid negative outcomes, Wilson and Gilbert (Reference Wilson and Gilbert2003) posit that it may likewise have negative implications. They suggest that ‘overestimating the impact of negative events [may create] unnecessary dread and anxiety about the future’ (p. 134). It seems plausible, then, that individuals with anxiety may possess an especially pronounced impact bias that causes them to fear and avoid certain situations. A study by Wenze et al. (Reference Wenze, Gunthert and German2012) suggests that anxiety is associated with especially inaccurate affective forecasting ability in a non-clinical sample. The present study is designed to examine general affective forecasting accuracy in individuals meeting diagnostic criteria for OCD relative to people with social anxiety disorder and to non-anxious individuals. Because we were interested in determining if people with OCD have a global deficit in affective forecasting, we did not assess accuracy with situations specific to OCD concerns.
Moreover, we investigated the relationship between affective forecasting accuracy and risk assessment. Over-estimation of threat may be related to other dysfunctional thoughts and behaviours associated with OCD (OCCWG, 1997), including avoidance of risk (Admon et al., Reference Admon, Bleich-Cohen, Weizmant, Poyurovsky, Faragian and Hendler2012). Indeed, if people believe that danger is widespread or that they are especially vulnerable to harm, they may make a greater effort to avoid potentially unsafe situations. Likewise, people who believe they will be more emotionally impacted by negative outcomes may also be less likely to engage in risky behaviour. Therefore, in the current study, we asked individuals with OCD, a clinical control group of socially anxious people, and non-anxious individuals to evaluate the potential risk and reward associated with behaviours across different domains. We hypothesized that the OCD group would make less accurate affective forecasts than the non-anxious group, and that a greater discrepancy between predicted and actual emotional response would be associated with risk assessment across domains. We included a socially anxious comparison group in order to test whether evidence of any affective forecasting bias is specific to OCD or whether it generalizes to other groups characterized by high levels of anxiety. We chose social anxiety as a comparison given its shared characteristics (excessive anxiety, fear of negative outcomes) with OCD. We were interested in whether people with social anxiety would demonstrate a general affective forecasting bias given that their fear of negative outcomes is limited to one domain (i.e. social situations), whereas those of people with OCD tend to apply to myriad situations.
Method
Subjects
The subjects were 123 people who, after a diagnostic clinical interview, were assigned to one of three groups: OCD with or without comorbid anxiety disorders (‘OCD’; n = 41, 63% female), social anxiety disorder (SAD) with no comorbid OCD (‘SAD’; n = 40, 55% female and one transgender woman), and non-anxious and non-OCD (‘non-anxious’; n = 42, 36% female). Recruitment methods were postings on public notice boards, hospital treatment clinics, and university job boards and study pools accessible to adults in the Boston area. In addition, a subset of subjects was recruited from an OCD treatment centre (consisting of residential, partial hospitalization, and intensive outpatient levels of care) at Rogers Memorial Hospital in Oconomowoc, Wisconsin. All subjects were compensated at the rate of $10 per hour or with study pool credit.
Materials and procedures
A brief telephone screening determined people’s eligibility prior to their enrolling in the study, and all subjects provided written informed consent as approved by Harvard’s Committee on the Use of Human Subjects and in compliance with the Declaration of Helsinki. All study materials were completed in person in private testing rooms in Massachusetts and Wisconsin (only OCD subjects recruited from Rogers Memorial Hospital were tested there). The first author conducted all clinical interviews and assigned subjects to one of three groups based on the MINI International Neuropsychiatric Interview (Sheehan et al., Reference Sheehan, Lecrubier, Sheehan, Amorim, Janavs, Weiller and Dunbar1998), a semi-structured measure for diagnosing DSM-IV disorders. Subjects meeting criteria for OCD were also assessed by the first author with the clinician-rated Yale-Brown Obsessive Compulsive Scale (YBOCS) and symptom checklist (Goodman et al., Reference Goodman, Price, Rasmussen, Mazure, Delgado, Heninger and Charney1989a, Reference Goodman, Price, Rasmussen, Mazure, Fleischmann, Hill and Charney1989b) to determine symptom severity and presence of specific OCD subtypes. The measure consists of 10 questions and yields a total score of zero (no symptoms) to 40 (extreme symptoms). The gold-standard measure of OCD symptom severity, the YBOCS is psychometrically sound and responsive to clinical change (Goodman et al., Reference Goodman, Price, Rasmussen, Mazure, Delgado, Heninger and Charney1989a, Reference Goodman, Price, Rasmussen, Mazure, Fleischmann, Hill and Charney1989b).
All groups then completed a battery of self-report and behavioural measures as a part of a larger investigation of biased thinking in OCD. Time to completion of the entire study was approximately one-and-a-half to two hours, and subjects were permitted breaks between tasks if necessary. Irrespective of diagnosis, all subjects completed the Obsessional Beliefs Questionnaire (OBQ-44), a self-report measure of beliefs common in OCD (OCCWG, 2001, 2003, 2005). Consisting of 44 questions, the OBQ asks people to indicate the extent to which they agree or disagree with statements about inflated responsibility and threat estimation, importance and significant of thoughts, and intolerance of uncertainty and perfectionism. High scores indicate greater presence of dysfunctional thoughts. The scale has strong psychometric properties and has been used in both non-clinical and clinical samples (OCCWG, 2005). The internal consistency in our sample was α = .97 (all subscales: α ≥ .91).
Social anxiety symptoms of all subjects were assessed with the Liebowitz Social Anxiety Scale (LSAS), a self-report measure of social anxiety symptoms (Liebowitz, Reference Liebowitz1987). With a maximum score of 144, the LSAS asks individuals to indicate the extent to which they fear and avoid different social and performance situations. Studies have established it as a valid measure of social anxiety with strong internal and external consistency (Fresco et al., Reference Fresco, Coles, Heimberg, Liebowitz, Hami, Stein and Goetz2001) and suggest that a score of 30 indicates clinical levels of social anxiety disorder (Mennin et al., Reference Mennin, Fresco, Heimberg, Schneier, Davies and Liebowitz2002; Rytwinski et al., Reference Rytwinski, Fresco, Heimberg, Coles, Liebowitz, Cissell and Hofmann2009). The internal consistency in our sample was α = .98.
We included a 20-item dimensional measure of depressive symptoms with the Center for Epidemiologic Studies Depression Scale Revised (CESD; Eaton et al., Reference Eaton, Smith, Ybarra, Muntaner, Tien and Maruish2004). With possible scores ranging from zero to 60 and a clinical cut-off of 16, the self-report measure assesses the frequency with which people have experienced depressive symptoms over the most recent week. The CESD has high internal consistency and sensitivity, and performs well with subjects of diverse ages (Lewinsohn et al., Reference Lewinsohn, Seeley, Roberts and Allen1997; Radloff, Reference Radloff1977). In the current sample, the scale’s internal consistency was α = .95.
The Domain-Specific Risk-Taking (DOSPERT) Scale is a 30-item questionnaire that asks subjects to rate how risky, beneficial, and likely they are to engage in a number of activities in different domains, including financial, health and safety, social, recreational, and ethical (Blais and Weber, Reference Blais and Weber2006). Examples include ‘admitting that your tastes are different from those of a friend’ (social domain) and ‘driving a car without wearing a seat belt’ (health/safety domain). The DOSPERT has high internal consistency (Blais and Weber, Reference Blais and Weber2006), including in the present study (α for all subscales ≥ .85).
To examine affective forecasting accuracy, we used a task developed by Kermer et al. (Reference Kermer, Driver-Linn, Wilson and Gilbert2006). When subjects first arrived at the laboratory, they were each given $5, which they were told they could keep. They were then asked to privately record their current affective state – that is, how happy, sad, pleased, and disappointed they felt – on a scale ranging from zero (not at all) to 100 (extremely). Subjects were then asked to predict on the same scale how happy, sad, pleased and disappointed they would feel immediately and ten minutes after a coin toss in which they win or lose money (heads they lose $3, tails they win an additional $5). Then after completing the clinical interview and study measures described above, subjects viewed a virtual coin flip on the computer; half of subjects won the coin toss and were given an additional $5, whereas the other half lost the coin toss and were penalized $3. Subjects then rated their affect again both immediately after and 10 minutes after the coin flip.
Data analysis plan
To compare affective forecasting accuracy among the three groups, we first calculated the difference between subjects’ baseline affect when making the forecast and their predicted affect. For example, if a person’s baseline happiness was 10 and she predicted that her happiness would increase to 30 after winning $5, then her affective forecast for this emotion would be recorded as +20. If she predicted that her sadness would fall by 20 points after winning, then her affective forecast for sadness would be recorded as –20. Next, we calculated the difference scores between affect just prior to and immediately following the coin toss. If the same person rated her happiness as 40 just prior to the coin toss and then 50 just after it, then her actual happiness score would be recorded as +10. If her sadness fell from 20 to 0, then her actual sadness score would be –20. In this example, the subject over-estimated how happy she would be by 10 points, but accurately predicted how sad she would be. We then performed a 3 (group: OCD, SAD, non-anxious) × 2 (outcome: win or lose) × 2 (affect: predicted and actual) repeated measures ANOVA to examine the groups’ forecasting accuracy. Predicted change in affect was used for the first time point and actual change in affect was used for the second time point. We repeated this analysis for each of the four emotions measured and used the same procedure to analyse differences between predicted and actual affect ratings ten minutes following the coin toss. With 123 subjects, we had .97 power to detect medium to large effects (Faul et al., Reference Faul, Erdfelder, Lang and Buchner2007).
Results
Preliminary analyses
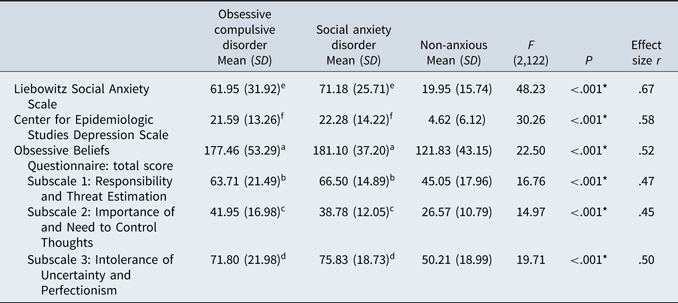
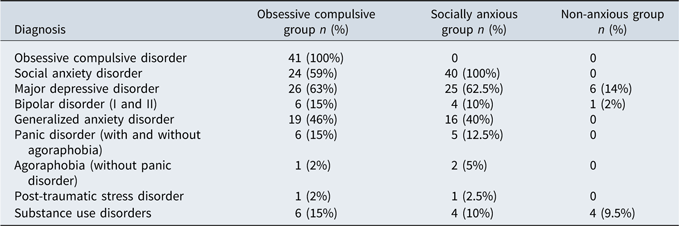
The OCD and SAD groups had higher scores than the non-anxious group on all dimensional measures of depression, social anxiety symptoms, and dysfunctional thinking as measured by the OBQ-44 (Table 1). The mean age of OCD subjects was 26.1 years (SD = 8.4), which was significantly younger than that of the non-anxious group (p < .001), which had a mean age of 37.6 years (SD = 16.1). The SAD group had a mean age of 31.0 years (SD = 13.6), which did not differ from the OCD group (p = .29), but was marginally lower than the non-anxious group (p = .08). There were no significant differences in the proportion of men and women among the three groups [χ(4) = 9.04, p =.06]. Individuals with OCD possessed moderately severe OCD symptoms, as indicated by a mean score of 21.00 (SD = 5.45) on the YBOCS (Goodman et al., Reference Goodman, Price, Rasmussen, Mazure, Fleischmann, Hill and Charney1989b). Several subjects met criteria for a past or current episode of a comorbid disorder (Table 2), and 24 people in the OCD group also met diagnostic criteria for social anxiety disorder. Both the OCD and SAD groups had social anxiety symptoms in the clinically severe range, as indicated by mean scores above 60 on the LSAS (Rytwinski et al., Reference Rytwinski, Fresco, Heimberg, Coles, Liebowitz, Cissell and Hofmann2009).
Group characteristics

* p ≤ .05 criteria. Means that share the same superscript letter do not significantly differ from one another.
DSM-5 diagnoses by group

Affective forecasting
A multi-variate analysis of variance (MANOVA) indicated that the groups’ baseline affect differed significantly. The analysis indicated that the OCD and SAD groups were less happy [F(2,20) = 7.01, p = .001, r = .32, 90% CI: 0.16, 0.43] and pleased [F(2,120) = 7.12, p = .001, r = .33, 90% CI: 0.17, 0.43] and more sad [F(2,120) = 18.60, p < .001, r = .49, 90% CI: 0.36, 0.57] than the non-anxious group. Moreover, the socially anxious group was more disappointed at baseline than both the non-anxious and OCD groups [F(2,120) = 8.87, p = .001, r = .36, 90% CI: 0.21, 0.46], whose scores did not differ from one another.
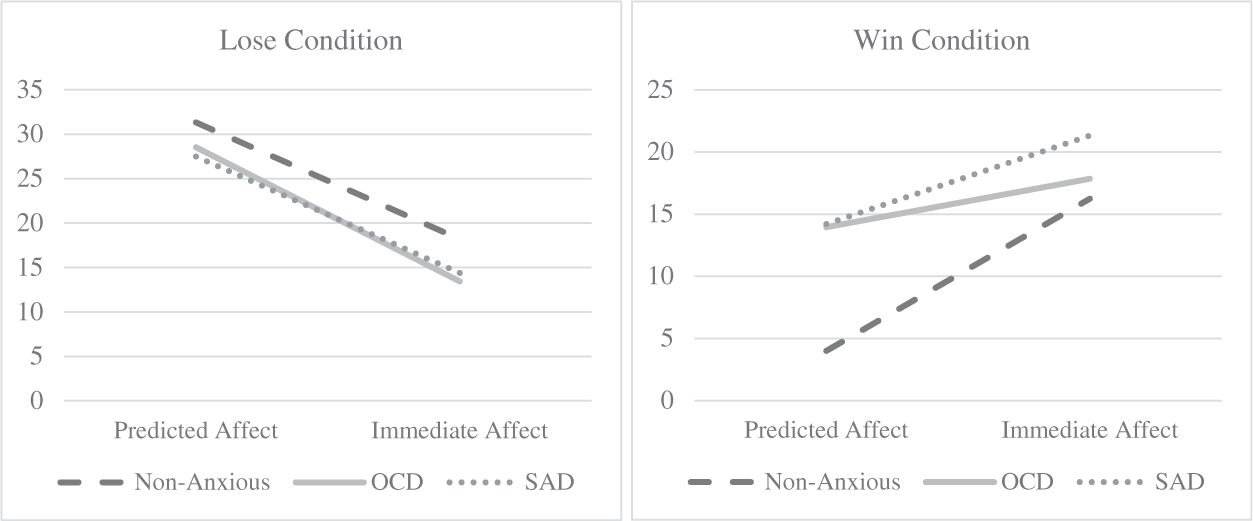
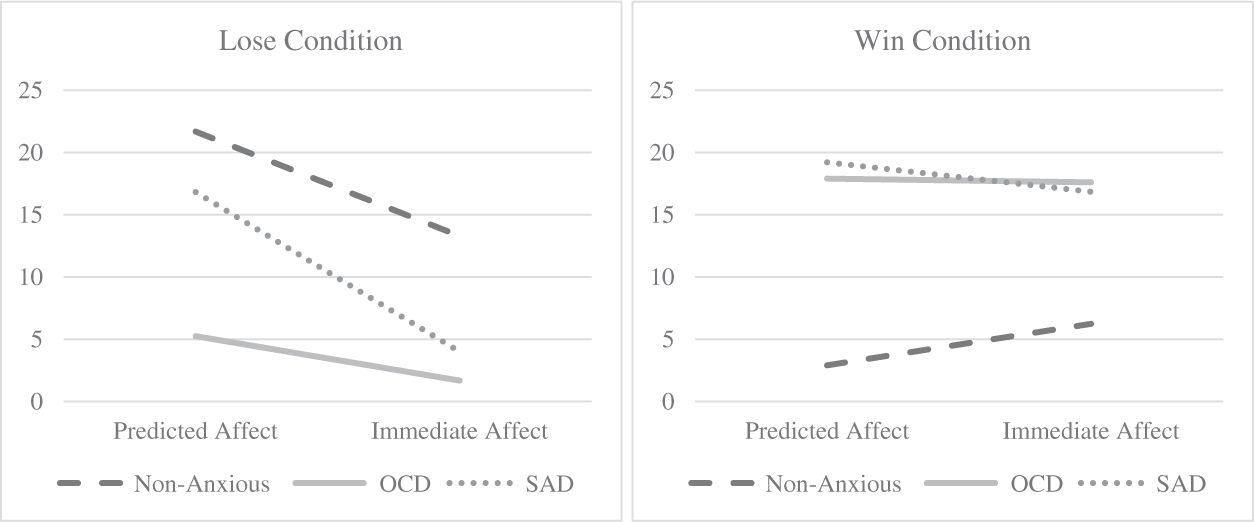
Overall, mean scores indicated that the direction of predicted and actual change were in the same direction for each group and each emotion. Indeed, results from the repeated measures ANOVAs indicated a main effect of outcome for all emotions, such that subjects who won the coin toss experienced mean increases of happiness and pleasure and mean decreases in sadness and disappointment compared with subjects who lost the coin toss and subsequently experienced changes in the opposite directions, respectively (all p < .001). Other effects varied by emotion. For happiness (Fig. 1), there was a main effect of affect, such that subjects experienced a more positive impact on happiness after the coin toss than they predicted, regardless of if they won or lost money [F(1,117) = 25.66, p < .001, r = .42, 90% CI: 0.29, 0.53]. That is, subjects in the loss condition experienced less of a decrease in happiness than they had anticipated, whereas those in the win condition experienced a greater increase in happiness than they had expected.
Predicted impact versus actual impact on happiness. The y-axis indicates magnitude of impact, whether positive or negative (i.e. absolute values). For the lose condition, the scores represent magnitude of negative change. Absolute mean scores are shown to improve clarity for comparing magnitude of impact between win and lose conditions. Greater distance from the x-axis indicates greater impact on affect (i.e. happiness). All groups in the lose condition predicted and experienced a mean decrease in happiness after losing money.

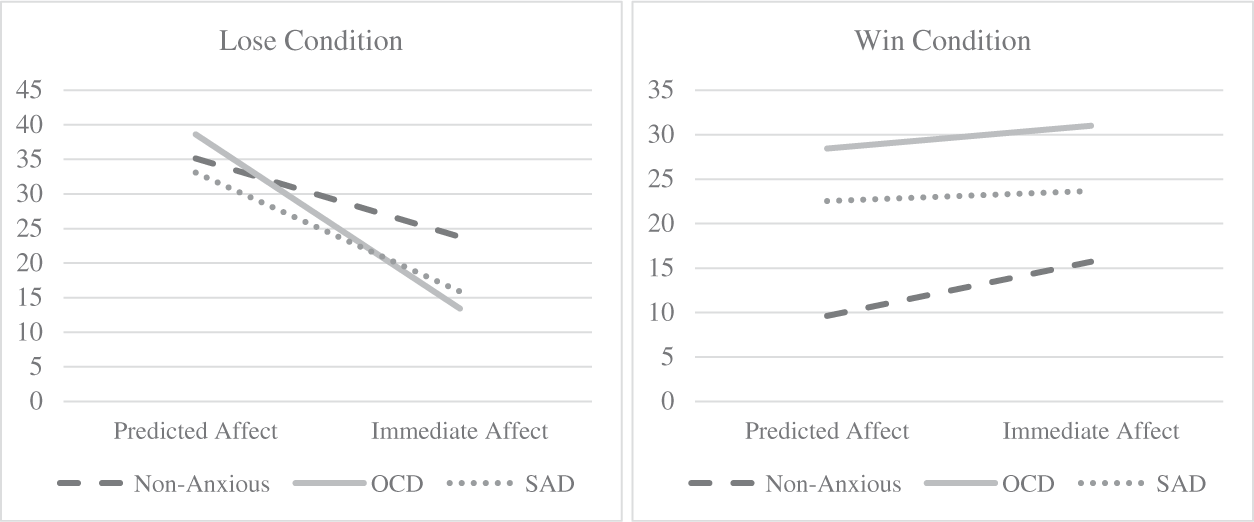
For sadness (see Fig. 2), there was a main effect of group, indicating that non-anxious subjects predicted and experienced a more negative impact on sadness than the OCD and SAD groups [F(2,117) = 8.51, p < .001, r = .36, 90% CI: 0.20, 0.46] overall (i.e. greater increases in sadness after a loss and smaller decreases after a win). There were also two differences trending toward significance. First, a main effect for affect showed that all groups experienced less change in levels of sadness than they predicted [F(1,117) = 3.23, p = .08], indicating that they over-estimated the impact of outcome on their level of sadness. Second, an interaction between affect and outcome indicated that subjects’ predictions were less accurate in the loss condition than in the win condition [F(1,117) = 2.91, p = .09]. That is, people more greatly over-estimated increases in sadness after losing money, whereas their predictions were more accurate regarding the win scenario.
Predicted impact versus actual impact on sadness. The y-axis indicates magnitude of impact, whether positive or negative (i.e. absolute values). For the win condition, the scores represent magnitude of negative change. Absolute mean scores are shown to improve clarity for comparing magnitude of impact between win and lose conditions. Greater distance from the x-axis indicates greater impact on affect (i.e. sadness). All groups in the win condition predicted and experienced a decrease in sadness after winning money.

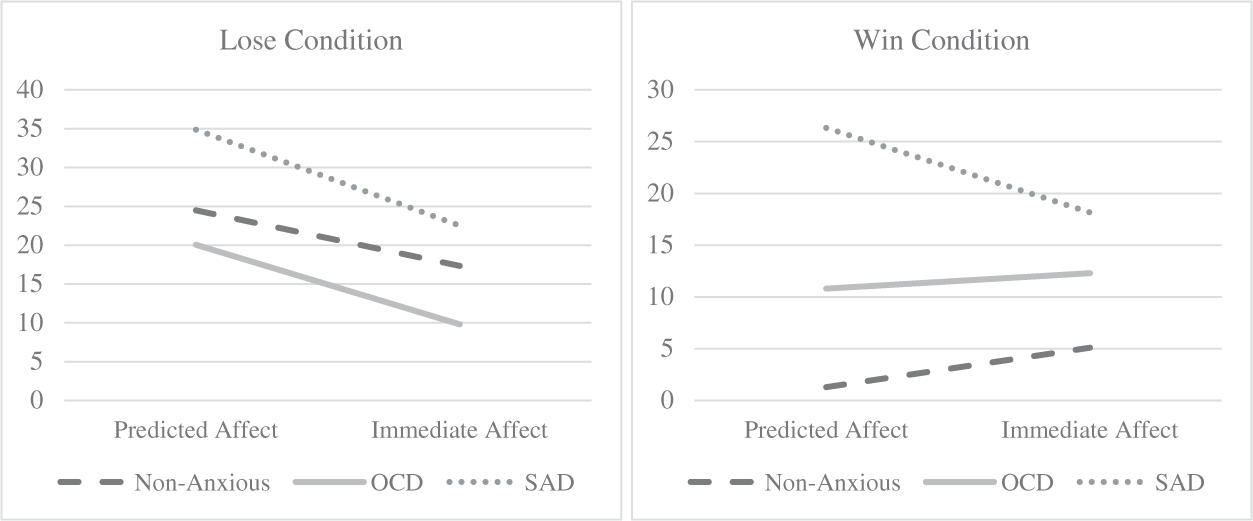
We found a main effect of affect such that all subjects experienced a greater impact on feeling pleased than they predicted (see Fig. 3), regardless of outcome [F(1,117) = 17.73, p < .001, r = .36, 90% CI: 0.22, 0.48]. Specifically, individuals who lost money over-estimated a drop in feeling pleased, whereas people who won money under-estimated an increase in feeling pleased. There was also a significant interaction between affect and outcome [F(1,117) = 8.47, p = .004, r = .26, 90% CI: 0.11, 0.39], such that prediction was less accurate by those who lost money versus those who won it. That is, people in both conditions were more pleased after the coin toss than they had predicted, the group that lost money to a larger degree than the one that won (i.e. the loss group’s pleased ratings decreased less than they had anticipated, whereas people in the win condition were more accurate in predicting how their pleased levels would change). Moreover, there was a main effect of group [F(2,117) = 3.11, p = .05, r = .22, 90% CI: 0.01, 0.34]; pairwise analyses revealed that people with OCD predicted and experienced greater impacts in how pleased they felt overall than the non-anxious group, but this difference did not reach significance after correcting for multiple comparisons (p = .08). Finally, for disappointment, there were significant interactions between affect and outcome [F(1,117) = 3.97, p = .05, r = .18, 90% CI: 0.01, 0.32], such that those who lost money over-estimated their disappointment, but those who won money were more accurate in predicting their level of disappointment (see Fig. 4). There was also a significant interaction between group and outcome [F(2,117) = 4.14, p = .02, r = .26, 90% CI: 0.08, 0.37], such that the non-anxious subjects predicted and experienced less impact on disappointment in the win condition (decreased disappointment) than in the loss condition (increased disappointment). That there were no significant interactions between group and affect for any of the emotions indicates that no group was more or less accurate than the others at predicting the emotional impact of winning or losing money.
Predicted impact versus actual impact on feeling pleased. The y-axis indicates magnitude of impact, whether positive or negative (i.e. absolute values). For the lose condition, the scores represent magnitude of negative change. Absolute mean scores are shown to improve clarity for comparing magnitude of impact between win and lose conditions. Greater distance from the x-axis indicates greater impact on affect (i.e. pleased). All groups in the lose condition predicted and experienced a decrease in feeling pleased after losing money.

Predicted impact versus actual impact on disappointment. The y-axis indicates magnitude of impact, whether positive or negative (i.e. absolute values). For the win condition, the scores represent magnitude of negative change. Absolute mean scores are shown to improve clarity for comparing magnitude of impact between win and lose conditions. Greater distance from the x-axis indicates greater impact on disappointment. All groups in the win condition predicted and experienced a decrease in disappointment after winning money.

Next, we examined the accuracy of the groups’ forecasts of their emotions ten minutes following the coin toss.Footnote 1 A similar pattern of results emerged for all four emotions. The main effect of outcome showed that subjects who won money predicted and experienced greater increases in happiness and pleased ratings and greater decreases in sadness and disappointed ratings than those who lost money (all p ≤ .001). A main effect of affect indicated that ten minutes after the coin toss people had greater increases in happiness and pleased feelings and experienced a greater change in sadness and disappointment than they had predicted (all p < .03), regardless of winning or losing money. Finally, an interaction between affect and outcome revealed that people made bigger errors in forecasting the change in how happy [F(1,112) = 11.44, p = .001, r = .30, 90% CI: 0.16, 0.43] and pleased [F(1,112) = 21.80, p < .001, r = .40, 90% CI: 0.27, 0.51] they would be in response to losing money than to winning money. That is, affective forecasting discrepancy was larger in people who lost money. The pattern of results differed for negative emotions, however. Subjects who lost money experienced a greater decrease in disappointment than they predicted ten minutes following the coin toss, whereas subjects who won money experienced greater increases in sadness and disappointment than they had predicted (p < .001).Footnote 2
Risk assessment
To determine how groups evaluated the risks, benefits and the likelihood that they would engage in a range of different behaviours, we performed separate MANOVAs for each subscale of the DOSPERT. There were no differences in how groups rated the benefits of behaviours in any domain (all p ≥ .11), but a main effect of group revealed that both the socially anxious and OCD groups rated financial behaviours (e.g. investing in a speculative stock) as more risky than the non-anxious group [F(2,120) = 5.00, p = .01, r = .28, 90% CI: 0.11, 0.39]. There was also a trend towards a significant difference such that subjects with SAD rated social behaviours (e.g. admitting that one’s tastes are different from those of a friend) as more risky than the non-anxious group, although this difference failed to reach statistical significance (p = .06). The only group difference that emerged on the likelihood subscale of the DOSPERT revealed that socially anxious subjects stated they were more likely to engage in risky health/safety behaviours (e.g. sunbathing without sunscreen) than the non-anxious group [F(2,120) = 3.77, p = .03, r = .24, 90% CI: 0.06, 0.36]; there were no differences between OCD and either of the other groups on the likelihood subscale (all p ≥ .19).
Finally, we examined the relationship between affective forecasting accuracy and risk assessment, as measured by the DOSPERT. First, we calculated the discrepancy between all subjects’ predicted and actual forecasts, as described above. We then correlated those discrepancy scores with the risk ratings on the DOSPERT. A Pearson correlation showed no significant associations between affective forecasting accuracy and perceived risk on any of the domains (all p ≥ .08), with one exception. Specifically, discrepancies in happiness forecasts were positively correlated with assessment of risk in ethical situations (e.g. taking credit for someone else’s work, having an affair, etc.); r = .28, p = .002. This association suggests that the less accurate people were in predicting how happy they would be after winning or losing money the more risk they assigned to different ethically questionable actions.
Discussion
Our first aim was to evaluate the affective forecasting accuracy of individuals with OCD relative to people without the disorder. Contrary to our hypothesis, we did not find any evidence that people with OCD or SAD differ in their ability to predict their positive or negative emotional response to winning or losing money. Indeed, the only group differences that emerged showed that, relative to the other groups, non-anxious individuals predicted and experienced greater change in levels of sadness after losing and winning money, and they made more accurate forecasts of how disappointed they would be in response to winning money and over-estimated their disappointment to losing it. However, the absence of any group by affect interaction indicates that no group was more or less accurate at predicting its response than the others. These findings suggest that people with OCD and social anxiety do not possess a global deficit in predicting their emotional response to positive or negative events relative to people without these disorders. Our results deviate from those of Wenze et al. (Reference Wenze, Gunthert and German2012), who found that depressive and anxiety symptoms predicted more biased affective forecasts in a non-clinical sample. One potential explanation for this difference is that their study asked subjects to predict their mood in general over the course of a week, whereas our study focused on the response directly and ten minutes following a specific event. Thus, it is feasible that people with anxiety and depressive disorders over-estimate their negative affect in general, but that their predictions about their reactions to specific events are as accurate as non-affected people’s. It is also possible that obsessive compulsive subjects would show a bias in predicting their response to feared outcomes directly relevant to their specific OCD symptoms (although certain outcomes, such as intentionally making a person sick, may be more difficult to test in a laboratory setting). Although we did not test this possibility, our findings indicate that any deficiency that people with OCD may have in this domain does not generalize broadly to diverse situations.
All groups demonstrated a tendency to over-estimate both the increase in negative emotions and the decrease in positive emotions after losing money. Moreover, with respect to both disappointment and pleasure, the discrepancy between people’s forecast and actual emotional impact was larger for those who lost money than for those who won it. Subjects in the win condition also experienced more positive emotions than they predicted, but were more accurate than those in the loss condition. These finding are consistent with Kermer et al. (Reference Kermer, Driver-Linn, Wilson and Gilbert2006), who observed that people over-estimated the emotional impact of losing money, but provided more accurate estimates of their response to winning money following the same gambling task. These results indicate that people are especially biased when anticipating negative outcomes. Analyses on sustained emotional response ten minutes following the coin toss were consistent with this pattern. In addition, people who won money were more likely to over-estimate the impact of winning money on their mood after ten minutes, such that they were more disappointed than they expected ten minutes after the coin toss.
The finding that individuals have difficulty accurately predicting both their immediate and continued response to different outcomes (especially negative ones) has interesting implications for treatment of OCD. Prior research suggests that expectations of a situation can influence subsequent affective experience of the same situation (Wilson et al., Reference Wilson, Lisle, Kraft and Wetzel1989; Wilson and Gilbert, Reference Wilson and Gilbert2003). If the experience does not differ significantly from expectations, then the individual’s forecast will be strengthened (e.g. one who expects to like a book and actually enjoys it will rate the book more favourably than those without any prior expectations of it). Conversely, a contrast effect will occur if a person’s expectations and experience are highly discordant and the person recognizes this discrepancy (Geers and Lassiter, Reference Geers and Lassiter1999; Wilson et al., Reference Wilson, Lisle, Kraft and Wetzel1989; Wilson and Gilbert, Reference Wilson and Gilbert2003).
In exposure and response prevention (ERP) therapy, the gold standard treatment for OCD (Franklin and Foa, Reference Franklin, Foa, Nathan and Gorman2002; Jenike, Reference Jenike2004), patients are exposed to situations/stimuli they fear and refrain from engaging in the rituals they would usually perform to offset their anxiety. With repeated exposures to the same situation, individuals commonly experience a decrease in anxiety (Jenike, Reference Jenike2004). In order to measure changes in anxiety over the course of an exposure, treaters often ask patients to report their subjective units of distress (SUDs) before, during, and after a session ERP (Foa and Goldstein, Reference Foa and Goldstein1978). Given the literature on affective forecasting and contrast effects, it is possible that when individuals experience lower SUDs during an exposure than they had anticipated, they will become more quickly habituated to the situation and, subsequently, may make more rapid treatment gains than those with more accurate predictions. Indeed, Rescorla and Wagner’s (Reference Rescorla and Wagner1972) model of classical conditioning asserts that individuals learn faster when their expectations are highly discrepant from their experience. Therefore, patients may show faster improvement in OCD symptoms when they over-estimate their SUDs during and following an exposure. This idea is also in line with other theories regarding the mechanisms of ERP, such as inhibitory learning. This theory purports that fear structures are not abolished during ERP, but rather new associations between the feared stimulus and its meaning are formed. In an effort to enhance the effects of ERP, Craske and colleagues proposed that devising ways to increase the extent to which people’s expectations are violated during ERP will strengthen inhibitory learning and are more predictive of treatment gains than a reduction in anxiety (Craske et al., Reference Craske, Kircanski, Zelikowsky, Mystkowski, Chowdhury and Baker2008, Reference Craske, Treanor, Conway, Zbozinek and Vervliet2014). Moreover, the trend in our results suggesting that OCD subjects predicted and experienced more positive impacts on how pleased they felt after a win on the gambling task offers further evidence that designing exposures that are more likely to result in success for patients could more strongly impact their pleasure and, therefore, their motivation to continue treatment.
A second aim of our study was to examine if affective forecasting accuracy was related to perceived risk associated with various activities. Results revealed this was only the case within one domain of behaviour. Specifically, poorer happiness forecasting was correlated with greater risk assessment regarding ethical situations. One explanation for this unique relationship is that behaviours indicated in the ethical subscale of the DOSPERT are more diverse than those in the other domains. Whereas items in the other domains all pertain to specific outcomes that affect oneself (i.e. investing one’s own money, putting oneself at physical or social risk), those in the ethical category include a range of behaviours, several having possible negative consequences for other people (e.g. taking credit for others’ work, etc.). It is therefore possible that people evaluate risk differently when it pertains to themselves versus others. Finally, the lack of group differences between the OCD and other groups in how likely they were to engage in the behaviours in different domains is consistent with a previous study that similarly found no global risk-avoidance behaviour (Lorian and Grisham, Reference Lorian and Grisham2011). Indeed, the authors asserted that a confluence of factors is likely to influence decisions about risk-taking behaviours.
Our study has limitations, including a sample with a number of subjects with comorbid OCD and social anxiety disorder. Although the presence of comorbid anxiety disorders is common in those with OCD, indicating that our OCD sample is representative of the population, the high comorbidity may render it difficult to detect differences between the OCD and SAD groups. However, our results remained consistent even after we moved subjects with comorbid OCD and SAD from the OCD group to a fourth separate group. Second, a number of our OCD subjects were in treatment when they participated in the current study. Therefore, it is possible that they exhibited less biased affective forecasting relative to non-treatment-seeking individuals as a result of engaging in exposure with response prevention. However, a number of these patients had only just started treatment and still demonstrated moderately severe OCD symptoms, biased thinking (as measured by the OBQ-44), and observable rituals. Therefore, it seems unlikely that this factor accounts for the lack of differences between our groups. Finally, we used a gambling task in which a small amount of money was at stake. Although this task has been used in previous research on affective forecasting, it would be interesting to test forecasting accuracy using a task with higher stakes.
In conclusion, we found no evidence for deficient generalized affective forecasting ability in people with OCD. Rather, these individuals demonstrated the same pattern of biased forecasting that has been identified in other studies on unselected subjects. In addition, we found little evidence that affective forecasting accuracy is related to risk assessment. The results of our study suggest that affective forecasting is unlikely to contribute to the phenomenology of OCD or social anxiety disorder.
Acknowledgements
The authors thank the staff of the OCD Center at Rogers Memorial Hospital for their assistance and accommodation, and the patients for their time and participation.
Financial support
This research was supported by grants from the Harvard Department of Psychology’s Gordon Allport Fund and the Sackler Scholar Programme in Psychobiology awarded to the first author.
Conflicts of interest
Dianne Hezel, S. Evelyn Stewart, Bradley Riemann and Richard McNally have no conflicts of interest with respect to this publication.
Ethical statement
The authors have abided by the Ethical Principles of Psychologists and Code of Conduct as set out by the APA. We obtained ethical approval from the Harvard University Institutional Review Board (protocol no. IRB14-3683).



Comments
No Comments have been published for this article.