Phenolic compounds are a large and complex group of naturally occurring plant compounds with multiple phenolic structures, widely found in plant and plant-based foods and beverages, including fruits, vegetables, cereals, legumes, nuts, cocoa, wine, coffee and tea. Chemically, phenolic compounds encompass over 8000 known molecules, which can be grouped into four main classes, namely phenolic acids, flavonoids, stilbenes and lignans. Each of these classes has distinct chemical properties and can occur as glycosides, esters, polymers or in free form (aglycone), with structures ranging from low to highly polymerised forms(Reference Rudrapal, Khairnar and Khan1,Reference Manach, Scalbert and Morand2) .
The bioavailability and bioactivity of phenolic compounds depend on their glycosylation pattern, hydroxylation, acylation, esterification and degree of polymerisation(Reference Manach, Scalbert and Morand2). Despite these complexities, epidemiologic studies indicated that phenolic compounds intake is associated with beneficial health outcomes and the reduced risk of diseases. Meta-analysis of prospective cohort studies have suggested an inverse association between phenolic compounds intake and the risk of CVD(Reference Li, Zhao and Yuan3), type 2 diabetes(Reference Li, Zhao and Yuan3,Reference Rienks, Barbaresko and Oluwagbemigun4) and some types of cancer(Reference Rostampour, Alipour and Mirjalili5,Reference Liang, Yuan and Quan6) . Since chronic low-grade inflammation plays a role in the development of these diseases, the anti-inflammatory properties of phenolic compounds are frequently highlighted as a key mechanism underlying their health-promoting effects(Reference Manach, Scalbert and Morand2).
Results from the Brazilian Longitudinal Study of Adult Health (ELSA-Brasil), comprising 15 105 middle-aged and older adults, showed that chronic low-grade inflammation is associated with lower markers of lipid disorders(Reference Cesena, Generoso and Santos7), dysglycemia(Reference Almeida-Pititto, Ribeiro-Filho and Lotufo8), atherosclerosis(Reference Filho, Generoso and Cardoso9–Reference Kianoush, Yakoob and Al-Rifai12), renal(Reference Titan, Pecoits-Filho and Barreto13) and thyroid(Reference Galvao, Bensenor and Blaha14) disfunctions, reduced cognitive decline(Reference Brunoni, Salum and Hoffmann15) and depression(Reference Dryer-Beers, Griffin and Matthews16). These findings underscore the central role of inflammation in the pathogenesis of chronic diseases. In this context, the anti-inflammatory properties of phenolic compounds are particularly relevant, offering potential mechanisms to mitigate inflammation and its related health outcomes(Reference Manach, Scalbert and Morand2).
Although research remains limited, phenolic compounds intake has shown inverse associations with inflammatory markers: studies indicate that higher phenolic compounds intake is associated with reduced levels of C-reactive protein (CRP), fibrinogen and leptin(Reference Dryer-Beers, Griffin and Matthews16–Reference Shiraseb, Hosseininasab and Noori18). However, few studies have examined the associations between multiple inflammatory markers and dietary intake of specific phenolic classes and subclasses. Evidence from the HELENA Study, which evaluated 526 European adolescents, showed that higher total polyphenol intake was inversely associated with a pro-/anti-inflammatory biomarker ratio, and specific phenolic classes were linked to individual inflammatory biomarkers, such as IL 1, 2 and 10 and interferon-γ(IFN-γ)(Reference Wisnuwardani, De Henauw and Ferrari19). These findings, although in a younger population, support the potential anti-inflammatory effects of polyphenols and highlight the relevance of examining multiple markers and phenolic subclasses. Therefore, this study aimed to investigate the cross-sectional associations between phenolic compounds intake (total intake, classes and subclasses) and the odds of having high levels of ten inflammatory markers in participants of the ELSA-Brasil.
Methods
Participants
This is a cross-sectional study that was developed based on baseline data from the Brazilian Longitudinal Study of Adult Health (ELSA-Brasil), as all analyses of interest were exclusively conducted using data collected during the baseline phase. The ELSA-Brasil is a longitudinal multicentric cohort study of civil servants conducted in six Brazilian cities (Belo Horizonte, Porto Alegre, Rio de Janeiro, Salvador, Sao Paulo and Vitoria). The objective of the ELSA-Brasil is to investigate the incidence and risk factors associated with chronic diseases, particularly CVD and diabetes, in addition to understanding the social, environmental and biological determinants of these diseases over time. Participants were civil servants aged 35–74 years recruited in two phases, involving eligibility confirmation, informed consent, interviews and clinical examinations, with exclusions applied for pregnancy, severe cognitive impairment, intention to leave the institution or residence outside the study region. Details of the ELSA-Brasil have been described elsewhere(Reference Aquino, Barreto and Bensenor20–Reference Schmidt, Duncan and Mill22).
A total of 15 105 subjects aged between 35 and 74 years completed the in-person baseline survey between 2008 and 2010. The cohort included individuals both with and without chronic diseases such as diabetes, CVD and cancer, reflecting the heterogeneous health profile of the ELSA-Brasil population and preserving its representativeness. High-sensitivity C-reactive protein (hs-CRP) levels were measured in all participants. Glycoprotein acetylation (GlycA) concentrations were assessed in a subsample from the São Paulo Research Center (n 5061). From this group, a random sample of 1000 participants without diabetes or CVD, aged 35–54 years, was selected for analysis of E-selectin, transforming growth factor β1 (TGF-β1), TNF-α, monocyte chemoattractant protein-1 (MCP-1), IL-6, IL-10, fibrinogen and leptin levels. The final analytical sample included 661 individuals from the São Paulo Research Center who had complete data on inflammatory markers and dietary intake. The overall sample sizes used for each marker are summarised in Figure 1. The ELSA-Brasil protocol was approved by the National Research Ethics Committee (CONEP) with protocol number CAAE 0016.1.198.000-06. All individuals volunteered to participate in the study and signed a written informed consent form. The study was designed and conducted in accordance with the STROBE-nut reporting guidelines(Reference Lachat, Hawwash and Ocké23).
Strobe flow chart of participants available for analysis in the Brazilian Longitudinal Study of Adult Health. ELSA-Brasil, Brazilian Longitudinal Study of Adult Health; GlycA, glycoprotein acetylation; hs-CRP, high-sensitivity C-reactive protein.

Inflammatory markers assessment
Blood serum samples were collected at baseline after an overnight fast at research centres located in university-affiliated hospitals participating in the ELSA-Brasil study and used to analyse inflammatory biomarkers. The hs-CRP was collected from the totality of participants included in baseline (n 15 105) and assayed with immunochemistry (nephelometry) using BN II (Siemens). GlycA was quantified by NMR spectroscopy (Nuclear Magnetic Resonance LipoProfile 4 Test Spectra, LabCorp), and its signal was deconvoluted, amplified and converted to µmol/l by LipoScience (now LabCorp). GlycA has low biologic, intra-assay and interassay variability of 4·3 % and 1·9 %, respectively.
ELISA kits were also used for the determination of leptin (Enzo Life Sciences), E-selectin and TGF-β1 (Abnova Corp) and fibrinogen (Affinity Biologicals Inc.). IL-6, IL-10, TNF-α and MCP-1 were determined using the Bio-Plex® Pro Human Cytokine 4-plex assay panel (Biorad). All assays were conducted according to the manufacturer’s protocols, including calibration curves and internal quality controls. Intra-assay coefficients of variation ranged from 1·8 to 7·2, except for those of TGF-β1, which reached 10 %. Inter-assay coefficients varied from 0·9 to 9·1 except for TGF-β1 (12·7 %) and E-selectin (14·4 %). These values are within the expected range for inflammatory biomarkers, ensuring reproducibility and reliability of the measurements.
The hs-CRP concentrations > 3 mg/l were categorised as elevated, following the recommendations proposed by the Centers for Disease Control and Prevention (CDC) and the American Heart Association (AHA)(Reference Pearson, Mensah and Alexander24). Participants with hs-CRP > 10 mg/l were excluded in a sensitivity analysis to account for acute inflammation. Since the results remained unchanged (online Supplementary Table 1), analyses were presented using the full sample to preserve statistical power and generalisability. No additional exclusions were applied for other inflammatory biomarkers, as these may reflect chronic low-grade inflammation related to metabolic and lifestyle factors, which were central to our research objectives. The remaining inflammatory markers were categorised into tertiles, and for subsequent analyses, tertiles 1 and 2 were combined to represent lower levels, whereas tertile 3 represented higher levels of each biomarker.
Dietary phenolic compounds intake
Trained personnel carried out in-person interviews using a validated, semiquantitative 114-item FFQ to collect information about dietary habits over the preceding 12 months(Reference Molina, Benseñor and Cardoso25). The procedures used to align food items listed in the FFQ with those in the phenolic compounds composition database were based on previously established protocols(Reference Carnauba, Hassimotto and Lajolo26,Reference Carnauba, Sarti and Hassimotto27) . The Phenol-Explorer database (www.phenol-explorer.eu/) version 3.6 was used to identify the phenolic compounds contents in foods, providing information on 501 distinct phenolic compounds across more than 450 foods. The phenolic compounds values in Phenol-Explorer were derived using various analytical techniques. The majority of phenolic compounds in the dataset were quantified using reverse-phase HPLC, while proanthocyanidins were analysed using normal-phase HPLC. For phenolic compounds that require more intensive extraction processes (e.g. lignans in all foods, ellagic acid in walnuts and hydroxycinnamic acids in cereals, legumes and olives), data from HPLC following basic or acidic hydrolysis were utilised(Reference Neveu, Perez-Jiménez and Vos28).
For regional foods and beverages (e.g. açaí and yerba mate tea) and other highly prevalent items in the Brazilian diet (e.g. rice, beans and orange), we relied on data obtained from foods collected and analysed in Brazil using HPLC(Reference Coelho, Bistriche and Grande29). Additionally, we utilised the Brazilian Food Composition Database (TBCA, accessible at www.tbca.net.br/), a database developed by the University of Sao Paulo, which provides information on flavonoid content in regional and commonly consumed foods in Brazil, also analysed via HPLC.
The influence of different cooking and processing methods on phenolic compounds content was considered to ensure accurate estimations of phenolic compounds intake. Retention factors from the Phenol-Explorer database were applied, allowing adjustments for changes in phenolic compounds content due to weight loss or water gain during cooking and processing(Reference Rothwell, Perez-Jimenez and Neveu30).
Phenolic compounds intake (total, classes and subclasses) was estimated based on the phenolic content of individual ingredients within a recipe. For recipes containing phenolic-rich ingredients, the phenolic content was determined using the composition data of each ingredient. The FFQ did not provide specific information on herbs, spices and oils; however, to minimise this potential bias, commonly used seasonings in Brazilian dietary habits were considered (e.g. onion and garlic). Additionally, when food items in the dietary records could correspond to multiple options in the Phenol-Explorer database (e.g. olive oil could be extra virgin, virgin or refined; white rice could be parboiled or refined), the phenolic content was assigned according to typical Brazilian consumption patterns (extra virgin olive oil and refined rice). Coffee, an important source of phenolic compounds, was considered as filtered.
As food composition data is expressed in milligrams per 100 g, the intake of phenolic compounds from each food item was calculated by multiplying the phenolic compounds content by the daily consumption amount of the food and dividing the result by 100. The intake of phenolic compounds was calculated by summing the amounts from all consumed food sources and was classified as total phenolics, its main classes (phenolic acids, flavonoids, stilbenes, lignans and other phenolics) and subclasses (hydroxybenzoic acids and hydroxycinnamic acids for phenolic acids; flavan3ols, flavones, flavonols, flavanones and anthocyanins for flavonoids). The intake of some phenolic acids (e.g. hydroxyphenylacetic and hydroxyphenylpropanoic acids) and flavonoid classes (chalcones, dihydroflavonols and isoflavones) was zero, and therefore they do not appear in the analysis. Other phenolics were calculated as the sum of alkylphenols, alkylmethoxyphenols, methoxyphenols, furanocoumarins, hydroxybenzaldehydes, hydroxycoumarins, tyrosols, catechol, phenol, pyrogallol and arbutin.
Statistical analysis
Variable distributions were assessed using the Kolmogorov–Smirnov test. Baseline characteristics are presented as means and standard deviations for normally distributed continuous variables or as medians and 25th–75th percentiles for non-normally distributed variables, and as frequencies for categorical variables, across tertiles of total phenolic compound intake. Differences across tertiles were evaluated using ANOVA or the Kruskal–Wallis test for continuous variables and the χ 2 test for categorical variables. The main food contributors to the intake of phenolic compounds were determined by percentage of contribution.
To minimise the effect of energy dilution, phenolic compound intakes were adjusted for total energy intake using the residual method described by Willett and colleagues(Reference Willett, Howe and Kushi31). Briefly, each participant’s phenolic intake was regressed on total energy intake, and the residuals from this model (representing the variation in phenolic intake independent of energy) were used in subsequent analyses. This method allows comparisons of nutrient intakes across individuals that are unconfounded by total energy consumption, which is particularly relevant since major sources of phenolics (e.g. tea and coffee) contribute little to total energy but substantially to phenolic intake.
A logistic regression analysis was conducted to evaluate the association between total, classes and subclasses of phenolic compounds intake (independent variable) and various inflammatory markers (dependent variables), with T1 as the reference group. OR and 95 % CI were calculated to assess the association between phenolic compounds intake categories and each inflammatory marker. To correct for multiple testing across fourteen independent predictors, Bonferroni correction was applied, yielding an adjusted significance threshold of P < 0·0036 (0·05/14). The covariates included in the multivariable models were selected based on previous literature identifying potential confounders of the association between phenolic compounds and inflammatory markers. The logistic regression analysis for all inflammatory markers was adjusted for sex (categorical), age (continuous), BMI (continuous), per capita income (continuous), physical activity (weighted sum of weekly physical activity time in minutes, continuous), smoking status (never, former and current smoker, categorical) and intake of total fibre (continuous) and saturated fat (continuous). All analyses were performed using Stata version 14.
Results
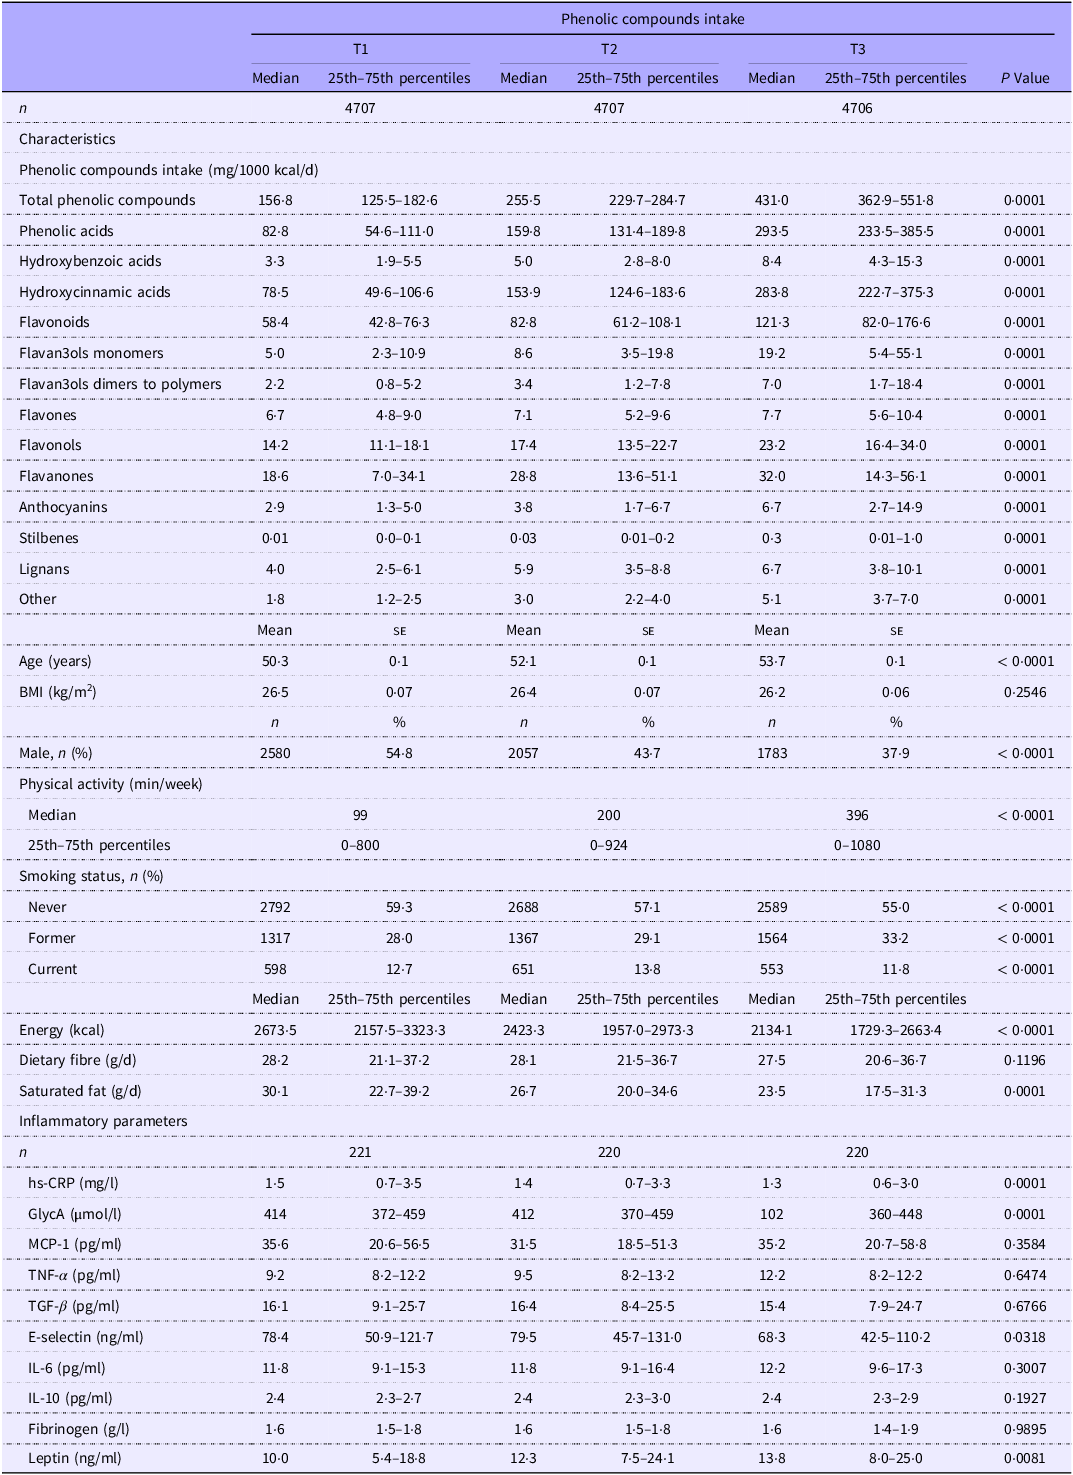
The mean age of participants with available hs-CRP and GlycA data was 52·1 years. Among participants with data available for other inflammatory markers (exclusively from the São Paulo Research Center), the mean age was slightly lower, at 45·6 years. The highest tertile of phenolic compounds intake included older participants, individuals with higher physical activity levels and a higher proportion of women compared with the lowest tertile. Additionally, those consuming more phenolic compounds tended to have a lower energy intake (Table 1).
Baseline characteristics and intake of phenolic compound classes and subclasses according to energy-adjusted tertiles of phenolic compounds intake in the ELSA-Brasil study

Table 1 Long description
A table comparing phenolic compounds intake and baseline characteristics across tertiles in a study. The table has 4707 rows and 28 columns. Column headers include Phenolic compounds intake, T1 Median, T1 25th-75th percentiles, T2 Median, T2 25th-75th percentiles, T3 Median, T3 25th-75th percentiles, and P Value. Row labels include Characteristics, Phenolic compounds intake (mg/1000 kcal/d), Total phenolic compounds, Phenolic acids, Hydroxybenzoic acids, Hydroxycinnamic acids, Flavonoids, Flavan3ols monomers, Flavan3ols dimers to polymers, Flavones, Flavonols, Flavanones, Anthocyanins, Stilbenes, Lignans, Other, Age (years), BMI (kg/m^2), Male (n %), Physical activity (min/week), Smoking status (n %), Energy (kcal), Dietary fibre (g/d), Saturated fat (g/d), Inflammatory parameters, hs-CRP (mg/l), GlycA (μmol/l), MCP-1 (pg/ml), TNF-α (pg/ml), TGF-β (pg/ml), E-selectin (ng/ml), IL-6 (pg/ml), IL-10 (pg/ml), Fibrinogen (g/l), Leptin (ng/ml). The table presents median and percentile values for phenolic compounds intake, demographic characteristics, physical activity, smoking status, energy intake, dietary fiber, saturated fat, and inflammatory parameters across three tertiles (T1, T2, T3). Notable trends include increasing phenolic compounds intake from T1 to T3, variations in demographic characteristics, physical activity levels, smoking status, and differences in inflammatory parameters across the tertiles.
ELSA-Brasil, Brazilian Longitudinal Study of Adult Health; hs-CRP, high-sensitivity C-reactive protein; GlycA, glycoprotein acetylation; MCP-1, monocyte chemoattractant protein-1; TGF-β1, transforming growth factor beta 1.
Data are expressed as mean and standard error, and median (25th–75th percentiles).
Data were analysed by using ANOVA, Kruskall–Wallis and χ 2 tests for continuous and categorical variables, respectively.
The median and 25–75th percentiles of phenolic compounds intake for the whole population were 630·4 and 445·9–906·3 mg/d, respectively. After energy adjustment, the median and 25–75th percentiles of phenolic compounds intake were 251·1 and 179·2–356·6 mg/1000 kcal/d, respectively. The most consumed phenolic class was phenolic acids, followed by flavonoids and lignans (Table 1). The main dietary sources for total phenolic compounds intake were coffee (39·7 %), red wine (12·1 %) and yerba mate tea (10·3 %). Coffee was the food item that contributed the most to the intake of phenolic acids (62·2 %), mainly for hydroxycinnamic acids (64·7 %), and was also the main contributor to other phenolics (predominantly alkyl methoxyphenols, alkylphenols and methoxyphenols) intake. The main contributors to flavonoid intake were red wine (24·9 %), particularly for flavan3ols (monomers: 72·3 %, dimers to polymers: 56 %), and anthocyanins (40·7 %). Orange juice and orange were the second and third contributors to total flavonoid intake. Lignans were obtained from orange juice, orange and whole grain bread, and stilbenes were supplied by red wine, grape and strawberry (Figure 2).
Main food contributors to phenolic compounds intake.

Figure 2 Long description
A bar graph compares the contribution of various foods to the intake of different phenolic compounds. The horizontal axis lists the types of phenolic compounds, including total polyphenols, phenolic acids, hydroxybenzoic acids, hydroxycinnamic acids, flavonoids, flavanols, flavanols monomers, flavanols dimers to polymers, flavanones, anthocyanins, lignans, stilbenes, and other. The vertical axis represents the percentage contribution, ranging from 0 percent to 100 percent. The graph includes multiple vertical bars for each phenolic compound type, each bar representing a different food source. The color scheme includes various colors to differentiate between food sources such as coffee, orange juice, whole grain bread, tomato, yerba mate tea, orange, chicory, lettuce, red wine, onion, apple, black bean, strawberry, refined wheat flour bread, chocolate, and chocolate powder. Key trends show that red wine has the highest contribution to stilbenes at 94.4 percent, while chocolate powder significantly contributes to flavanols monomers at 72.3 percent. Other notable contributions include whole grain bread to hydroxycinnamic acids at 64.7 percent and chocolate to flavanols dimers to polymers at 51.3 percent. The graph provides a detailed comparison of how different foods contribute to the intake of various phenolic compounds, highlighting the diversity and complexity of these compounds in our diet.
High-sensitivity C-reactive protein
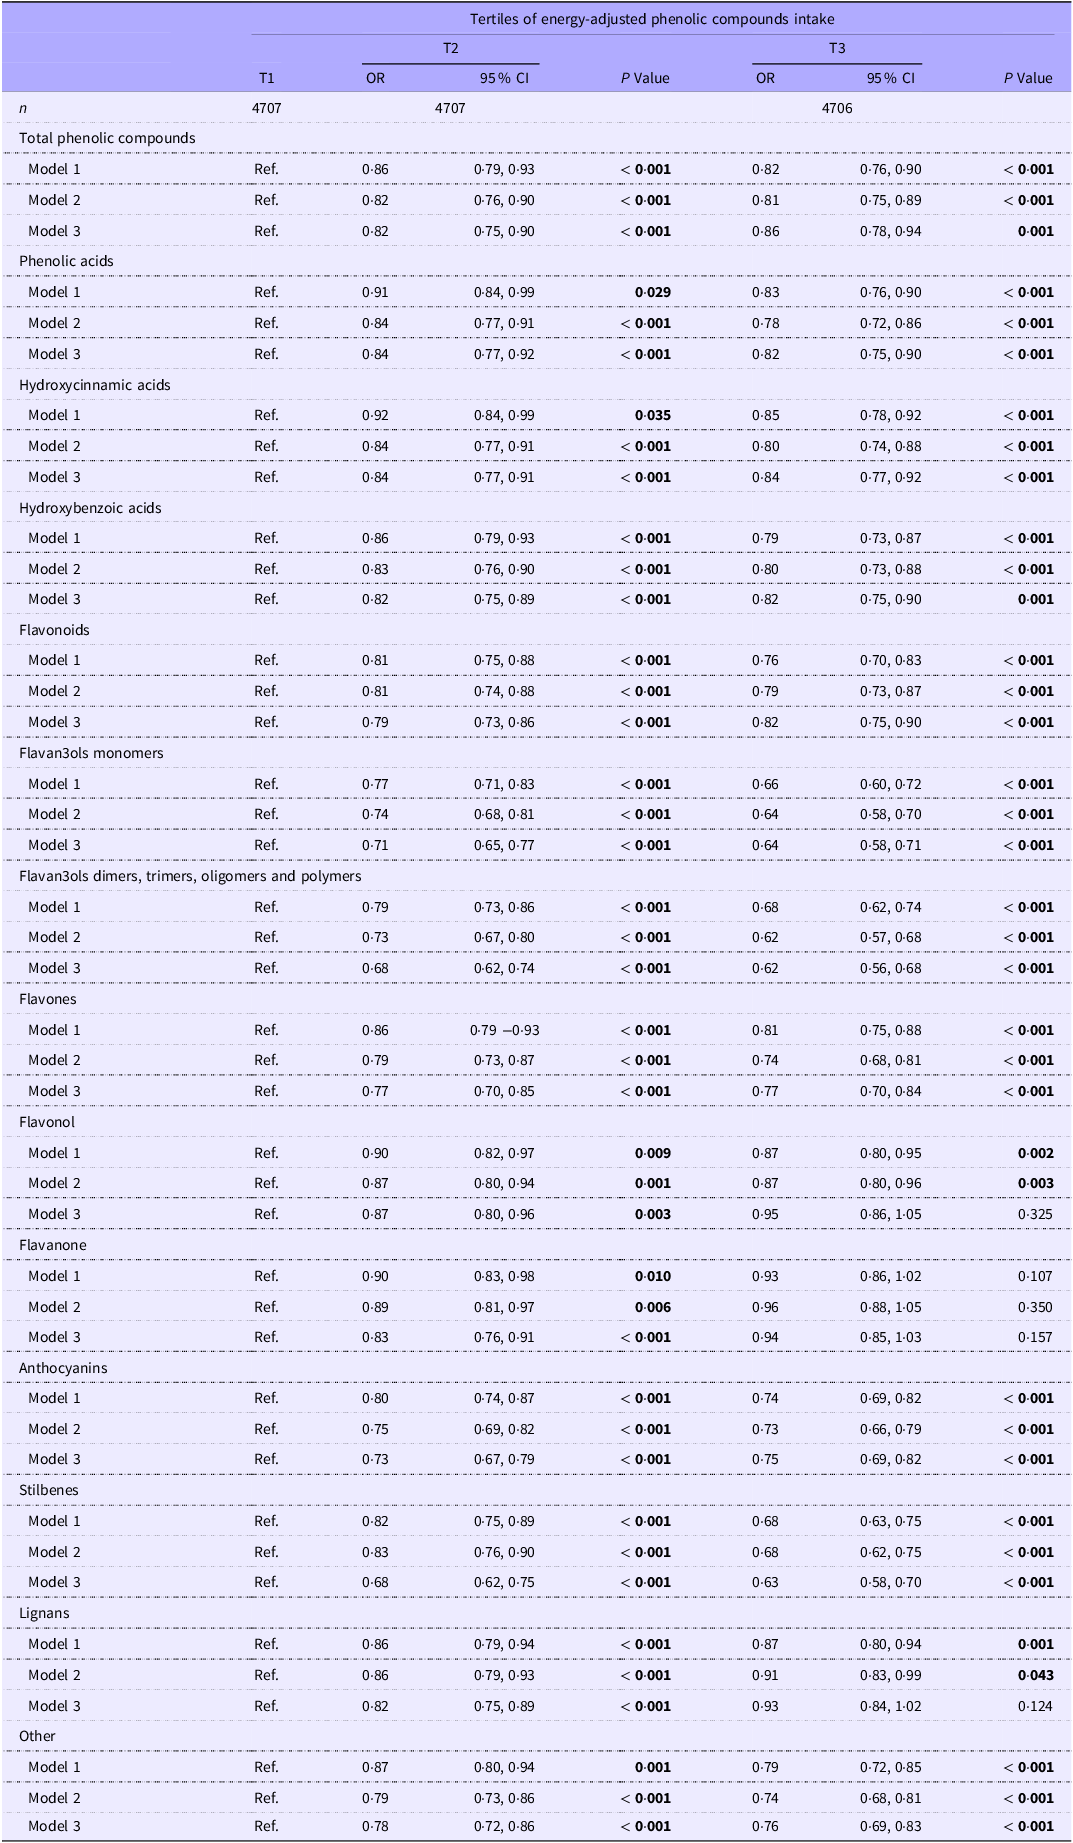
Multivariable logistic regression revealed that the third tertile (T3) of intake of total phenolic compounds, classes (except for lignans) and subclasses (except for flavonols and flavanones) were associated with lower odds of altered hs-CRP levels (P < 0·001, Table 2). The comparison between the highest and the lowest intakes of total phenolic compounds, phenolic acids and flavonoids showed 14 %, 18 % and 18 % lower odds of having elevated hs-CRP levels (total phenolics: T3 v. T1, OR 0·86 (0·78, 0·94); phenolic acids: T3 v. T1, OR 0·82 (0·75, 0·90); and flavonoids: T3 v. T1, OR 0·82 (0·75, 0·90), P < 0·001). Among the flavonoid subclasses, flavan3ols intake was associated with the lower odds of altered hs-CRP (monomers: T3 v. T1, OR 0·64 (0·58, 0·71); dimers, trimers, oligomers and polymers: T3 v. T1, OR 0·62 (0·59, 0·68), P < 0·001). Stilbenes and other phenolic compounds intake were also inversely associated with altered hs-CRP levels (P < 0·001).
OR and 95 % CI for elevated hs-CRP according to tertiles of energy-adjusted phenolic compound intake

Table 2 Long description
A table with 4707 participants per tertile, comparing odds ratios (OR) and 95 percent confidence intervals (CI) for elevated hs-CRP across tertiles of energy-adjusted phenolic compound intake. The table is divided into several rows and columns, with columns labeled T1, T2, and T3, each containing OR, 95 percent CI, and P Value. Rows are categorized by total phenolic compounds, phenolic acids, hydroxyninnamic acids, hydroxybenzoic acids, flavanols, flavanols monomers, flavanols dimers, trimers, oligomers and polymers, flavanones, flavonols, flavonol, flavanones, flavanones, anthocyanins, stilbenes, lignans, and other. Each category is further divided into three models. Notable trends include lower odds ratios for higher tertiles of intake for most categories, with significant P values indicating strong associations. For example, total phenolic compounds in T3 show an OR of 0.86 with a 95 percent CI of 0.78 to 0.94 and a P value of less than 0.0001. Similar patterns are observed for phenolic acids and flavonoids, with significant reductions in odds ratios for higher intake tertiles.
hs-CRP, high-sensitivity C-reactive protein.
Model 1 is adjusted for age, sex and per capita income; model 2 is adjusted for model 1, as well as for BMI, physical activity, smoking and non-red wine alcohol intake; model 3 is adjusted as for model 2, as well for intake of SFA and fibre. Energy-adjusted intakes of phenolic compounds were calculated using Willett’s residual method.
Elevated hs-CRP levels were defined as values > 3 mg/l.
Glycoprotein acetylation
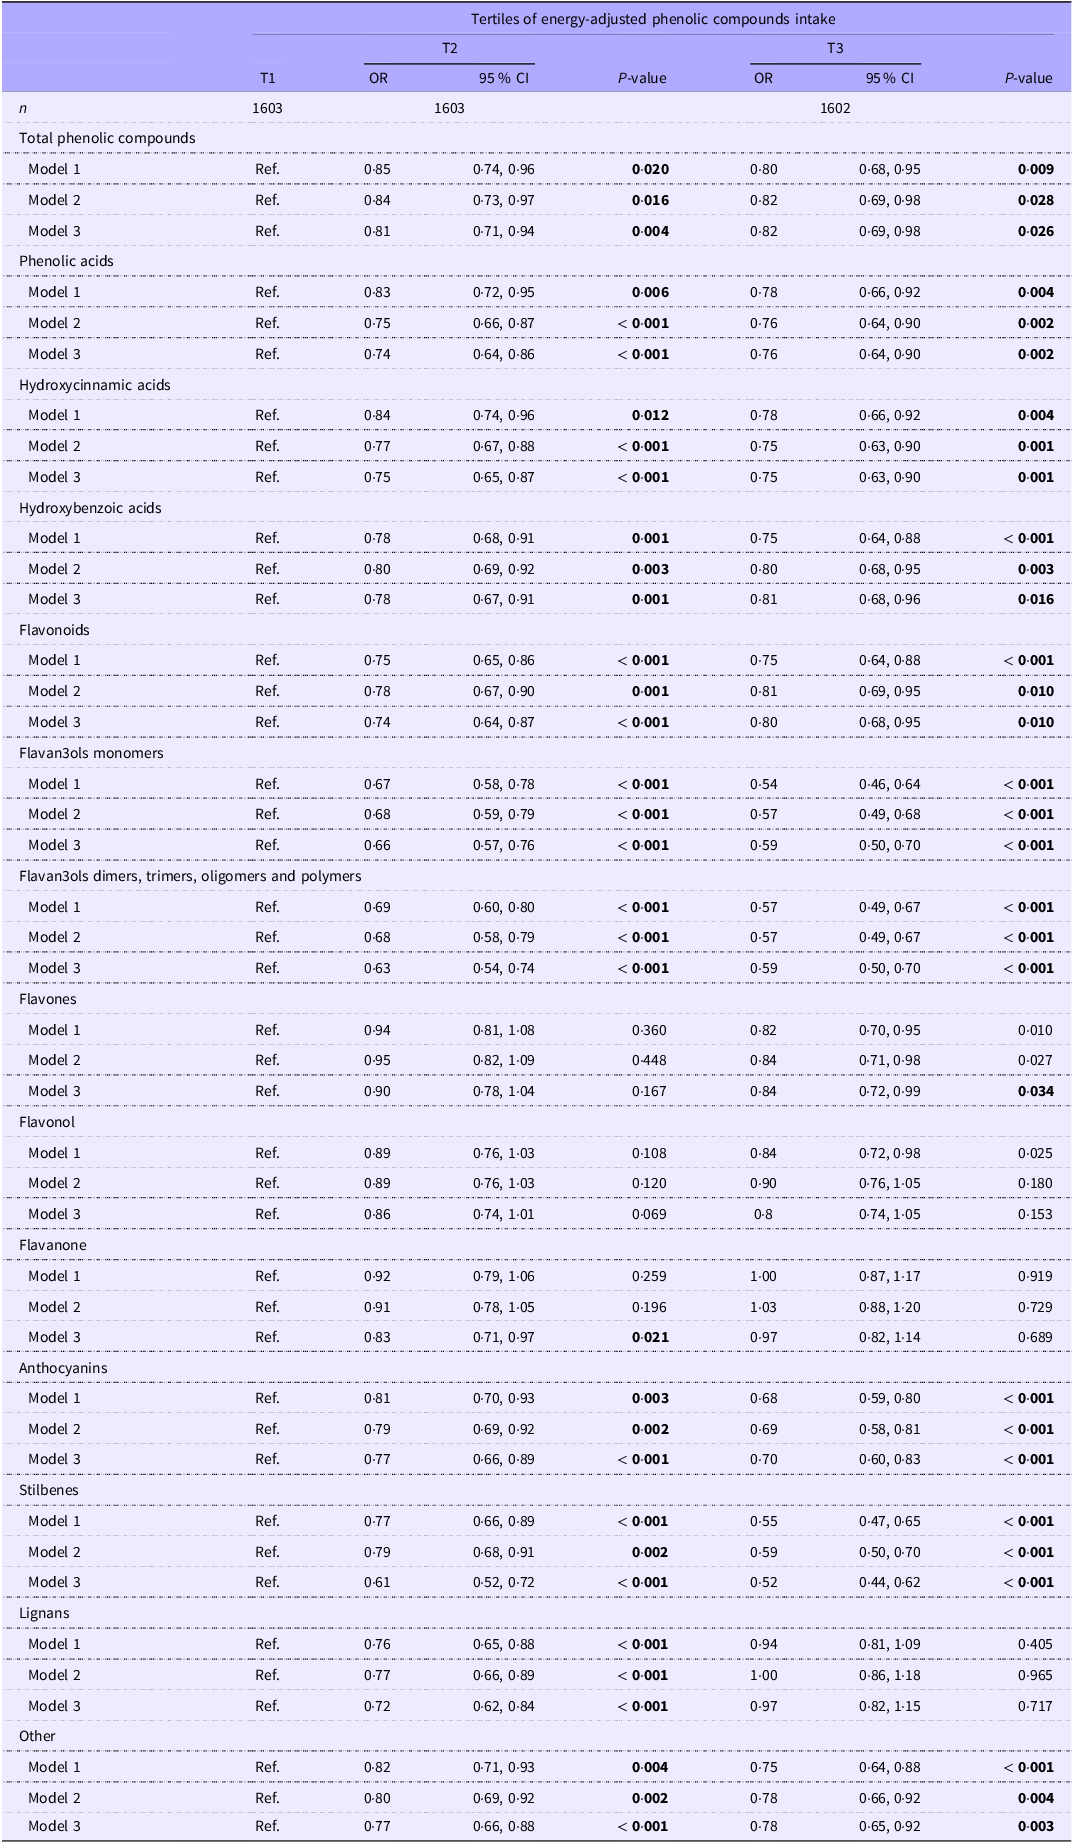
The associations between tertiles of total phenolic compounds intake, as well as classes and subclasses, with elevated GlycA levels are shown in Table 3. We found that the T3 of intake of total phenolic compounds, phenolic acids, flavonoids, stilbenes and other phenolics were associated with 18–48 % lower odds of having elevated GlycA levels (total phenolics: T3 v. T1, OR 0·82 (0·69, 0·98); phenolic acids: T3 v. T1, OR 0·76 (0·64, 0·90); flavonoids: T3 v. T1 OR 0·80 (0·68, 0·95); stilbenes: T3 v. T1, OR 0·52 (0·44, 0·62); other: T3 v. T1, OR 0·78 (0·65, 0·92), all P ≤ 0·026). Flavan-3-ols was the flavonoid subclass associated with the lower odds of elevated GlycA levels (P < 0·001).
OR and 95 % CI for elevated GlycA levels according to tertiles of energy-adjusted phenolic compound intake

Table 3 Long description
A table comparing the odds ratios and 95 percent confidence intervals for elevated GlycA levels according to tertiles of energy-adjusted phenolic compound intake. The table has 19 rows and 11 columns. Column headers are T1, T2 OR, T2 95 percent CI, T2 P-value, T3 OR, T3 95 percent CI, and T3 P-value. Row labels include Total phenolic compounds, Phenolic acids, Hydroxycinnamic acids, Hydroxybenzoic acids, Flavonoids, Flavan-3-ols monomers, Flavan-3-ols dimers, trimers, oligomers and polymers, Flavones, Flavonol, Flavanone, Anthocyanins, Stilbenes, Lignans, and Other. Each row provides the odds ratios and confidence intervals for the second and third tertiles compared to the first tertile, along with the corresponding P-values. Notable trends include lower odds of elevated GlycA levels in the highest tertile of intake for total phenolic compounds, phenolic acids, flavonoids, stilbenes, and other phenolics.
GlycA, glycoprotein acetylation.
Model 1 is adjusted for age, sex and per capita income; model 2 is adjusted for model 1, as well as for BMI, physical activity, smoking and non-red wine alcohol intake; model 3 is adjusted as for model 2, as well for intake of SFA and fibre. Energy-adjusted intakes of phenolic compounds were calculated using Willett’s residual method.
Elevated GlycA levels were defined as values above the 66th percentile (> 440 µmol/l).
E-selectin
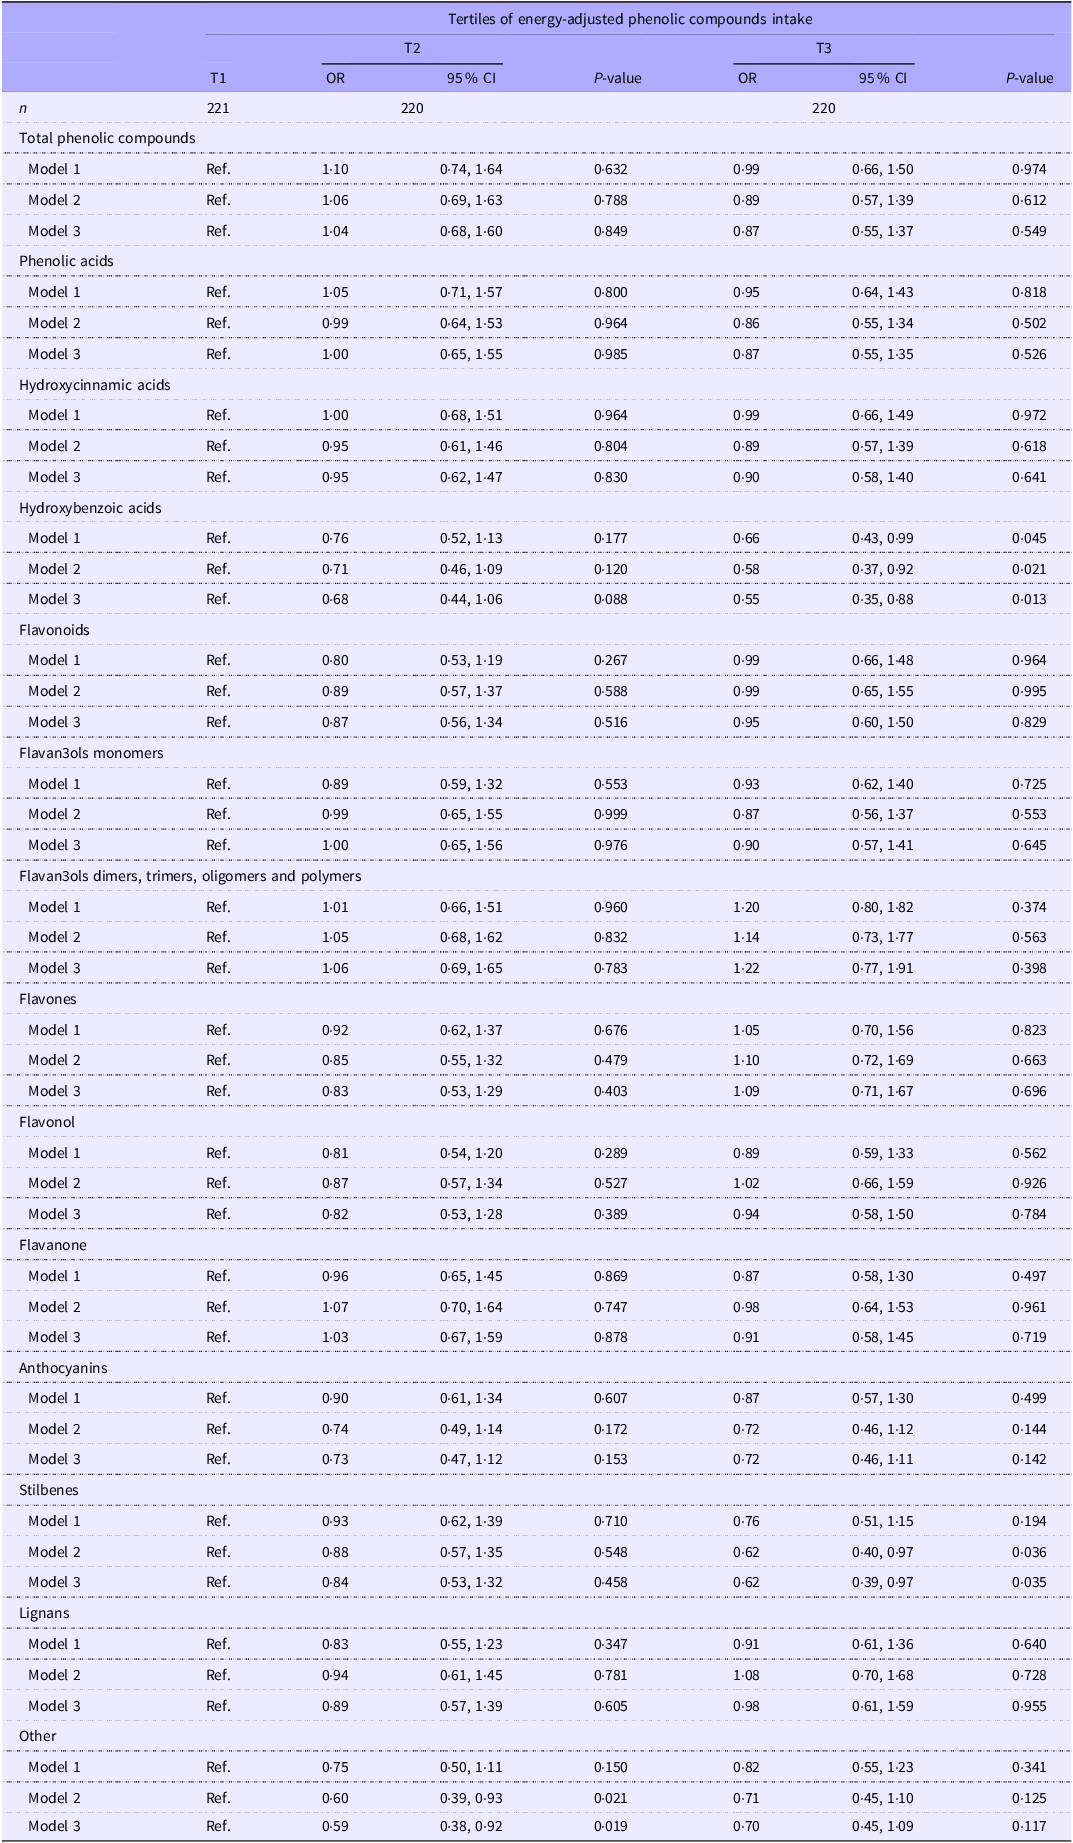
Table 4 displays the adjusted OR for the association between polyphenols and elevated E-selectin levels. The third tertile of intake of hydroxybenzoic acids and stilbenes was associated with 45 % and 38 % lower odds of having elevated E-selectin levels (hydroxybenzoic acids: T3 v. T1, OR 0·55 (0·35, 0·88), P = 0·013; and stilbenes: T3 v. T1, OR 0·62 (0·39, 0·97), P = 0·035). Although the P-values were below 0·05, these associations were not significant after adjusting for multiple testing (Bonferroni-corrected α = 0·0036).
OR and 95 % CI for elevated E-selectin levels according to tertiles of energy-adjusted phenolic compound intake

Table 4 Long description
A table comparing odds ratios (OR) and 95% confidence intervals (CI) for elevated E-selectin levels across tertiles of energy-adjusted phenolic compound intake. The table has 222 rows and 12 columns. Column headers include T1, T2, and T3, each with OR, 95% CI, and P-value subheaders. Row labels include Total phenolic compounds, Phenolic acids, Hydroxycinnamic acids, Hydroxybenzoic acids, Flavonols, Flavanols monomers, Flavanols dimers, trimers, oligomers and polymers, Flavones, Flavonol, Flavanone, Anthocyanins, Stilbenes, Lignans, and Other. Each row provides data for three models. For example, the first row under Total phenolic compounds shows OR values of 1.10, 0.99, and P-values of 0.632, 0.974 for T2 and T3 respectively. Notable trends include significant associations for hydroxybenzoic acids and stilbenes in the third tertile with lower odds of elevated E-selectin levels.
Model 1 is adjusted for age, sex and per capita income; model 2 is adjusted for model 1, as well as for BMI, physical activity, smoking and non-red wine alcohol intake; model 3 is adjusted as for model 2, as well for intake of SFA and fibre. Energy-adjusted intakes of phenolic compounds were calculated using Willett’s residual method.
Elevated E-selectin levels were defined as values above the 66th percentile (> 103·7 ng/ml).
Monocyte chemoattractant protein-1
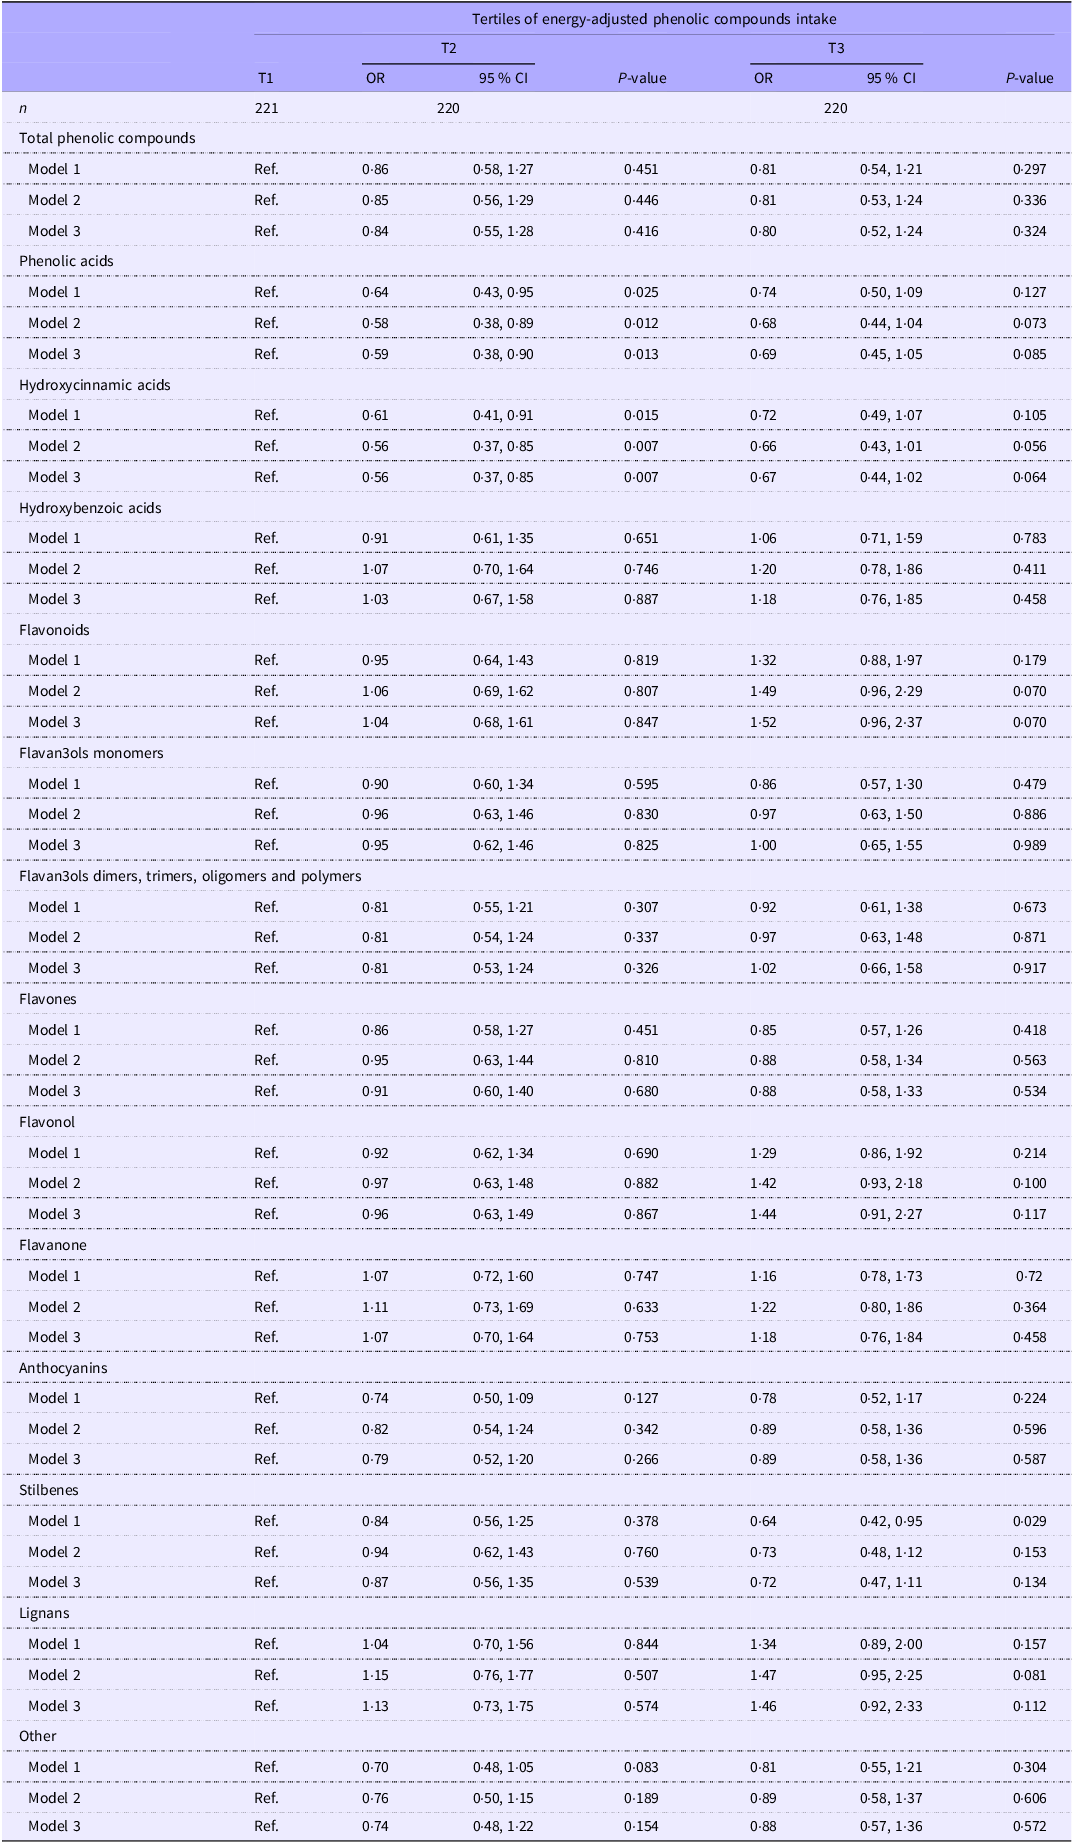
Table 5 presents the associations between tertiles of total, classes and subclasses of phenolic compounds intake and elevated MCP-1 levels. The second compared with the first tertile of phenolic acids and hydroxycinnamic acids was associated with 40 % and 44 % lower odds of having raised MCP-1 levels, respectively (total phenolic acids: T2 v. T1, OR 0·59 (0·38, 0·90), P = 0·013; hydroxycinnamic acids: T2 v. T1, OR 0·56 (0·37, 0·85), P = 0·007). While nominally significant (P < 0·05), these associations did not withstand correction for multiple testing (α = 0·0036).
OR and 95 % CI for elevated MCP-1 levels according to tertiles of energy-adjusted phenolic compound intake

Table 5 Long description
The table presents the associations between tertiles of total, classes, and subclasses of phenolic compounds intake and elevated MCP-1 levels. It includes data for 220 participants across three tertiles (T1, T2, T3) for various phenolic compounds. The table is divided into several rows and columns, with row labels indicating different phenolic compounds and their subclasses, and column headers showing the odds ratios (OR), 95% confidence intervals (CI), and P-values for each tertile compared to the reference tertile (T1). Each row provides data for three models, with Model 1 being the basic model, Model 2 adjusting for additional variables, and Model 3 adjusting for further variables. Notable findings include significant associations between the second tertile (T2) and the first tertile (T1) of phenolic acids and hydroxycinnamic acids with lower odds of having raised MCP-1 levels. Specifically, the odds ratio for phenolic acids in T2 compared to T1 is 0.59 (0.38, 0.90) with a P-value of 0.013, and for hydroxycinnamic acids, it is 0.56 (0.37, 0.85) with a P-value of 0.007. These associations are nominally significant but do not withstand correction for multiple testing.
MCP-1, monocyte chemoattractant protein-1.
Model 1 is adjusted for age, sex and per capita income; model 2 is adjusted for model 1, as well as for BMI, physical activity, smoking and non-red wine alcohol intake; model 3 is adjusted as for model 2, as well for intake of SFA and fibre. Energy-adjusted intakes of phenolic compounds were calculated using Willett’s residual method.
Elevated MCP-1 levels were defined as values above the 66th percentile (> 46·3 pg/ml).
IL-6, IL-10, TNF-α, transforming growth factor beta 1, fibrinogen and leptin
Multivariable logistic regressions showed a lack of significant associations between tertiles of total, classes and subclasses of phenolic compounds intake, in relation to elevated IL-6, IL-10, fibrinogen and leptin levels (online Supplementary Tables 2–7).
Discussion
In this study, we investigated the associations between dietary intake of phenolic compounds and inflammatory biomarkers in Brazilian adults. We observed an inverse association between total phenolic compounds intake and classes (except for lignans) and subclasses (except for flavonols and flavanones) with hs-CRP. GlycA levels were also linked to higher intakes of total phenolics, phenolic acids, flavonoids, stilbenes and other compounds. E-selectin was inversely associated with hydroxybenzoic acids and stilbenes intake, and MCP-1 was inversely associated with phenolic acids and hydroxycinnamic acids.
In line with our findings, a cross-sectional analysis from the Airwave Health Monitoring Study found lower odds of elevated CRP with higher intake of total phenolic compounds, including inverse associations between phenolic acids, flavonoids and other phenolics in relation to CRP levels in the UK population(Reference Dryer-Beers, Griffin and Matthews16). Other cross-sectional study reported similar inverse associations between the intake of phenolic acids, flavonoids and stilbenes and CRP levels in overweight and obese Iranian women(Reference Shiraseb, Hosseininasab and Noori18). Additionally, a cross-sectional analysis from NHANES found that intakes of total flavonoids, flavonols, anthocyanidins and isoflavones were inversely associated with serum CRP concentrations in the USA(Reference Chun, Chung and Claycombe17). In a cross-sectional study conducted among Taiwanese adults, higher intakes of total flavonoids, flavonols and flavan-3-ols were also associated with lower odds of elevated CRP levels(Reference Hsieh, Wang and Chien32). A cross-sectional data analysis performed with participants of the European Prospective Investigation into Cancer and Nutrition cohort pointed out that phenolic plasma concentrations were associated with 29 % lower odds of elevated hs-CRP(Reference Harms, Scalbert and Zamora-Ros33).
Regarding other inflammatory markers, few studies have explored the influence of phenolic compounds intake on blood levels. Shiraseb et al. found inverse associations between flavonoid and lignan consumption and MCP-1 concentrations, as well as between TGF-β and the intake of phenolic acids and other phenolics among overweight and obese Iranian women(Reference Shiraseb, Hosseininasab and Noori18). A similar trend was observed for lignan intake and leptin levels(Reference Shiraseb, Hosseininasab and Noori18), although no associations were found for circulating leptin in our study. An analysis of the HELENA study also revealed inverse associations between IL-10 levels and total phenolics and flavonoid intake, and between IL-1, IL-2 and IFN-γ with lignan intake(Reference Wisnuwardani, De Henauw and Ferrari19); however, no significant results were observed for these markers in our analysis. Likewise, the HELENA study and ours found no associations between phenolic intake and TGF-β1 or TNF-α levels(Reference Wisnuwardani, De Henauw and Ferrari19). Supporting our findings, Dryer-Beers also reported no associations between phenolic compounds intake and lower odds of elevated fibrinogen levels(Reference Dryer-Beers, Griffin and Matthews16).
Phenolic compounds demonstrate regulatory effects on pro-inflammatory markers by attenuating oxidative stress-driven inflammatory signalling. They also suppress signalling cascades controlled by mitogen-activated protein kinase (MAPK) and NF-κB pathways, resulting in reduced production of pro-inflammatory cytokines (IL-6 and TNF-α), chemokines (MCP-1), adhesion molecules (E-selectin) and acute-phase proteins (C-reactive protein) in cellular models(Reference Chuang and McIntosh34). Other mechanisms by which phenolic compounds can reduce inflammation, also demonstrated in cellular models, include the up-regulation of antioxidant enzymes through stimulation of regulatory pathways, such as the Keap1-Nrf2 pathway. In addition, phenolic compounds modulate enzymes, including cyclo-oxygenase, lipoxygenase and nitric oxide synthase, thereby reducing the production of inflammatory mediators such as PG, leukotrienes and nitric oxide(Reference Rudrapal, Khairnar and Khan35,Reference Cano, Bermúdez and Galban36) .
In the present study, specific classes of phenolic compounds exhibited distinct associations with inflammatory markers. Intake of phenolic acids was inversely associated with the odds of elevated MCP-1 levels, a key chemokine involved in monocyte recruitment and vascular inflammation. Previous studies conducted in cell models have reported comparable effects, with phenolic acids (particularly caffeic acid and ferulic acid) shown to downregulate MCP-1 expression via inhibition of NF-κB signalling(Reference Nakahara, Makino and Kamiya37,Reference Park and Han38) .
By modulating the gut microbiota, phenolic compounds can also help reduce inflammation and improve the overall inflammatory profile. Phenolic compounds, though poorly absorbed in the upper gastrointestinal tract, reach the colon, where they are metabolised by gut microbiota into derivatives of phenolic acids and other metabolites(Reference Cano, Bermúdez and Galban36). These metabolities can promote the growth of probiotic bacteria such as Bifidobacterium and Lactobacillus, which in turn produce SCFA(Reference Cano, Bermúdez and Galban36). SCFA help maintain intestinal barrier integrity and reduce endotoxin translocation, a process that would otherwise trigger systemic inflammation through activation of toll-like receptors on immune cells. In addition, SCFA are known to inhibit the NF-κB pathway, thereby reducing the synthesis of cytokines, chemokines, adhesion molecules, pro-inflammatory enzymes and other inflammatory mediators(Reference Cano, Bermúdez and Galban36,Reference Sheng, Meng and Li39) .
Studies have shown that phenolic-rich foods can beneficially alter gut microbiota composition, reducing inflammation-associated pathogens and modulating inflammatory pathways. Red wine intake, an important contributor to phenolic compounds intake in our study, has been associated with reductions in inflammatory markers, largely due to its content of stilbenes, namely resveratrol(Reference Li, Hur and Cao40). Resveratrol exhibits potent anti-inflammatory effects by inhibiting inflammatory pathways and reducing oxidative stress. Studies suggest that moderate red wine consumption can lower levels of vascular cell adhesion molecule-1 (VCAM-1) and TNF-α, via down-regulation of NF-κB and MAPK pathways(Reference Sheng, Meng and Li39). However, it is important to acknowledge that alcohol itself may exert independent and sometimes opposing effects on inflammation. Moderate alcohol consumption has been associated with reduced levels of certain inflammatory markers or with no significant effect, whereas higher intakes are linked to increased systemic inflammation and oxidative stress(Reference Romeo, Wärnberg and Nova41,Reference Watzl, Bub and Briviba42) . Therefore, the anti-inflammatory effects observed for wine should be interpreted considering the potential dual influence of alcohol.
Coffee and yerba mate tea, other important contributors to phenolic acids and total phenolic compounds intake in our study, present higher levels of isomers of chlorogenic acid, which in turn exert anti-inflammatory effects by also modulating NF-κB and MAPK pathways(Reference Lopez-Garcia, van Dam and Qi43–Reference Miranda, Steluti and Fisberg46). Other studies indicate that orange juice consumption, the second main contributor to flavonoid intake in the Brazilian population(Reference Carnauba, Hassimotto and Lajolo26,Reference Carnauba, Sarti and Hassimotto27,Reference Carnauba, Sarti and Hassimotto47) , also positively impacts gut microbiota and reduces inflammation(Reference de Santana, Tobaruela and dos Santos48,Reference Brasili, Hassimotto and Del Chierico49) . The flavanones compounds in orange juice (hesperidin and naringenin) promote the growth of beneficial bacteria such as Bifidobacterium and Lactobacillus, while decreasing pathogenic bacteria. This gut microbiota modulation contributes to a reduction in systemic inflammation. Notably, intake of orange juice has been associated with lower levels of inflammatory markers in human studies, including CRP, IL-6 and TNF-α (Reference de Santana, Tobaruela and dos Santos48,Reference Brasili, Hassimotto and Del Chierico49) .
This study has several strengths, including a comprehensive evaluation of the associations between phenolic compounds intake (total intake, classes and subclasses) and ten inflammatory markers. Other strength is the inclusion of GlycA, a novel biomarker that reflects systemic inflammation through protein glycosylation, providing a unique insight into inflammatory processes. However, limitations should be acknowledged. The cross-sectional design precludes establishing causal relationships between phenolic compounds intake and inflammatory markers, as both were assessed at a single time point. Moreover, the generalisability of the findings may be limited, since the ELSA-Brasil cohort consists of civil servants with relatively stable socio-economic conditions and health awareness, which may not fully represent the broader Brazilian population. The smaller sample size for some inflammatory markers may also have reduced the statistical power of the analyses. In addition, the estimation of phenolic compound intake relied on an FFQ, which, despite being validated for dietary assessment in the ELSA-Brasil population, is subject to recall bias and measurement error. The use of food composition databases for phenolic compound content is another potential limitation, as phenolic concentrations can vary according to crop variety, ripeness, storage and growing conditions. Certain food items such as herbs, oils and spices were not specifically captured by the FFQ and thus not included in the intake calculations, although recipe disaggregation was used to mitigate this limitation. Finally, some phenolic-rich foods, such as natural fruit juices, were grouped together, potentially biasing the assessment of total phenolic compounds intake.
In conclusion, this study offers a comprehensive assessment of total phenolic compounds intake, along with intake of classes and subclasses, and their associations with inflammatory markers. Higher phenolic compounds intake was linked to lower odds of elevated hs-CRP and GlycA levels, highlighting its potential anti-inflammatory benefits. The importance of future research lies in elucidating the mechanisms (particularly through omics techniques), as well as conducting clinical and epidemiological studies to investigate the long-term impact of phenolic compounds intake on inflammation across diverse populations, which could significantly enhance the understanding of the role of phenolic compounds in managing inflammation-related chronic diseases.
Supplementary material
For supplementary material/s referred to in this article, please visit https://doi.org/10.1017/S000711452610662X.
Acknowledgements
We would like to thank the institutions that supported the ELSA-Brasil study, including the Brazilian Ministry of Health, the Brazilian Ministry of Science and Technology (CNPq – National Research Council), and the São Paulo Research Foundation (FAPESP). Renata Alves Carnauba received a postdoctoral scholarship from the São Paulo Research Foundation (FAPESP) (grant number 2025/05614-4).
The ELSA-Brasil baseline study and the follow-up were supported by the Brazilian Ministry of Health (Science and Technology Department) and the Brazilian Ministry of Science and Technology (Financiadora de Estudos e Projetos and CNPq National Research Council) (grants of baseline: RS 01 06 0010.00, BA 01 06 0212.00, ES 01 06 0300.00, MG 01 06 0278.00, SP 01 06 0115.00, RJ 01 06 0071.00). The research center of São Paulo was also supported by the São Paulo Research Foundation (FAPESP). Renata Alves Carnauba received postdoctoral scholarship from the São Paulo Research Foundation (FAPESP) (grant number 2025/05614-4). The funders had no role in study design, data collection and analysis, decision to publish or preparation of the manuscript.
Conceptualization: R.A.C., F.M.L. Methodology: R.A.C., F.M.L. Formal analysis: R.A.C., F.M.L. Investigation: R.A.C., F.M.L. Data curation: R.A.C. Writing – original draft: R.A.C., F.M.L. Writing – review & editing: R.A.C., F.M.S., D.M.M., B.A.P., S.R.F., P.A.L., I.M.B., N.M.A.H., F.M.L. Supervision: F.M.L. All authors read and approved the final manuscript..
There are no conflicts of interest.