Introduction
Zeolitic imidazolate frameworks (ZIFs) are porous crystalline materials consisting of well-ordered pores.[Reference Gomar and Yeganegi1] These materials are consisting of metal cluster nodes and organic linkers.[Reference Biradha, Ramanan and Vittal2, Reference Kitagawa, Kitaura and Noro3] They have high-surface areas and adsorption capacities; and often exhibit high thermal, chemical, and hydrothermal stabilities.[Reference Park, Ni, Côté, Choi, Huang, Uribe-Romo, Chae, O'Keeffe and Yaghi4] Their intrinsic porous characteristics, abundant functionalities as well as their exceptional thermal and chemical stabilities render ZIFs attractive candidates for a wide range of applications such as gas storage, molecular separation, catalysis, drug delivery, and chemical sensors.[Reference Banerjee, Phan, Wang, Knobler, Furukawa, O'Keeffe and Yaghi5–Reference Pan and Lai7] Properties, types, and structures of ZIFs depend mainly on different combinations of imidazole linkers and metal ions.[Reference Chen, Yang, Zhu and Xia8, Reference Wang, Liu, Leong, Lin, Wei, Kong, Xu, Low, Yao and Wang9] The literature reports a great number of ZIFs, which can be synthesized by different transition metals, imidazole linkers, and solvents such as water, dimethylformamide, diethylformamide, ethanol, and methanol.[Reference Şahin, Topuz and Kalıpçılar10, Reference Li, Zhou, He and Yao11] ZIFs can be synthesized by solvothermal or hydrothermal synthesis methods at temperatures between 25 and 150 °C using an excess amount of imidazole.[Reference Bhattacharjee, Jang, Kwon and Ahn12] Cu(II) and Zn(II) metal–organic framework films on metal substrates were prepared by various techniques such as sonochemical technique.[Reference Abuzalat, Wong, Elsayed, Park and Kim13]
The object of this communication letter is to study the effect of metal center type on morphology and pore structure of ZIF-8 analogs. Metal centers used are Co2+ and Cu2+. Morphology investigation will be measured by NanoSEM and transmission electron microscopy (TEM). Nitrogen gas adsorption/desorption at 77 K into ZIF-8 products will be investigated. Pore structure will be studied by density functional theory (DFT). Pore structures include total surface areas in pores wider than 0.5 nm, total pore volume, average particle sizes, DFT total surface area energy, average pore size, and percentages of micropores, mesopores, and macropores.
Experimental
Zn(NO3)2·6H2O (98%, Sigma Aldrich) and Cu(NO3)2·2.5H2O (≥99.99%, Sigma Aldrich), and Co(NO3)2·6H2O (98%, Sigma Aldrich) were used as metal centers. 2-Methylimidazole (C4H5N2, 97%, Sigma Aldrich) was used as a linker. Nitrogen and helium (99.999%) were purchased from NIGP (Doha, Qatar). Methanol (99.8%, Alfa Aesar) was used as solvent. Other chemicals were used without further purification. Full details of synthesis of ZIF-8, Zn/Co-ZIF-8 and Cu/ZIF-8 and their characterizations are found in Supplementary data.
Results and discussion
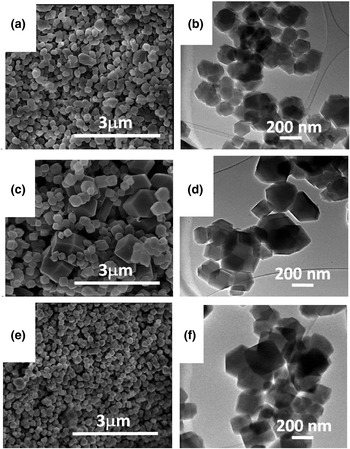
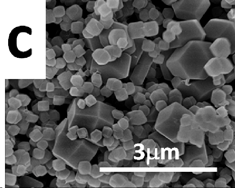
Figures 1(a)–1(f) show NanoSEM and TEM photomicrographs of ZIF-8, Zn/Co-ZIF-8, and Cu/ZIF-8. It was observed that the presence of copper and cobalt metal centers in the matrix of ZIF-8 leads to changing morphologies in both surface and bulk. Photomicrographs of Figs. 1(a), 1(c), and 1(e) refer to images by NanoSEM, whereas Figs. 1(b), 1(d), and 1(f) refer to TEM. It can be noted from Fig. 1(c) that particle sizes of Zn/Co-ZIF-8 is larger than those of ZIF-8 and Cu/ZIF-8 presented in Figs. 1(a) and 1(e), respectively. Therefore, it is clear that metal center type affects morphology of ZIFs. TEM photomicrographs presented in Figs. 1(b), 1(d), and 1(f) refer to ZIF-8, Zn/Co-ZIF-8, and Cu/ZIF-8, respectively. TEM images show transparent crystals, where even the edge line of the TEM grid behind some crystals is exposed. Further, crystals in the background could also be seen. This indicates that samples are somewhat transparent to electrons.
NanoSEM (a, c and e) and TEM (b, d and f) photomicrographs of ZIF-8 (a and b), Zn/Co-ZIF-8 (c and d), and Cu/ZIF-8 (e and f). Scale bar lengths in NanoSEM is 3 µm, and in TEM 200 nm.

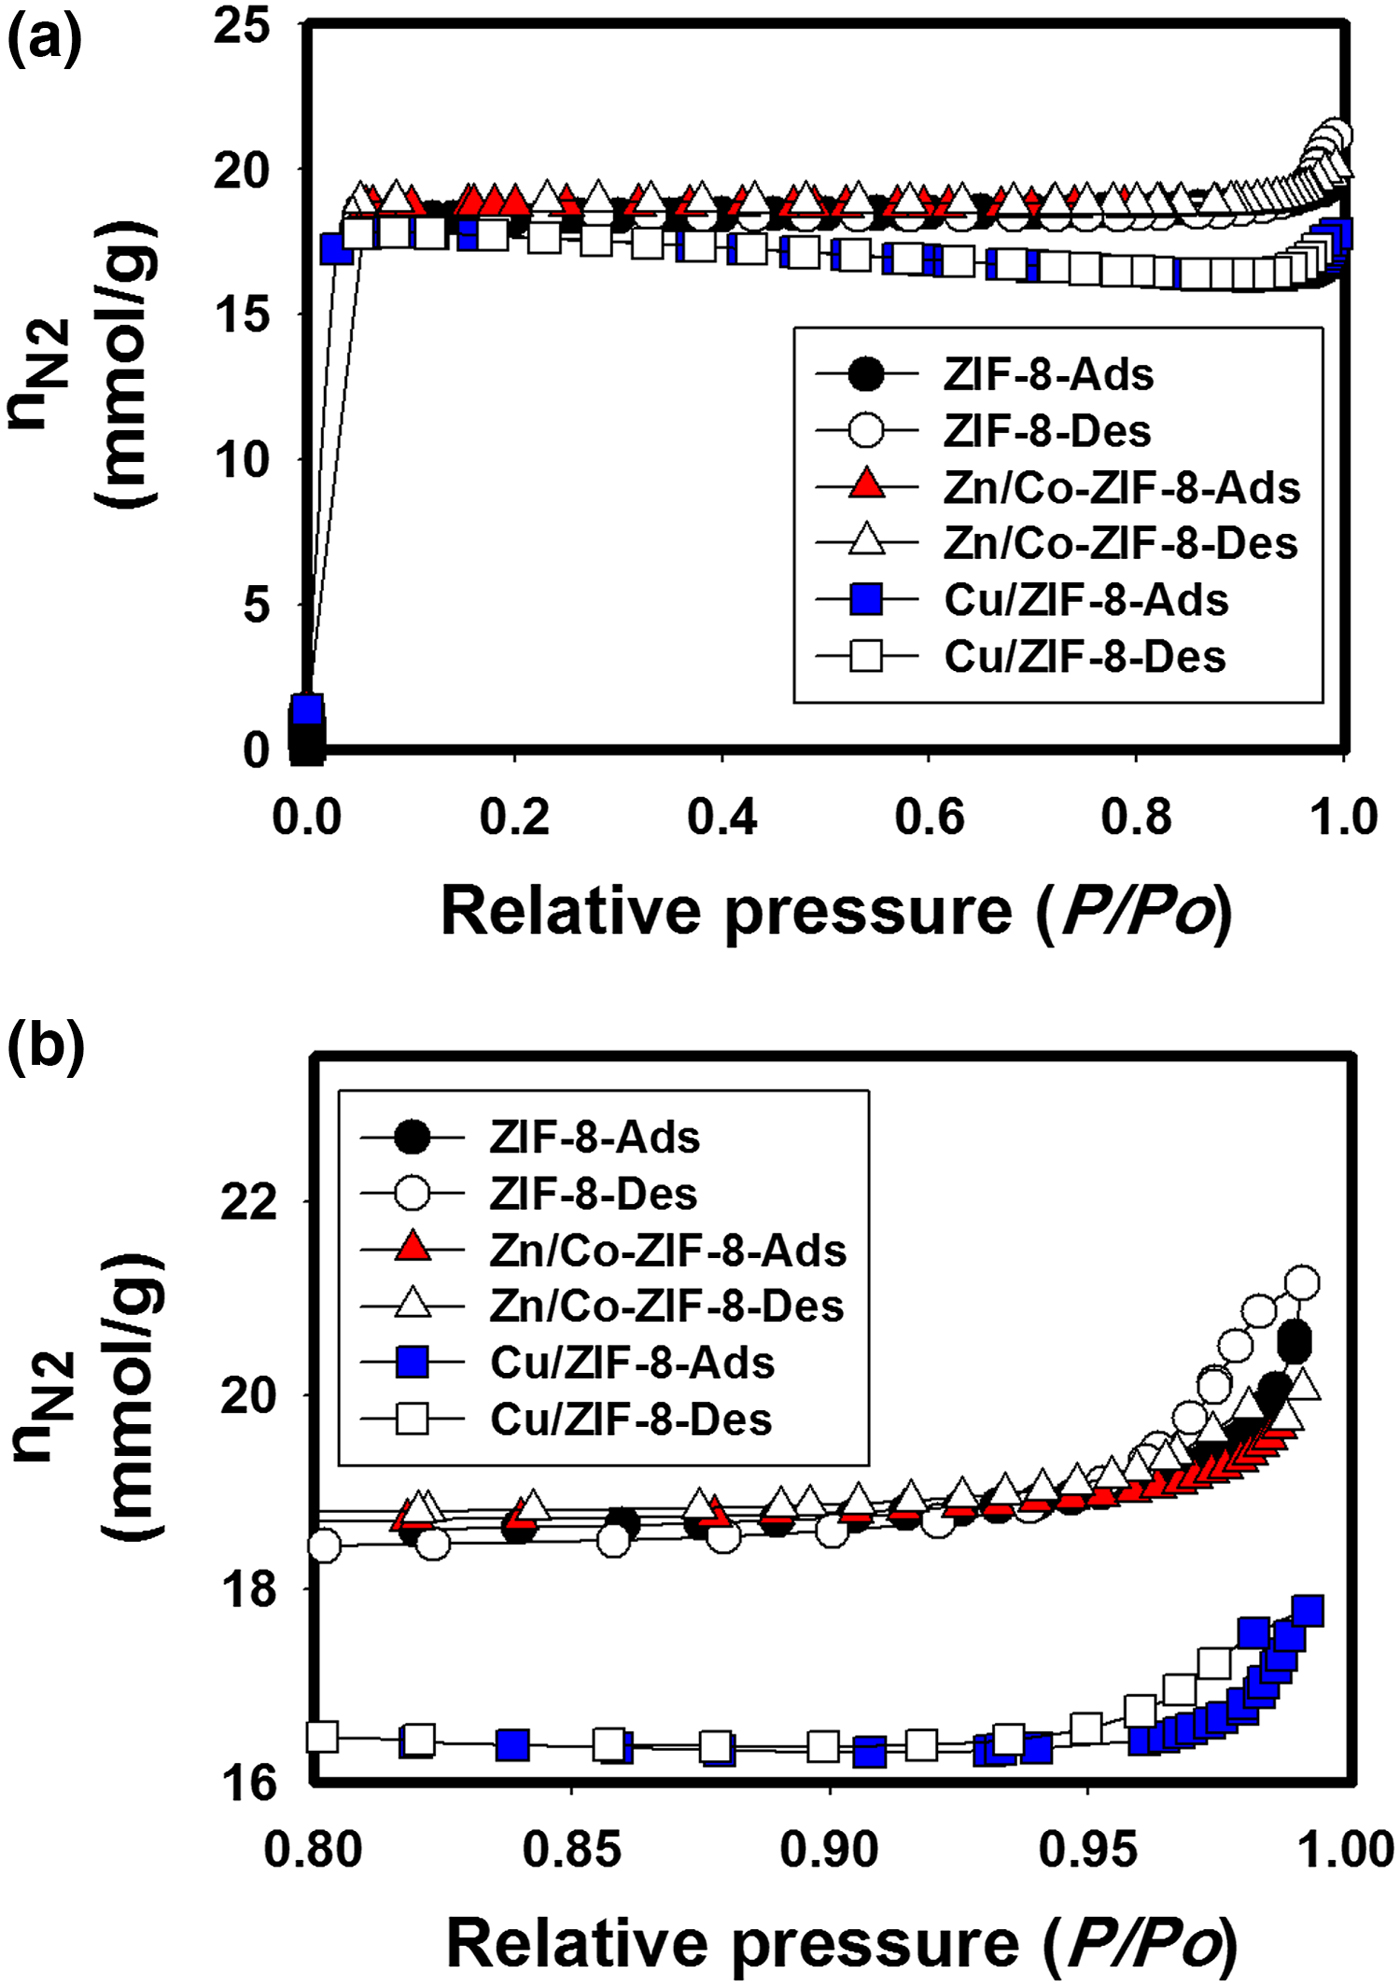
Figure 2(a) shows adsorption/desorption of N2 at 77 K on samples. Maximum amounts of N2 adsorbed onto ZIF-8, Zn/Co-ZIF-8, and Cu/ZIF-8 are 18.327, 18.858, and 17.784 mmol/g, respectively. Zn/Co-ZIF-8 exhibits the highest capacity, whereas Cu/ZIF-8 exhibits the lowest capacity. Therefore, metal center type has a noticeable effect on amount of N2. Further, it was observed that there is a very small hysteresis loop [in sub-Fig. 2(b)] during adsorption/desorption at P/P 0 > 0.95 (P is the pressure and P 0 is saturation pressure of N2 at 77 K [0.954 atm]). Consequently, there is small capillary condensation occurring during adsorption/desorption at a high-relative pressures. Typical type-I isotherms were obtained for samples, which declares the presence of almost full microporosity.[Reference Sing, Everett, Haul, Moscou, Pierotti, Rouquerol and Siemieniewska14] However, behavior of isotherms for P/P 0 values beyond 0.95 changes to type-IV, which may refer to the existence of very small amount of large pores due to intra-aggregate voids.[Reference dos Santos, da Silva, Mal, Bataglion, Eberlin, Ronconi, Júnior and de Sá15] Results of adsorption/desorption agreed with DFT data listed in Table I.
(a) Adsorption/desorption of N2 onto ZIF-8, Zn/Co-ZIF-8, and Cu/ZIF-8 and (b) subfigure of adsorption/desorption of N2 onto ZIF-8, Zn/Co-ZIF-8, and Cu/ZIF-8 at 77 K.

Characteristics of ZIF-8, Zn/Co-ZIF-8, and Cu/ZIF-8.

a Obtained from built-in calculations in Micromeritics ASAP2420 (DFT model).
b Calculated from reported proportions of cumulative areas pores, micropores <2, mesopores >2 to 50 nm, and balance is macropores.
c Calculated from the ratio of mass to volume as obtained from buoyancy measurements in helium.[Reference Awadallah-F and Al-Muhtaseb16]
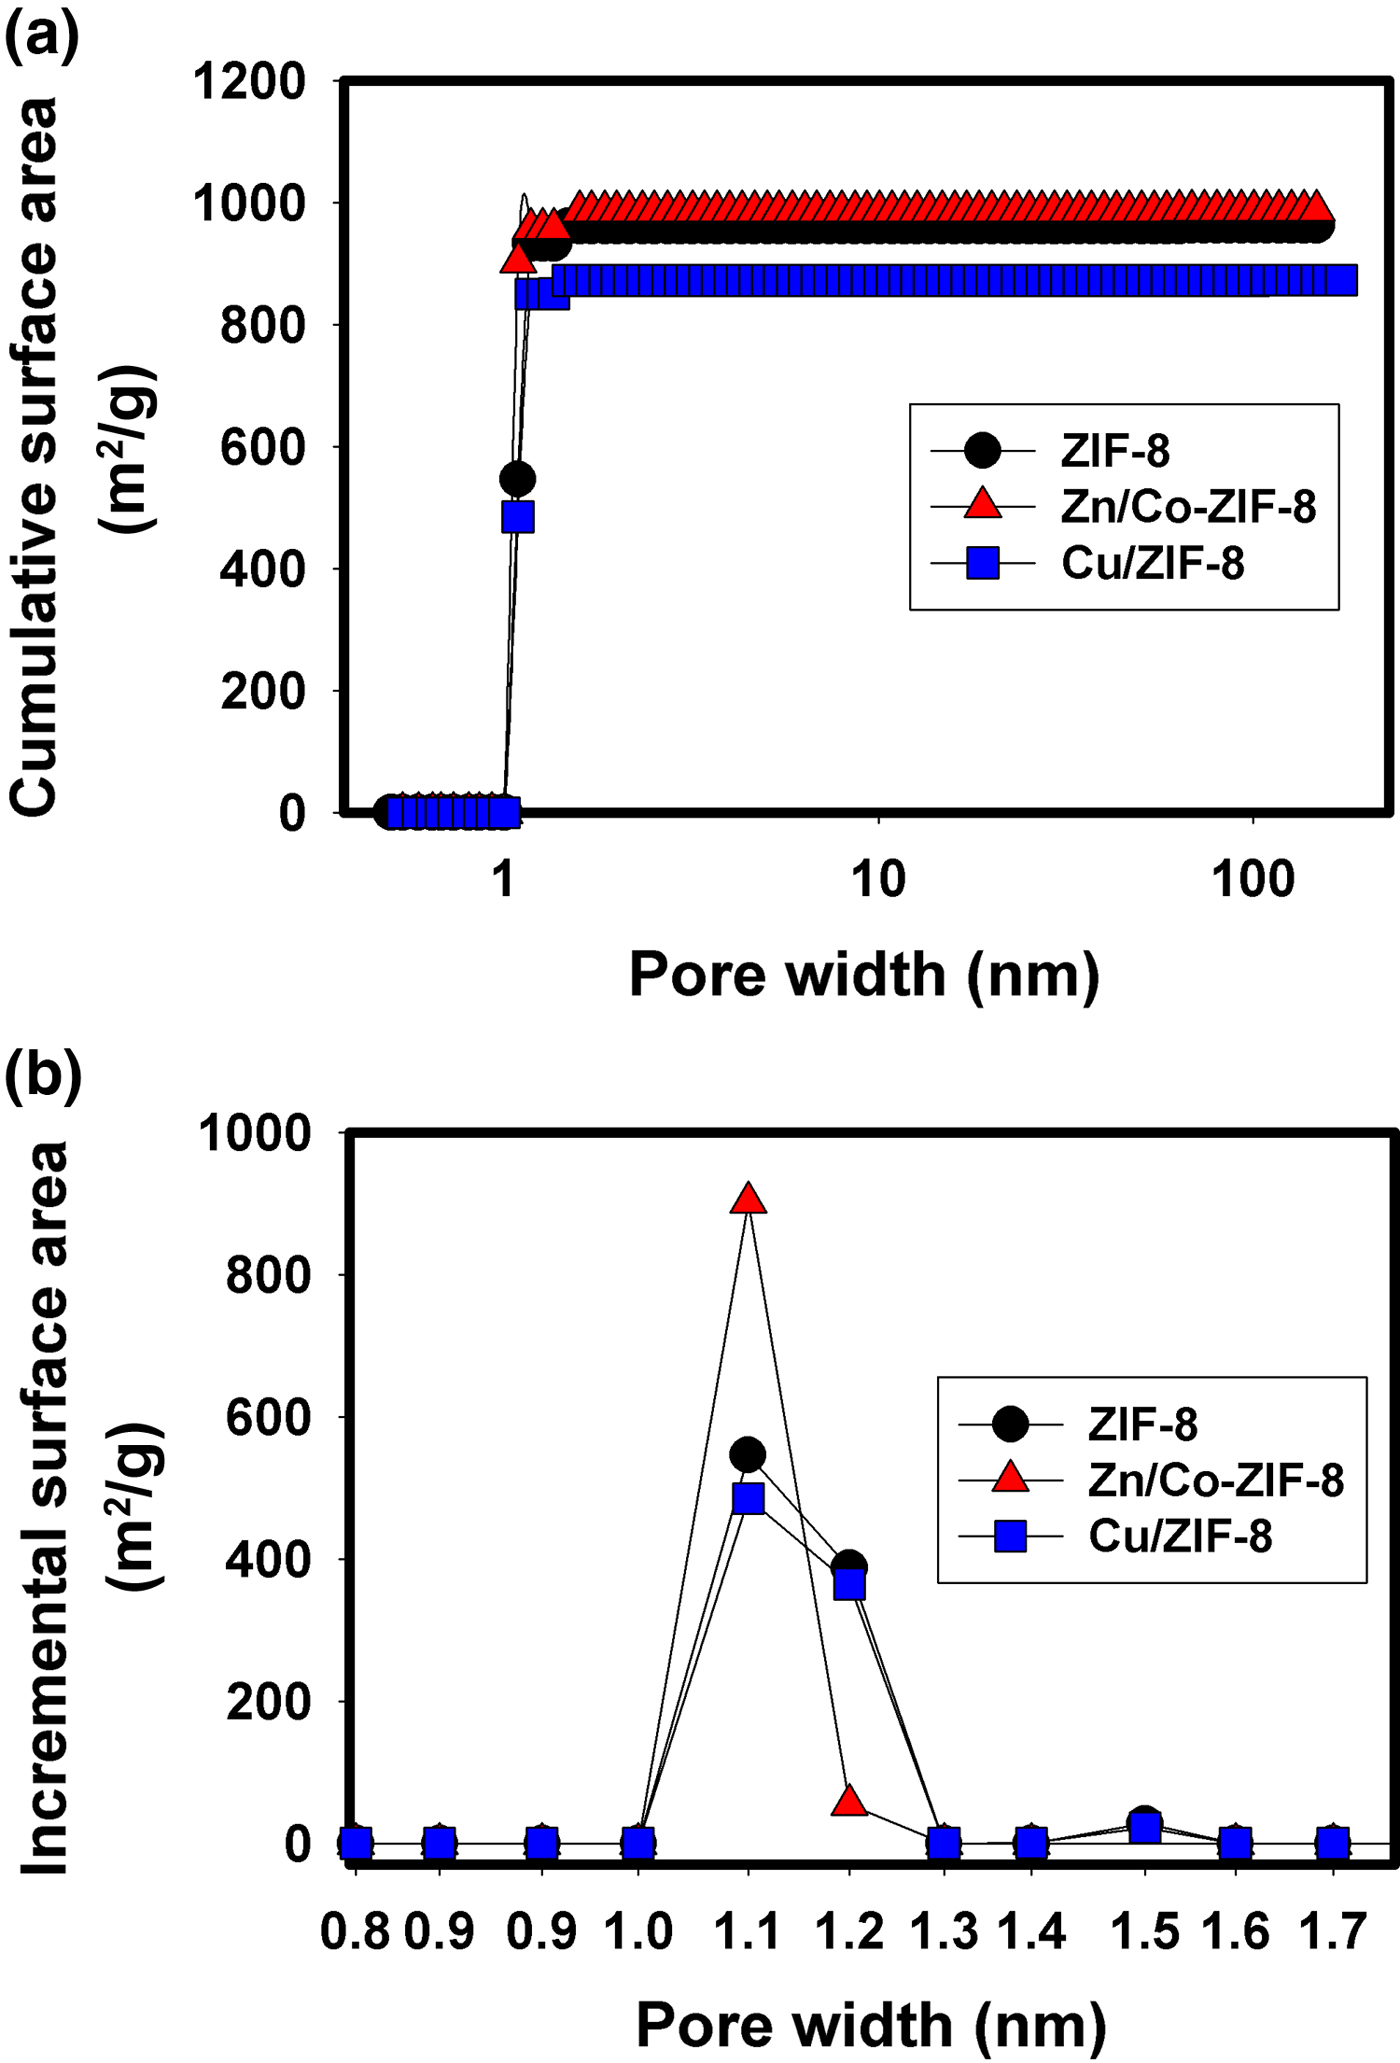
Figures 3(a) and 3(b) show the effect of pore width on cumulative and incremental surface areas of ZIF-8, Zn/Co-ZIF-8, and Cu/ZIF-8. Figure 3(a) illustrates the relationship between pore size and cumulative area. It was noticed that Zn/Co-ZIF-8 exposes the highest cumulative area and Cu/ZIF-8 represents the lowest one. Sequential order of cumulative area is Zn/Co-ZIF-8 > ZIF-8 > Cu/ZIF-8, and their corresponding cumulative areas are 987.2, 963.0, and 972.8 m2/g, respectively. Furthermore, the relationship between pore width and cumulative area is constant after ~2 nm, which indicates that no micropores existed beyond that value. Values of area, average pore width, and other parameters related to pore structure are listed in Table I. Figure 3(b) illustrates the influence of pore width on incremental area. It was seen that incremental area increased only at specific range of pore width value (between 1.0 and 1.34 nm). Incremental area increased significantly with a maximum value at 1.1 nm (x-axis with log scale and truncated from >1.7 nm to show the change), which indicates that this is the most frequent micropore width in samples. The corresponding maximum incremental area values are 546.0, 902.1, and 484.9 m2/g for ZIF-8, Zn/Co-ZIF-8, and Cu/ZIF-8, respectively.
Relationships between the pore width and (a) cumulative area, and (b) incremental area of ZIFs.

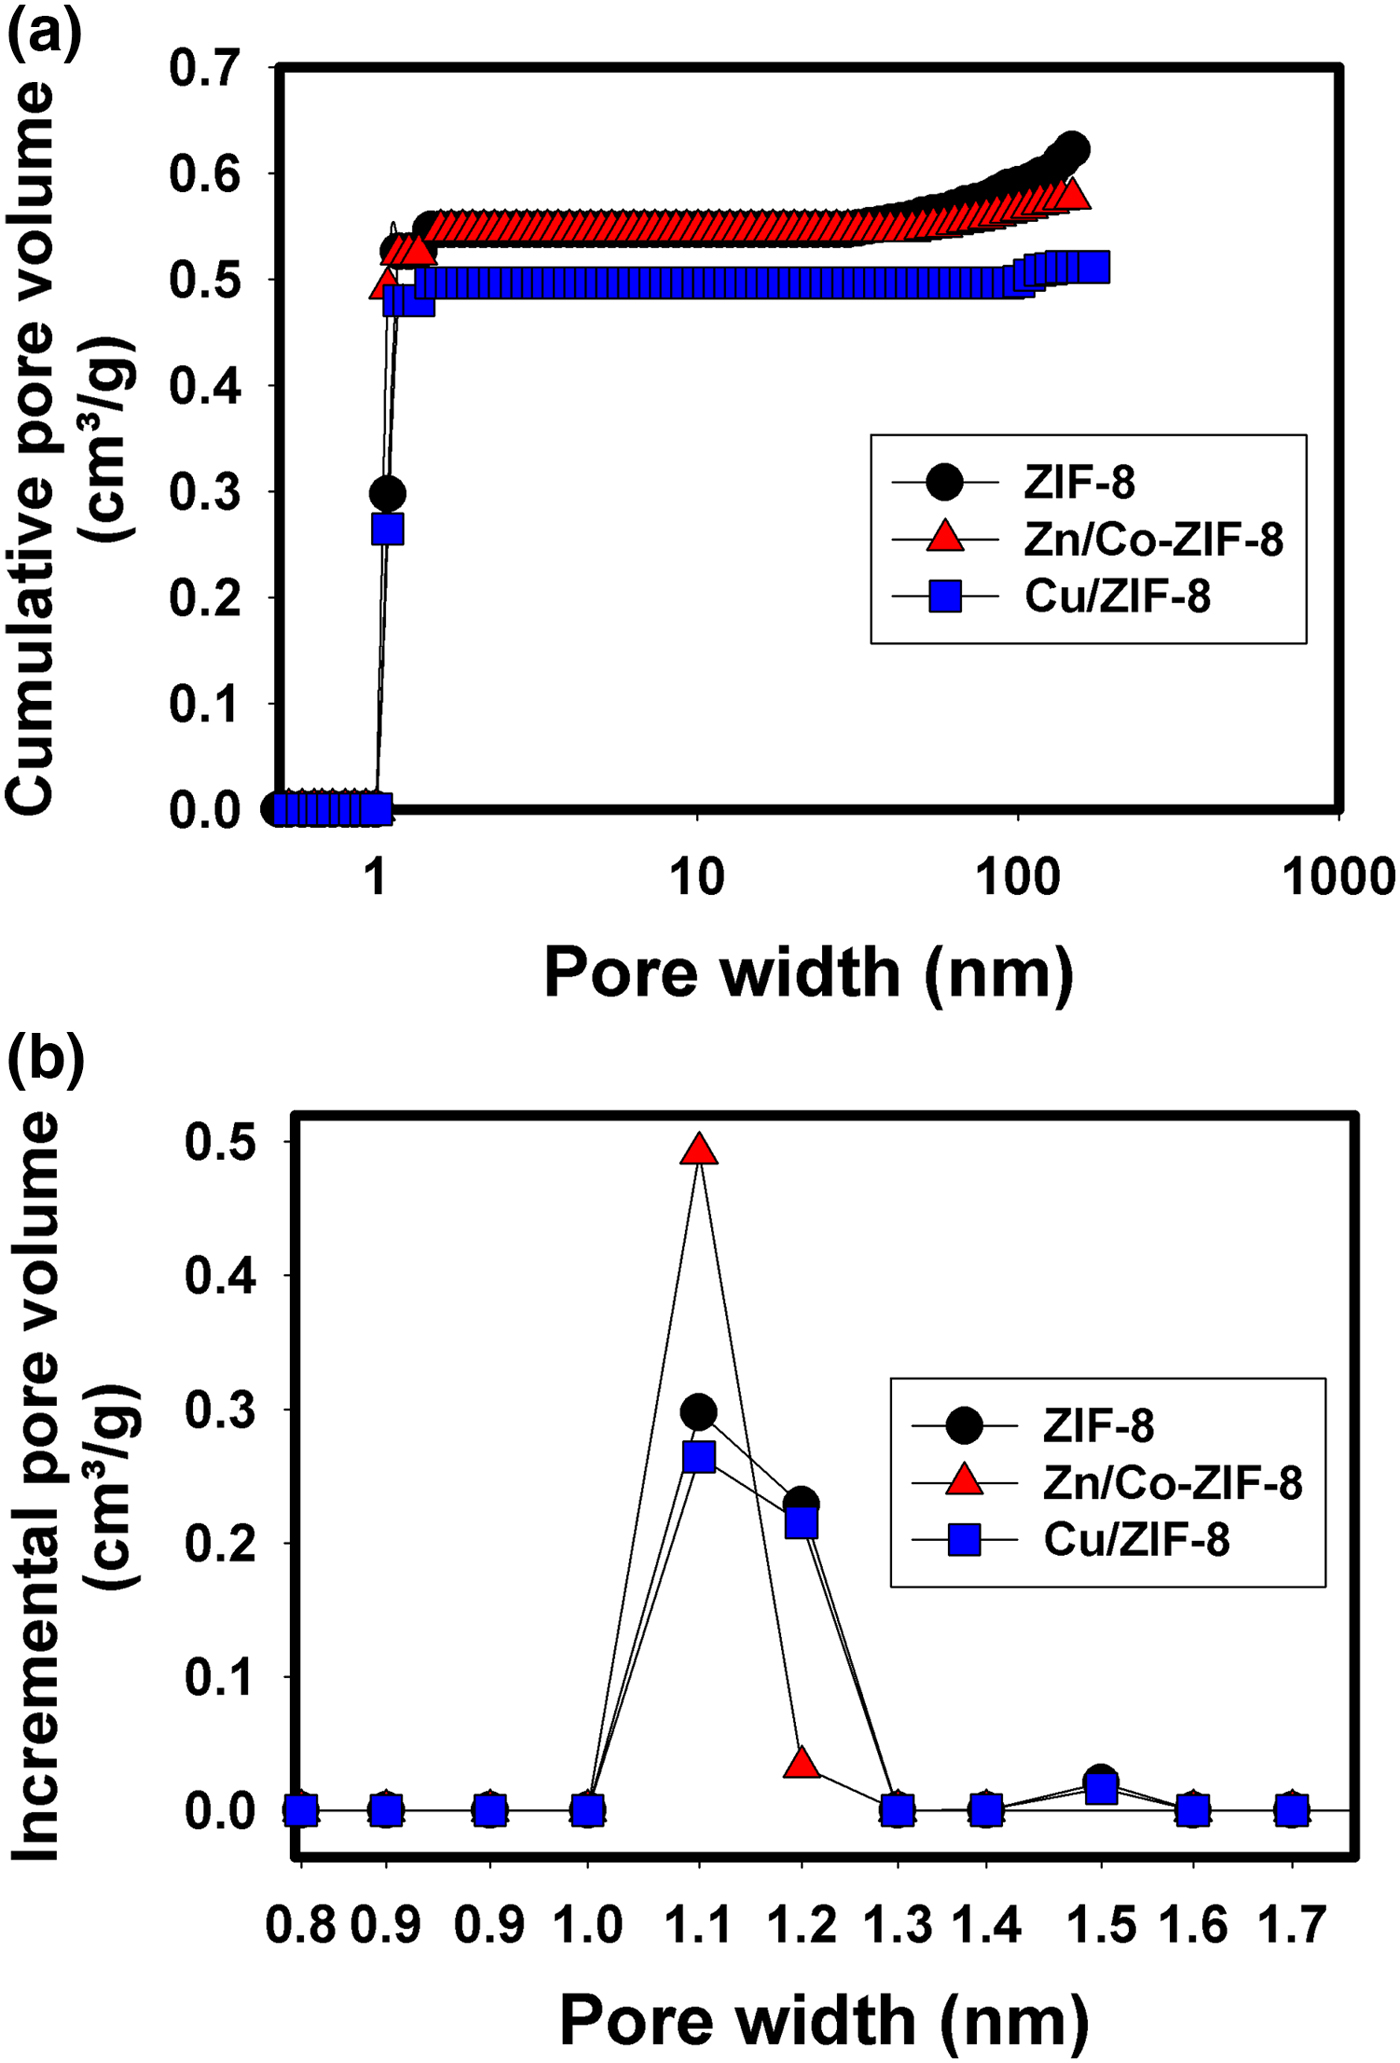
Figures 4(a) and 4(b) show distributions of cumulative and incremental pore volumes of ZIF-8, Zn/Co-ZIF-8, and Cu/ZIF-8 with pore width. It was observed from Fig. 4(a) that the effect of pore width on cumulative volume has a significant increment at 1.088 nm for Zn/Co-ZIF-8 and 1.126 nm for both of ZIF-8 and Cu/ZIF-8. Effect of pore width on cumulative volume >1.233 nm for Zn/Co-ZIF-8 and >1.306 nm for both of ZIF-8 and Cu/ZIF-8 are non-significant. It was noticed that the cumulative volume of ZIF-8, Zn/Co-ZIF-8, and Cu/ZIF-8 are 0.621, 0.576, and 0.511 cm3/g, respectively. Cumulative volume of Zn/Co-ZIF-8 is the highest whereas that of Cu/ZIF-8 is the lowest. Figure 4(b) shows the influence of pore width on incremental volumes of ZIF-8, Zn/Co-ZIF-8, and Cu/ZIF-8. It is clear that pore width has effect only at a specific range on incremental volume (between ~1.0 and ~1.3 nm) and a non-significant effect on rest of range. Furthermore, maximum incremental volume value was 0.491 cm3/g for Zn/Co-ZIF-8 at a pore width of 1.1 nm. On the other hand, maximum values of incremental volumes of ZIF-8 and Cu/ZIF-8 are, respectively, 0.316 and 0.228 cm3/g at 1.2 nm. Therefore, it could be said that metal center type has a significant effect on both cumulative and incremental volume. The deduced pore properties from the Micromeritics ASAP-2420® surface area analyzer for ZIF-8, Zn/Co-ZIF-8, and Cu/ZIF-8 are listed in TABLE I. Moreover, the comparison of this work with other approaches was found in Table S1 (Supplementary Data).
Relationship between the pore width and (a) cumulative volume and (b) incremental volume of ZIFs.

Conclusions
This study tackled influence of metal center type on morphology and pore structure of ZIF-8 analogs as ZIF-8, Co/ZIF-8, and Cu/ZIF-8. Pore properties were investigated by DFT of nitrogen adsorption/desorption. Amount of N2 adsorbed, incremental and cumulative area, incremental and cumulative volume, and DFT total areas, average pore width, average particle size, DFT total surface energy, and pore structure distributions were studied. Results showed that samples constitute from almost microporous structure and their average pore widths ranged from 1.64 to 1.291 nm. Morphology was analyzed by NanoSEM and TEM. Results showed that samples constitute from crystals with different sizes depending on metal type. Overall, results indicate that metal type has a significant impact on ZIF-8 morphology and pore structure as well.
Supplementary material
The supplementary material for this article can be found at https://doi.org/10.1557/mrc.2018.221.
Acknowledgments
This publication was made possible by NPRP awards (NPRP 08-014-2-003 and NPRP-8-001-2-001) from Qatar National Research Fund (a member of Qatar Foundation). H.K.-J. acknowledges support from National Science Foundation (CMMI-1561897). Statements made herein are solely the responsibility of authors. Technical support from the Department of Chemical Engineering and Central Laboratory Unit (CLU) at Qatar University is also acknowledged.