

1. Introduction
The link between institutions and economic development seems beyond doubt. Similarly there is a large literature linking ethnic diversity with economic development: countries with higher levels of ethnic fractionalisation are generally much poorer. This article explores the link between measures for precolonial institutions and those for ethnic fractionalisation. Linking these two measures prompts discussion of what they are actually measuring.
This paper is organised as follows. First there is a brief review of the ethnic fractionalisation and precolonial institutions literature. Then there is a discussion of why precolonial institutions should be related to current measures of ethnic fractionalisation and the factors that may militate against this relationship. After outlining the main ethnic fractionalisation indices some basic cross-country econometric analysis is undertaken. This is followed by a case study of precolonial institutions and ethnic fractionalisation in the South Pacific – bringing some concreteness to the discussion. This is followed by some conclusions.
2. Ethnic fractionalisation and precolonial institutions literatures
The literature linking measures of ethnic fractionalisation to economic development is highly cited and well known (see Alesina et al., Reference Alesina, Baqir and Easterly1999; Alesina et al. Reference Alesina, Devleeschauwer, Easterly, Kurlat and Wacziarg2003; Easterly and Levine, Reference Easterly and Levine1997; La Porta et al. Reference La Porta, Lopez-de-Silanes, Shleifer and Vishny1999; Mauro, Reference Mauro1995; Montalvo and Reynal-Querol, Reference Montalvo and Reynal-Querol2005). It finds that higher levels of fractionalisation are associated with lower levels of economic development, and there have been a number of transmission mechanisms proposed to explain this statistical relationship. Mauro (Reference Mauro1995) used ethnolinguistic fractionalisation as an instrument for corruption, which in turn was related to investment. Easterly and Levine (Reference Easterly and Levine1997) suggested that ethnic diversity encourages the adoption of growth-retarding rent-seeking policies (that favour one ethnic group at the expense of another), and that fractionalisation can make it more difficult get political consensus for growth-promoting public goods. Similarly, Alesina et al. (Reference Alesina, Baqir and Easterly1999) suggested that different ethnic groups have different preferences in terms of public good provision and therefore rationally choose to devote more resources to private consumption. While these transmission channels are all different to some degree, they can be sourced back to the creation of ‘us’ and ‘them’ preferences, leading to the suboptimal functioning of state institutions (see Alesina and La Ferrara, Reference Alesina and La Ferrara2005 for a review of this literature).Footnote 1
A ‘precolonial institutions’ literature has also developed. This literature has linked precolonial institutions to current economic development outcomes (see Angeles and Elizalde, Reference Angeles and Elizalde2017; Gennaioli and Rainer, Reference Gennaioli and Rainer2007; Michalopoulos and Papaioannou, Reference Michalopoulos and Papaioannou2013; Ziltener and Müller, Reference Ziltener and Müller2007). This literature finds that societies that were less politically centralised in precolonial times have lower levels of economic development in the postcolonial period. This literature often acknowledges that while European colonisation had profound effects, it was often limited both in terms of geographic reach and time. Therefore precolonial institutions often persisted through the colonial period to present times, especially in rural areas. Herbst (Reference Herbst2000) suggests that local chiefs were more accountable in politically centralised societies and that such societies already had wealth-generating institutions in place (including more formal and stable property rights regimes).Footnote 2 On this, Ziltener and Müller (Reference Ziltener and Müller2007: 382–383) conclude that when ‘state control and political legitimacy were already established by local rulers before the arrival of colonizers, postcolonial nation-building can reach back to, and modernize these autochthonous mechanisms instead of imposing new state institutions upon tribal structures’, and that wealth-generation institutions ‘appear more acceptable when they are in line with historically rooted cultural identity’.
Once one looks at the fundamental causes of both sets of literatures, there are striking similarities. The ethnic fractionalisation literature has focused on the generation of ‘us and them’ preferences and how these impede the functioning of state institutions. The precolonial institutions literature highlights the persistence of non-state institutions, most notably how persistent decentralised tribal institutions can be less compatible with contemporary state institutions and the provision of public goods.
3. Linking precolonial institutions and ethnic fractionalisation
It is proposed that there is a fundamental link between ethnic fractionalisation (which is largely a social phenomenon) with the degree of precolonial jurisdictional centralisation (which is largely a political phenomenon). If this is the case, then all things being equal, we can expect more ethnically fractionalised places to be less politically fractionalised (and vice versa). In making this claim, it is acknowledged that both are likely to be subject to many (different) influences and shocks, meaning that it is unlikely that they will ever be perfectly aligned.
The most commonly used measure of precolonial institutions is the variable: ‘jurisdictional hierarchy beyond the local community’. The categorical variables of this measure are: 0 – No political authority beyond community (clans without a designated village chief); 1 – one level (petty chiefdoms); 2 – two levels (paramount chiefdoms); 3 – three levels (states or kingdoms); and 4 – four levels (more complex states with multiple tiers of governance). This measure is derived from Murdock's (Reference Murdock1969) Ethnographic Atlas, which contains quantitative measures of various social, economic and institutional variables for 1,270 societies across the world. Murdock (Reference Murdock1969: 52) explicitly aimed to exclude anything ‘imposed’ by colonial regimes from his measurements that was sourced from descriptions of anthropologists during colonial times, mainly between 1890 and 1950.
There are two main explanations for how the degree of political centralisation developed, which are not necessarily mutually exclusive. The first suggests an endogenous process where autochthonous groups were formed by communities aggregating or where new communities broke away from larger ones to form their own new jurisdictions. The reasons for the formation of these groups could occur along the lines outlined by Alesina, Baqir and Hoxby (Reference Alesina, Baqir and Hoxby2004), where the benefits of economies of scale are traded off with the costs of greater heterogeneity in determining group size. Where there are net benefits of amalgamation, a common ruler could be appointed to rule over and administer this new combined jurisdiction. Similar endogenous processes of group formation are outlined by Ahlerup and Olsson (Reference Ahlerup and Olsson2012) and Ashraf and Galor (Reference Ashraf and Galor2013), while Michalopoulos (Reference Michalopoulos2012) proposes an endogenous process based on geographic differences. The second explanation for the formation of political centralisation suggests a largely exogenous process where external forces imposed their rule on collections of previously independent communities through conquest, and put in place jurisdictional hierarchies to secure control, and there are numerous examples of this process (see Austin, Reference Austin2008; Von Hellermann and Usuanlele, Reference Von Hellermann and Usuanlele2009).
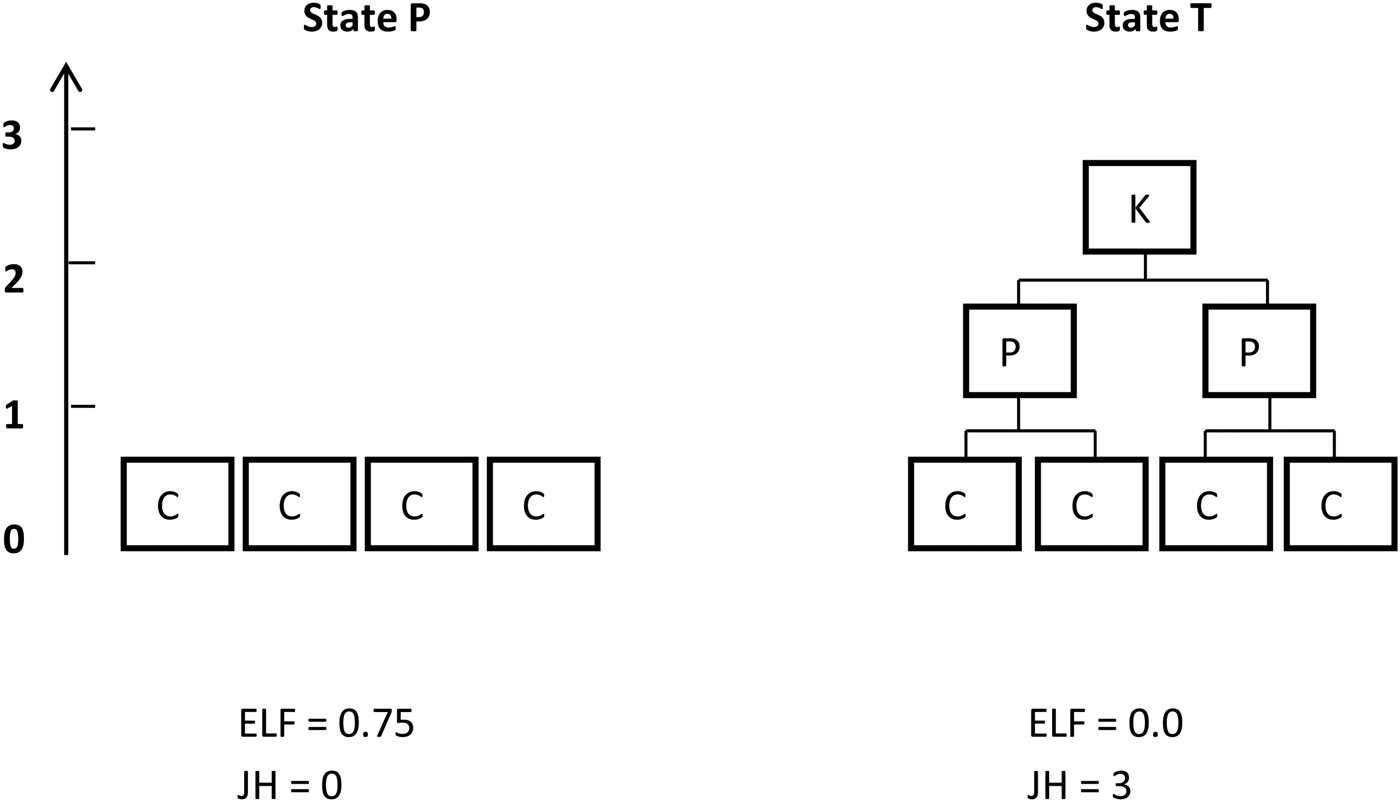
To explain the relationship between ethnic fractionalisation and precolonial political centralisation, it is useful to consider two postcolonial states with very different degrees of political organisation in precolonial times as depicted in Figure 1 below. Let us assume that one postcolonial state (State P) was a collection of small politically independent communities prior to European colonisation, while the other was ruled by a line of kings (State T). By definition, State P would achieve a low score in terms of Murdock's measure for jurisdictional hierarchy, either 0 or 1. It would achieve a score of 1 if there were chiefs in charge of the local communities or 0 if even more decentralised institutions were in place, such as multiple leaders sharing and competing for power. In the case of state T, again by definition, this would achieve a high jurisdictional hierarchy score. In the case depicted in Figure 1, it would achieve a score of 3 due to a layer of paramount chiefs (PCs) between the king (K) and local chiefs. It would achieve a 4 if there was another layer of governance between the monarch and the local leadership. If precolonial ethnic groupings mirrored precolonial political groupings (or vice versa) State P will be highly ethnically fractionalised and State T will not. Specifically, if the four separate ethnic communities in State P were of equal size it would have a high ethnic fractionalisation score of 0.75. If in State T the king ruled a united people who saw themselves as one ethnic group, it would have a low ethnic fractionalisation score of 0. This assumption implies a fundamentally negative relationship between Murdock's measure for precolonial political centralisation (‘jurisdictional hierarchy beyond the local community’) and ethnic fractionalisation.
Precolonial jurisdictional hierarchy and ethnic fractionalization

Why should we expect ethnic groupings to mirror precolonial political groupings? In the case of State P, it had a multitude of independent communities, with no central (or even regional) government in place. If these independent political units identify as different ethnic groups, they will have high levels of ethnic fractionalisation. In contrast, postcolonial State T has a history of nationhood dating back to precolonial times (where its people shared a common monarch). If this common rule and history translate into a common identity it will have low levels of ethnic fractionalisation. It may also be the case that these ethnic groups organised themselves politically, such that the number of political groupings mirrored the number of ethnic groupings. For example, in the case of State P different ethnic groups may have broken away from a more centralised political organisation, or in the case of State T similar ethnic groups may have banded together to form one political organisation. It is proposed that precolonial institutions and precolonial ethnic fractionalisation must almost certainly be related to one another; specifically jurisdictional hierarchy should have a negative relationship to current levels of ethnic fractionalisation.
The above calculation relies on the assumption that those who were united by common rule shared a common ethnic identity. However, this is not always the case. Just because a mass of people had a common precolonial ruler, it does not necessarily mean that they identified as belonging to the same ethnic group, especially if it was brought about through conquest. However, even in these circumstances there are reasons to expect that a common governance regime should help to unite previously disparate ethnic groups. We can expect common rule to increase interactions among those from different ethnic groups and it should also see the introduction of common ethnic markers, such as language, religion, and the propagation of a culture of nationhood itself (see Weber, Reference Weber1976 for a detailed account of this process in the making of France). On this Wimmer (Reference Wimmer2016: 6) states:
More precisely, states that are capable to provide public goods across the entire territory and that are politically strong enough to disempower and integrate local elites provide incentives for minorities to adopt the language of the dominant groups and to eventually adopt the core identity.Footnote 3
Conversely, numerous separate governance regimes should lead to a continuation of ethnic diversity (by an absence of such channels identified above) and commonly held notions of separateness and difference that may pervade the culture. In terms of the latter, Filer (Reference Filer and Lutkehaus1990: 116) suggests that a ‘culture of diversity’ existed among the Sepik people of Papua New Guinea. He suggests that this culture, which was accompanied by extremely decentralised precolonial political institutions, highlighted, sought out and perhaps even generated different ethnic markers (such as language) among close neighbours. Intriguingly, Filer (Reference Filer and Lutkehaus1990) cites apparent accounts of whole groups in the Sepik region of switching languages, in efforts to distinguish or align themselves with other groups.
If precolonial political and ethnic groupings continue to persist into the postcolonial state, they should therefore be related to current levels of ethnic fractionalisation. However, there are at least three reasons to expect the relationship to be an imperfect one. First, ethnic groups might have developed during the colonial or postcolonial eras. There is a large literature documenting how colonial administrations and their political descendants amplified ethnic divisions for their own gain.Footnote 4 Second, it is well known that the boundaries of many postcolonial states bear little resemblance to the boundaries of precolonial societies. The final reason is that colonisation and conquest often led to mass migrations. Two of the most notable were those generated by slavery (mainly from Africa to the Americas) and European settlement (mainly to the Americas, but also to Australia, New Zealand and pockets within Africa and Asia). The sheer magnitude of these migrations led some precolonial ethnic groups to become a small minority in their ‘new world’ state.Footnote 5
4. Empirical analysis
The empirical analysis consists of two parts. First there an analysis of the precolonial and ethnic fractionalisation data and their relationship to one another. Then there is a study of precolonial institutions and ethnic fractionalisation in the South Pacific.
Data analysis
Precolonial institutions
In line with the precolonial institutions literature, the measure chosen for analysis is jurisdictional hierarchy beyond the local community (as outlined above). This is sourced from Müller et al. (Reference Müller, Kock Marti, Seiler Schiedt and Arpagaus2000) who constructed precolonial data at the country level, by weighting the precolonial jurisdictional hierarchy score for each ethnic group by their population. This population-weighted measure is a continuous variable with the range of 0 to 4, where the lower the degree of centralised authority the closer the measure is to zero. This largely deals with the fact that current state boundaries bear little resemblance to precolonial borders. In an effort to further isolate precolonial institutions, and the role of mass migrations, Müller et al.’s (Reference Müller, Kock Marti, Seiler Schiedt and Arpagaus2000) dataset also excludes Europe and the European settler colonies and the whole of the Americas. Specifically, it only includes countries where people of European origin make up less than 10% of the population.Footnote 6 In total, they provide precolonial institutions country level data for 86 current African, Asian and Pacific countries.
Ethnic fractionalisation
There are numerous ethnic fractionalisation indices that emphasise different aspects of ethnicity or use different data sources. Taylor and Hudson (Reference Taylor and Hudson1972) were the first to calculate a cross-country ethnolinguistic fractionalisation index, using data from the Atlas Narodov Mira. Their index, like all the fractionalisation indices, measures the probability that two randomly selected individuals in a country will belong to different groups. Therefore, the index increases both in the number of ethnic groups and the more equal they are in size. The Taylor and Hudson (Reference Taylor and Hudson1972) measure has been used widely, including Mauro (Reference Mauro1995) and Easterly and Levine (Reference Easterly and Levine1997). In addition to using their data, Easterly and Levine (Reference Easterly and Levine1997) also constructed an aggregate measure that included four other indices, which was also used and augmented by La Porta et al. (Reference La Porta, Lopez-de-Silanes, Shleifer and Vishny1999). Since then, others have constructed their own ethnic fractionalisation measures conscious of the many complexities surrounding the concept, including the apparent ability for ethnicity to mutate, and to utilise different data sources. Alesina et al. (Reference Alesina, Devleeschauwer, Easterly, Kurlat and Wacziarg2003) developed cross-country indices that aimed to separate ethnic, religious and linguistic heterogeneity. In relation to ethnicity, while acknowledging that it ‘remains a rather vague and amorphous concept’ they set out to construct a measure more closely to related to ‘racial’ characteristics than language (Alesina et al., Reference Alesina, Devleeschauwer, Easterly, Kurlat and Wacziarg2003: 160).Footnote 7 Fearon (Reference Fearon2003) also produced measures for ethnic and cultural fractionalisation, highlighting the salient ethnic marker at the country level and the linguistic and temporal nature of these concepts. Montalvo and Reynal-Querol (Reference Montalvo and Reynal-Querol2005) also constructed an alternative measure for ethnic fractionalisation (and polarisation) using a lower level of disaggregation and sourcing their data primarily from the World Christian Encyclopedia.
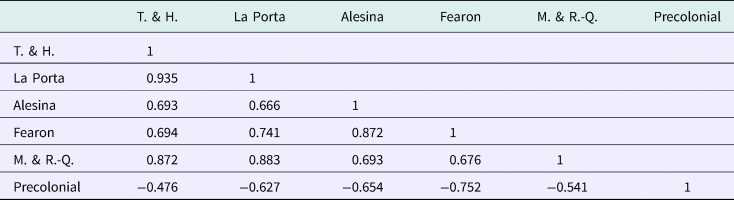
As can be seen in Table 1, all the indices are highly correlated with one another. The pairwise correlation coefficients (for this sample of postcolonial countries) range from a high of 0.94 for Taylor and Hudson's (Reference Taylor and Hudson1972) index (sourced from data from Atlas Narodov Mira) and La Porta et al.’s (Reference La Porta, Lopez-de-Silanes, Shleifer and Vishny1999) composite index, to a low of 0.67 between La Porta et al.’s (Reference La Porta, Lopez-de-Silanes, Shleifer and Vishny1999) index and Alesina et al.’s (Reference Alesina, Devleeschauwer, Easterly, Kurlat and Wacziarg2003) index.Footnote 8
Correlation coefficients of ethnic fractionalisation indices

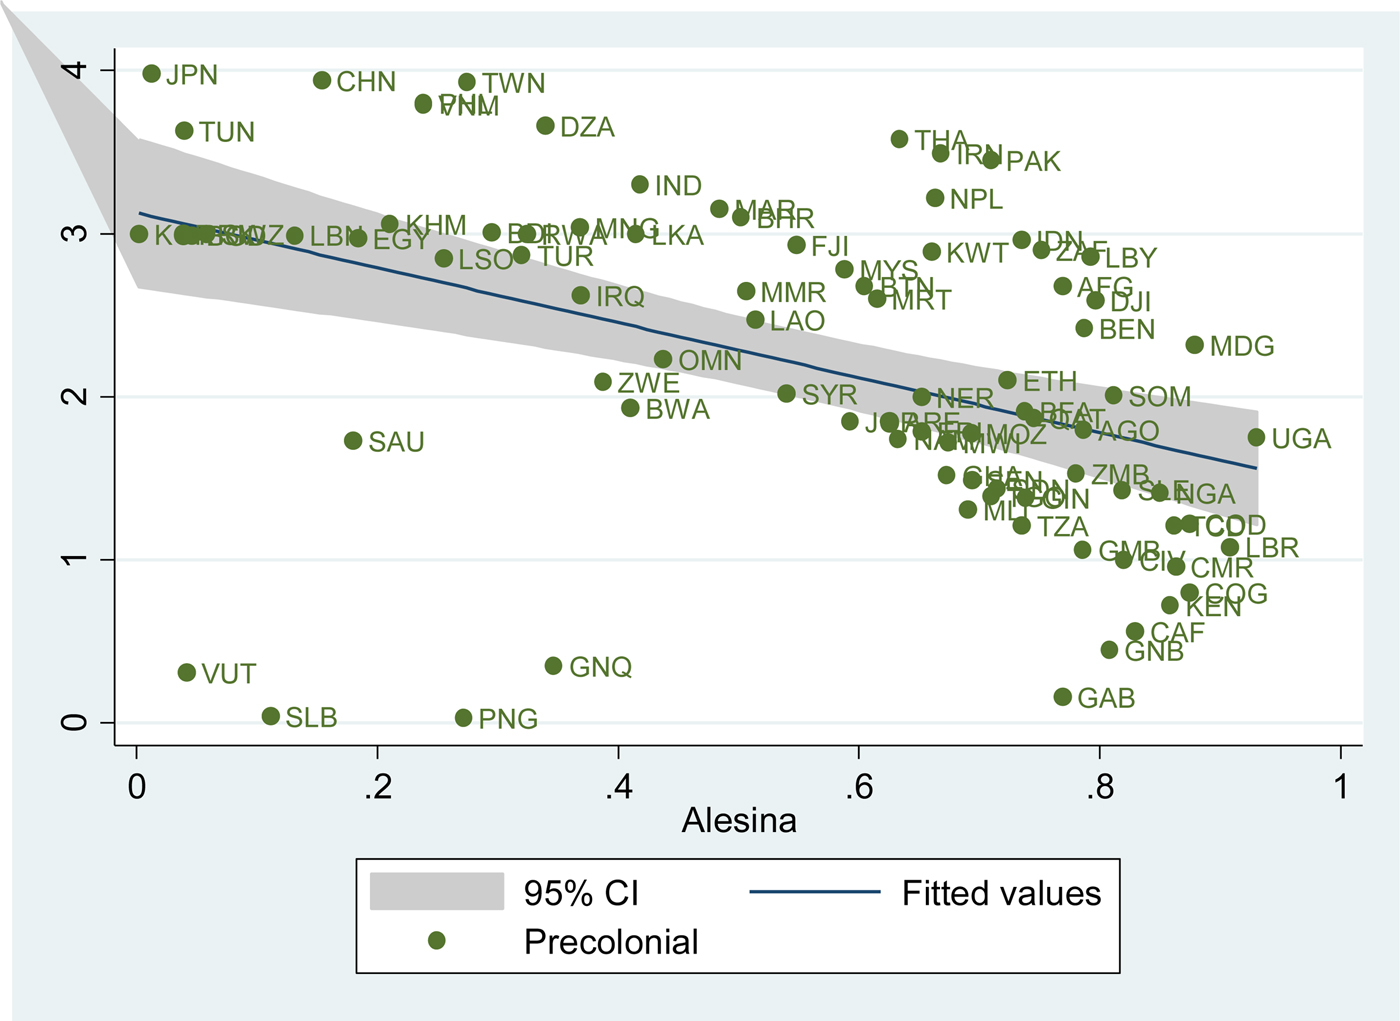
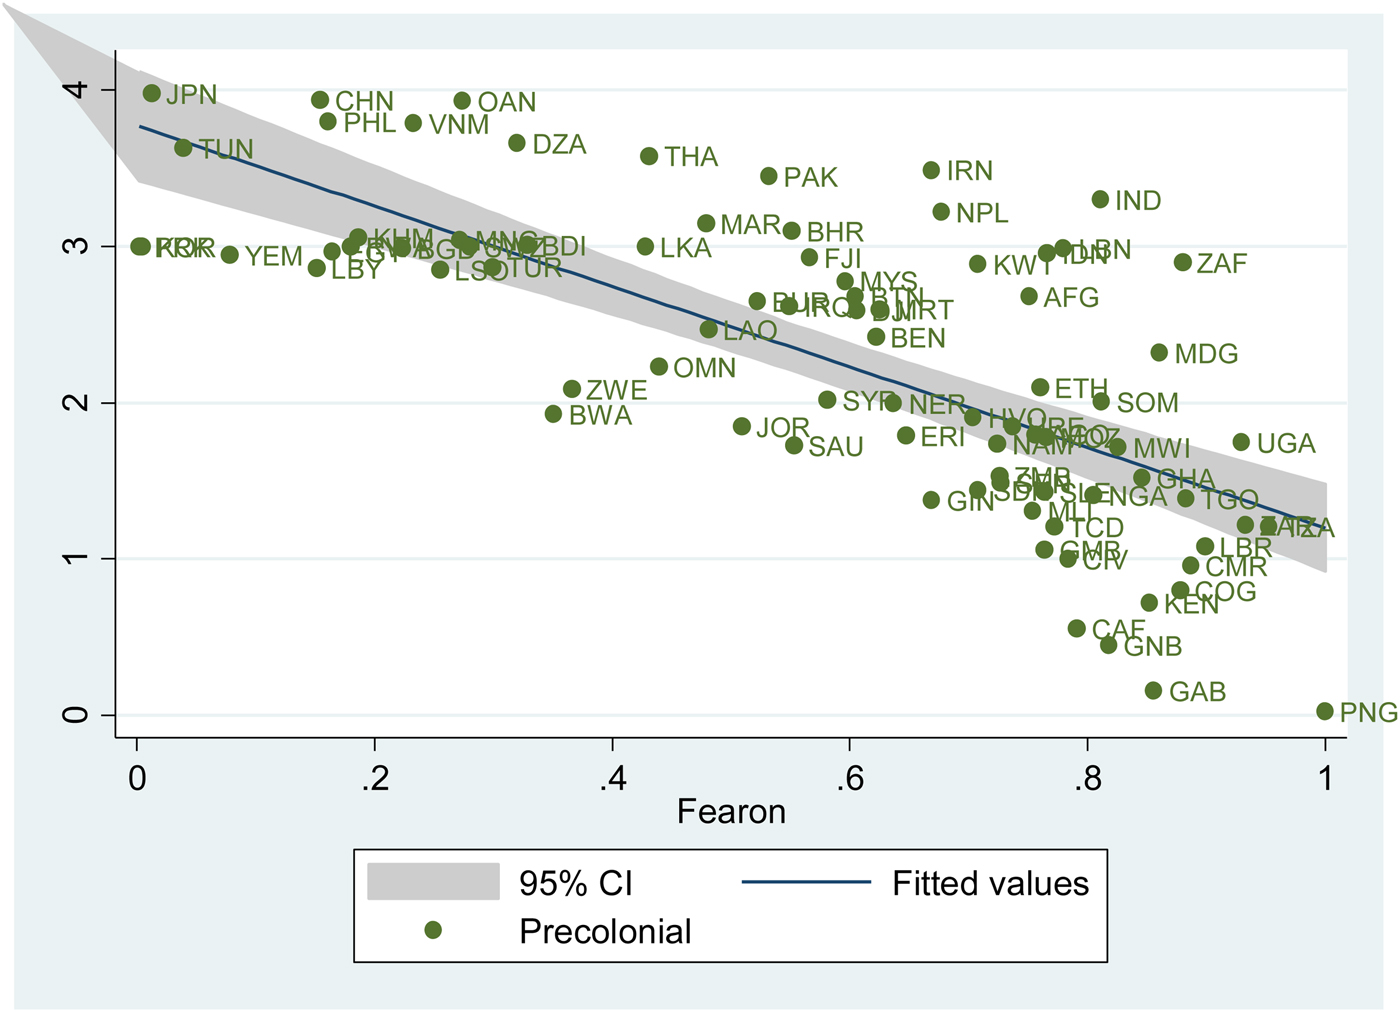
In terms of the relationship between precolonial jurisdictional hierarchy and ethnic fractionalisation, it can also be seen from Table 1 and Figures 2 and 3 that there is a clear negative correlation. The correlation coefficients vary considerably between the different measures of ethnic fractionalisation, ranging from -0.48 with Taylor and Hudson's (Reference Taylor and Hudson1972) index to -0.75 with Fearon's (Reference Fearon2003) index. Indeed, as can be seen from Table 1, Fearon's (Reference Fearon2003) index of ethnic fractionalisation has a higher absolute correlation coefficient with the index of precolonial jurisdictional hierarchy than it does with three of the other ethnic fractionalisation indices: a remarkable result.
Precolonial institutions and Alesina et al (Reference Alesina, Devleeschauwer, Easterly, Kurlat and Wacziarg2003) ethnic fractionalisation measures

Precolonial institutions and Fearon's (Reference Fearon2003) ethnic fractionalisation measures

While the different ethnic fractionalisation indices are highly correlated with one another, they are far from identical, especially given that they are aiming to measure the same phenomenon. Furthermore, these differences have consequences; while all the ethnic fractionation indices are correlated with the index for precolonial jurisdictional hierarchy, there is considerable variation. However, given that all these indices have sound conceptual underpinnings and data sources, choosing one over another would contain an element of arbitrariness. However, using all five indices in the econometric analysis runs the risk of overcomplicating and obscuring the analysis. Principal component analysis (PCA) is employed to condense the information contained in these different ethnic fractionalisation indices into one composite measure while capturing the maximum possible variance from the original indices. Given that the indices have different country coverage, the main drawback is a reduction in the number of observations. Therefore, the main econometric results for each of the individual indices are also contained in Table 1A in the AppendixFootnote 9 and it can be seen that they are broadly consistent with the PCA for the key variables of interest.
Econometric analysis
The relationship is now investigated econometrically where ethnic fractionalisation (from the principal component index PC1) is the dependent variable. It must be stressed that no causal claim is being made in undertaking this econometric analysis. Indeed, the discussion above suggests there is likely to be two-way causality between political institutions and ethnicity, implying that the results are likely to suffer from endogeneity. Nonetheless, it is still useful to investigate whether the relationship between ethnic fractionalisation and precolonial political centralisation holds, once other known determinants and controls are added. Ethnic fractionalisation is chosen as the dependent variable given the chronology of the variables, and also given that there is an established literature on the causes of ethnic fractionalisation.
In terms of the existing literature, Ahlerup and Olsson (Reference Ahlerup and Olsson2012), Ashraf and Galor (Reference Ashraf and Galor2013) and Michalopoulos (Reference Michalopoulos2012) have made important contributions in unearthing some of the key determinants of ethnic fractionalisation. Specifically, Michalopoulos (Reference Michalopoulos2012) highlighted the importance of variations in elevation and climatic suitability of agricultural land, Ahlerup and Olsson (Reference Ahlerup and Olsson2012) highlighted the importance of the duration of continuous human settlement, while Ashraf and Galor (Reference Ashraf and Galor2013) highlighted the importance of expected genetic diversity (based on the distances from East Africa) and the advent of sedentary agriculture (as represented by time since the Neolithic Revolution in each society). These studies also found a number of controls to be significant: absolute latitude, mean elevation, mean climatic suitability of agricultural land, distance from the sea, average precipitation and colonial rule. A data definition table can be found in the Appendix.
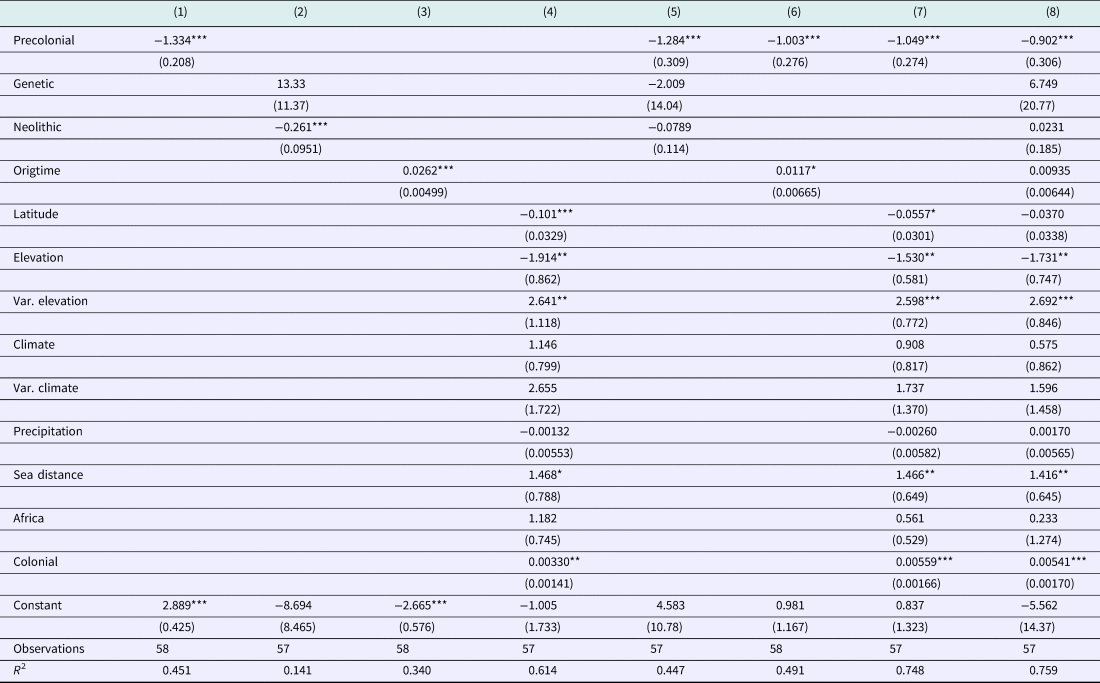
The OLS regression results are presented in Table 2.Footnote 10 It can be seen that precolonial jurisdictional hierarchy has a strong negative relationship with ethnic fractionalisation as hypothesised: the more politically centralised the precolonial institutions were, the lower the current level of ethnic fractionalisation. As can be seen from Column 1, the measure for precolonial jurisdictional hierarchy is negative and significant at the 1% level. It can also be seen that the precolonial jurisdictional hierarchy explains over 45% of the observed variation of the ethnic fractionalisation principal component index. This relationship holds at the 1% level with the inclusion of all the other known determinates/correlates of ethnic fractionalisation as evidenced in Column 8. However, the (absolute) coefficient falls by around one-third when the controls are included, highlighting the importance of the other variables. It can also be seen that some of the geographic variables remain statistically significant with the inclusion of the other variables. These results are robust to the use of the ethnic fractionalisation index used as the dependent variable, with the majority of estimations showing precolonial jurisdictional hierarchy to be highly significant (see Table A4 in the Appendix).
Relationship with ethnic fractionalisation

Robust standard errors in parentheses
* p < 0.10, ** p < 0.05, *** p < 0.01
In summary, the econometric results show a clear statistical relationship between precolonial jurisdictional hierarchy and ethnic fractionalisation. However, two important limitations of the econometric analysis that must be stressed. First, it provides no insight into the causal relationship between these variables, and the results may be biased. Second, there are a small number of observations. While increasing the number of observations for the econometric analysis would be preferable, there are a finite number of postcolonial states and the sample used here approaches the population of postcolonial states that did not experience large population inflows.
5. Precolonial intuitions and ethnic fractionalisation in the South Pacific
The South Pacific countries of Papua New Guinea, Tonga and Samoa were chosen to explore the links between the two measures for three reasons. The first is that despite their proximity to one another and their many similarities, the Melanesian state of Papua New Guinea is recorded as having the most decentralised precolonial institutions of any country, while the Polynesian states of Tonga and Samoa were highly centralised. Second, Papua New Guinea is often cited as the world's most ethnically fractionalised state while Tonga and Samoa are highly homogeneous. Third, Papua New Guinea is recorded as having one of the longest periods of uninterrupted human settlement outside of Africa, while Tonga and Samoa were among some of the last places to be settled. Therefore, it is hoped that the ‘extremeness’ of these contrasts among these neighbours will enable the relationship between ethnic fractionalisation and precolonial institutions to be more readily understood.
Introduction to Papua New Guinea, Tonga and Samoa
Historians suggest that human populations began to settle in New Guinea around 60,000 years ago, making their way south across partial land bridges that have long since disappeared (Matsuda, Reference Matsuda2012). These people settled across New Guinea, including the highlands regions (which were densely populated at the time of European contact) and engaged in rudimentary agriculture and animal husbandry. Much later, the Austronesian peoples are thought to have arrived, around 3,000 to 6,000 years ago. Probably originating from China's southern coast, they made their way to the New Guinea mainland (mainly keeping to coastal areas) via Formosa, the Philippines, Malaysia and Indonesia. From there, they settled in the Bismarck Archipelago around 3,000 to 4,000 years ago. Mixing with the indigenous Papuans they became known as the Lapita people, a name derived from their distinctive patterned earthenware. From the New Guinea Islands, these skilled seafarers made their way further east, colonising the previously unoccupied islands of Tonga and Samoa approximately 3,000 years ago, and their descendants are the Polynesians.Footnote 11
Today, Papua New Guinea is a parliamentary democracy and has an estimated population of almost eight million people. Most people live a rural lifestyle, with many tending semi-subsistence gardens, and it has the third highest rural population level in the world at almost 90%. Income per capita for 2014 is estimated to be $2,240 per year. The Polynesian states of Tonga and Samoa are much smaller than Papua New Guinea, with respective populations of approximately 100,000 and 200,000. Tonga is a constitutional monarchy where King Tupou VI still enjoys considerable executive power, while Samoa is a parliamentary democracy; however both states provide a privileged position for their PCs and aristocracy in their current political institutions. Both countries’ main export income is generated by agricultural exports (especially copra), and have large rural populations employed in agriculture. There are also large expatriate communities living in New Zealand, the United States and Australia and remittances are also an important form of income. Income per capita in 2015 for Tonga and Samoa was approximately double Papua New Guinea's, as are their gross secondary school enrolment rates (World Bank, 2017).
Each state has a complex, but relatively short colonial history. Following an agreement between Britain and Germany to partition the eastern half of the island of New Guinea in 1884, both powers set up colonial administrations. Britain declared the southern part a protectorate and named it British New Guinea, while Germany annexed the northern part and named it Kaiser-Wilhelmsland. In 1906, the Australian Government assumed full control of British New Guinea and renamed it Papua and with the outbreak of the First World War German New Guinea also fell under Australian control. Apart from a three-year partial occupation by the Japanese army during the Second World War, the two territories remained under Australian control until independence in 1975. Following competing claims of ownership by Britain, Germany, and the United States of the Samoan islands and a foreign-backed civil war, (Western) Samoa was partitioned and colonised by Germany in 1900. However, following the outbreak of the First World War, it fell under control of New Zealand until independence in 1962. As part of the same agreement between the colonial powers that saw Samoa fall under German control, Tonga signed a Treaty of Friendship with Britain. This treaty gave Britain control over its foreign relations, but internal sovereignty was largely maintained. In 1970 Tonga gained full independence from the United Kingdom. It is a great source of Tongan national pride that they have never been ‘colonised’ like many of their Pacific neighbours.
Precolonial institutions
Murdock's (Reference Murdock1969) Ethnographic Atlas records 49 cultural units in what now makes up Papua New Guinea. Only three of these cultural units are recorded as having one level of jurisdiction above the local level (e.g. petty chiefdoms), and therefore given a score of 1. The remaining 46 cultural units are recorded as having none, the lowest level of jurisdictional hierarchy coded, meaning that clan or family leaders (or ‘big men’ chosen for their personal abilities) shared power within each village (or collection of hamlets) rather than a designated chief, and therefore given a score of zero. It is for this reason that Papua New Guinea is ranked as the most jurisdictionally decentralised country in Müller et al.’s (Reference Müller, Kock Marti, Seiler Schiedt and Arpagaus2000) dataset of postcolonial states. This assessment accords with the country-specific literature of Papua New Guinea. For instance, Narokobi (Reference Narokobi1980: 28) considers that ‘small self-contained communities’ are the distinguishing factor of precolonial Papua New Guinea.Footnote 12 In terms of leadership, May (Reference May2004: 204) concludes that:
Papua New Guinean societies (and most of Melanesia generally) were characterised as ‘acephalous’, lacking the formal, hereditary chiefly structures which typified neighbouring Polynesia and other small-scale traditional societies in much of Africa and Asia. Leadership was seen to be localised, and normally determined by competition on the basis of skills in warfare, oratory, accumulating wealth and arranging exchanges, or in the possession of special knowledge or personal qualities. Exceptions were noted, mostly amongst Austronesian-speaking coastal societies but these were regarded as deviations from the norm.
In contrast, both Tonga and Samoa were characterised by layered hereditary chiefly structures. Each is considered a unique cultural unit by Murdock (Reference Murdock1969) and both countries are recorded as having two levels of jurisdiction above the local level (i.e. paramount chiefdoms) in the Ethnographic Atlas. The early European explorers recorded the existence of powerful PCs, and there is archaeological evidence suggesting that strong centralised power was in existence for some time well before European contact. Indeed Fischer (Reference Fischer2002: 61) states that:
The large societies of Tonga and Hawai'i experienced absolute rulers who commanded thousands of warriors in a highly stratified and complex system held together by ritual, taboo, and protocol. With severe punishment for infringement, these Polynesian ‘police states’ maintained social cohesion through fear and internal cohesion, leaving only a small hereditary elite, as in Europe, exempt from most injunctions and restrictions.
In relation to Tonga, Bott (Reference Bott1981: 12) notes that ‘[a]ccording to legend and oral history, the islands have always had a centralised political structure headed by a paramount chief or king, the Tu'i Tonga’.Footnote 13 However, verification of this in a non-literate period is difficult. What is known with some certainty is that over a number of decades, and series of battles with other PCs, George Tupou became the undisputed leader of Tonga in 1851 (His Majesty King George Tupou I) and established a dynasty that still rules today. While this consolidation of power occurred before the Treaty of Friendship with Britain, it was well after the arrival (and influence) of the European colonial powers. Indeed King George, a baptised Christian, took his name from the line of monarchs that ruled England from 1714 to 1830, and this highlights the difficulties in categorising precolonial institutions. In summary, however, there seems little doubt that the precolonial institutions of Papua New Guinea were highly decentralised while in the Polynesian states of Tonga and Samoa they were highly centralised.
Ethnic fractionalisation
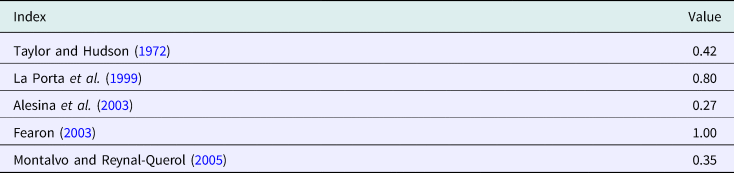
In terms of ethnic fractionalisation the indices record strikingly different values for Papua New Guinea. As can be seen from Table 3 below, the level of ethnic fractionalisation attributed to Papua New Guinea ranges from 0.27 to 1 for these five indices.
Fractionalisation measures for Papua New Guinea

Curiously, while each of the authors of the indices had their own well defined rules for calculating ethnic fractionalisation, in the case of Papua New Guinea, two of the five broke them. Fearon (Reference Fearon2003) made an exception for Papua New Guinea when he gave it a value of 1 (representing perfect fractionalisation). Normally, he only coded ethnic groups that made up more than 1% of a country's population; however with his assessment of hundreds of distinct ethnic groups to be found in Papua New Guinea, his mechanical calculation of fractionalisation would have produced an anomalous value. The authors of the Atlas Narodov Mira (used by Taylor and Hudson, Reference Taylor and Hudson1972) also made an exception for Papua New Guinea, but this time leading to a lower value of fractionalisation. They broke with their normal practice of defining ethnicity in terms of language groups and chose to compute Papua New Guinea's fractionalisation index by ‘race’, leading them to produce an otherwise much lower fractionalisation measure of 0.42.Footnote 14 Of the three other measures, La Porta et al.’s (Reference La Porta, Lopez-de-Silanes, Shleifer and Vishny1999) composite index (derived from Easterly and Levine, Reference Easterly and Levine1997) produced a high figure of 0.80; while Montalvo and Reynal-Querol (Reference Montalvo and Reynal-Querol2005), using disaggregated data primarily sourced from the World Christian Encyclopedia, produced a relatively low figure of 0.35; while Alesina et al. (Reference Alesina, Devleeschauwer, Easterly, Kurlat and Wacziarg2003), who relied on the ‘Papuan’, ‘Melanesian’, and ‘Other’ racial distinctions sourced from the Encyclopaedia Britannica, produced the lowest ethnic fractionalisation value for Papua New Guinea at 0.27.
As a group, the authors of the indices clearly struggled to adequately quantify the degree of ethnic fractionalisation found in Papua New Guinea. While different data sources are bound to produce different results, as will different definitions of ethnicity, it is suggested that this level of divergence must be derived from either a measurement error or the concept of ethnicity not being a useful one for Papua New Guinea. Therefore, some discussion is necessary to determine which measure best describes the level of ethnic fractionalisation found in Papua New Guinea. In short, is Papua New Guinea relatively ethnically homogeneous, the most ethnically fractionalised country on earth, or somewhere in between?
According to Lewis et al.’s (Reference Lewis, Simons and Fennig2014) Ethnologue data, Papua New Guinea is the world's most linguistically diverse country. Their linguistic fractionalisation index ranks Papua New Guinea as first, with a score of 0.988, followed by Vanuatu (0.973), Cameroon (0.972), and the Solomon Islands (0.968) (seeing Melanesian states fill three of the top four places). They record 838 living languages in Papua New Guinea, which is close to 10% of the world's total. These languages are categorised into two different very distinct language groups: Austronesian and Non-Austronesian. There are approximately 200 Austronesian (or Melanesian) languages and 600 non-Austronesian (or different Papuan language families). Of the 232 states for which Lewis et al. (Reference Lewis, Simons and Fennig2014) record data, those with the next highest number of living languages are Indonesia (707) (which includes the western half of the island of New Guinea), Nigeria (529), and India (454); all with populations that far exceed that of Papua New Guinea.
Importantly, the documented 800-plus living languages are categorised as languages, not dialects. In making the distinction between a language and a dialect, Lewis et al. (Reference Lewis, Simons and Fennig2014) use ISO language identification criteria that include both linguistic and ethnolinguistic identity markers. In this sense their language classifications already account for notions of ethnicity, however they fully acknowledge that separating languages from dialects requires a degree of judgement. While one may be forgiven for thinking that Lewis et al. (Reference Lewis, Simons and Fennig2014) simply erred on the side of classifying dialects as languages in this particular case, it is worth noting that in Papua New Guinea it is not unusual for two communities next to each other to speak languages from completely separate language families (e.g. an Austronesian language and a Papuan language).Footnote 15 This is an extraordinary result, given that approximately 400 million people across the world speak languages within the Austronesian family spanning large parts of the Indian and the Pacific oceans, including those who speak the languages of Malay, Filipino and Malagasy.Footnote 16
Language is not always a useful measure for determining ethnicity, especially in North and South America where different ethnic groups often share a common language (see Alesina et al., Reference Alesina, Devleeschauwer, Easterly, Kurlat and Wacziarg2003). However, in Papua New Guinea's case language is widely considered to be the key ethnic marker; Nanau (Reference Nanau2011: 34) concludes that ‘[t]he principal point of reference and identification by Melanesians would be in relation to the language spoken’. Indeed, in Papua New Guinea, group loyalty is quite literally defined in terms of language, and labelled the wantok system. Wantok is a Melanesian Pisin term meaning ‘one talk’ (or the same language). The language they refer to is one's local language (language of place), while Pisin and Motu (and sometimes English) are mostly spoken when conversing in mixed groups. The importance of the wantok system to Papua New Guinean social life cannot be overstated. It requires one's loyalties to be directed toward one's kinship network and language group over other potential loyalties.
Further evidence of Papua New Guinea's extreme level of ethnic fractionalisation is provided by Levine (1997: 479), who concludes that ‘if ethnic communities are understood to be groups possessing a distinctive language, custom and memories – traits that give members a sense of unity and cause them to distinguish themselves (and be distinguished from others) – then PNG may have more than one thousand such ethnic groups within its borders’. Reilly (Reference Reilly2008: 14) also concludes, even if conservative figures are used in measuring ethnolinguistic groups (e.g. tribes – aligned or related clan groupings), ‘we are dealing with a level of fragmentation that makes diverse societies elsewhere look relatively homogeneous by comparison’. Therefore, based on the preceding discussion, it is concluded that Papua New Guinea contains hundreds of distinct ethnic groups, which is a remarkable feat for a country with a population of less than 10 million people. In short, Papua New Guinea is extremely ethnically fractionalised, as are the other Melanesian states.
It is noteworthy that the ethnic fractionalisation value attached to Papua New Guinea and other Melanesian countries has an important effect on the correlation between measures for ethnic fractionalisation themselves and with the measure of precolonial jurisdictional hierarchy. This can be seen by comparing the bottom left hand corners of Figure 2 and Figure 3. In Figure 2, which plots Alesina et al.’s (Reference Alesina, Devleeschauwer, Easterly, Kurlat and Wacziarg2003) measure for ethnic fractionalisation with the measure for precolonial institutions, there are three prominent outliers – Vanuatu, Solomon Islands and Papua New Guinea (all three countries are in Melanesia).Footnote 17 In Figure 3, which plots Fearon's (Reference Fearon2003) ethnic fractionalisation data, these outliers are not present. While this is partly due to Fearon (Reference Fearon2003) not calculating measures for the Solomon Islands and Vanuatu it is also due to the vastly different value he gives to Papua New Guinea. Indeed, in Figure 3 (which plots Fearon's Reference Fearon2003 data), Papua New Guinea is both the most ethnically fractionalised society and the one with the lowest weighted level of jurisdictional hierarchy beyond the local community in precolonial times.
In contrast to Papua New Guinea, Tonga and Samoa are ‘among the most ethnically homogeneous societies in the world today, being composed of one dominant cultural group and usually speaking one language’ (Reilly, Reference Reilly2004: 480). This is confirmed by the ethnic fractionalisation indices that include these Polynesian states and there is little disagreement: Taylor and Hudson (Reference Taylor and Hudson1972) produced an extremely low figure of 0.017 for Samoa, Alesina et al. (Reference Alesina, Devleeschauwer, Easterly, Kurlat and Wacziarg2003) also produced a figure of 0.0869 for Tonga, while Montalvo and Reynal-Querol (Reference Montalvo and Reynal-Querol2005) produced a figure of 0.199 for Samoa and 0.034 for Tonga. This is also borne out in both countries’ folklore and mythology. For instance, according to Samoan mythology, all Samoans share a common ancestor named Tagaloa (Tuvale, Reference Tuvale2006). While it is true that Tonga and Samoa are much smaller than Papua New Guinea, the average size of Papua New Guinean language (ethnic) group is still much smaller and on average well under 10,000 people. Indeed, Bougainville Island (which is part of Papua New Guinea) has a population of approximately 200,000 people and 22 distinct languages (Lewis et al., Reference Lewis, Simons and Fennig2014). However in its case, it should be noted that it does have PCs that seem to predate European colonisation (Larcom, Reference Larcom2017), highlighting gaps in Murdock's Atlas and suggesting the relationship between political centralisation and ethnicity is a complex one. In summary, ‘Melanesia is characterized foremost by its enormous ethnic, social and cultural diversity’, while ‘Polynesian society was [and is] characterized foremost by its remarkable, ethnic, linguistic and cultural homogeneity’ (Fischer, Reference Fischer2002: 24–32).
The South Pacific examples have provided evidence for the fundamental relationship between precolonial institutions and current levels of ethnic fractionalisation. Precolonial Papua New Guinean societies had perhaps the most decentralised precolonial political institutions of anywhere in the world and Papua New Guinea is now widely considered to be the most ethnically fractionalised country in existence; conversely the Polynesian states of Tonga and Samoa had highly centralised precolonial institutions and they are highly homogeneous. This conclusion is also reached by Nanau (Reference Nanau2011: 35), who suggests that the level of ethnic diversity found in Melanesia is ‘testament to the fragmentation and relatively small size of Melanesian societies in pre-contact era’; while Reilly (Reference Reilly2001: 170) – partially quoting Hegarty (Reference Hegarty, Azeem, Good and Mortimer1979) – reaches a similar conclusion: ‘With no common history of statehood, its people are fragmented into hundreds of often mutually antipathetic ethnic groupings’.Footnote 18 Reilly (Reference Reilly2004) notes that the postcolonial states of Tonga and Samoa are built around their precolonial institutions and they continue to promote a national identify and reinforce notions of ethnic homogeneity. He also goes on to highlight the stark differences in the economic development outcomes of the highly homogeneous and centralised Polynesian societies with their highly fractionalised Melanesian neighbours.
6. Conclusion
This paper has aimed to highlight a link between the most commonly used measure for precolonial institutions (jurisdictional hierarchy) and measures of ethnic fractionalisation. By definition, jurisdictional hierarchy is capturing precolonial political centralisation (or a lack of it). If this measure were inverted, it would measure precolonial political decentralisation, or put another way, precolonial political fractionalisation. Indeed, the lowest unit of Murdock's (Reference Murdock1969) hierarchy is defined as ‘[n]o political authority beyond community’, which would also seem to fit as a good definition for extreme political fractionalisation.
If there is a fundamental relationship between precolonial notions of ethnicity and precolonial political structure, and if these notions of ethnicity persist to the postcolonial period, there should be a strong negative relationship between precolonial jurisdictional hierarchy and more recent measures of ethnic fractionalisation. This is what this empirical investigation has found; precolonial jurisdictional hierarchy has a highly significant statistical relationship with recent measures of ethnic fractionalisation, where countries with more fractionalised precolonial political institutions have higher levels of postcolonial ethnic fractionalisation. Indeed, one well known measure of ethnic fractionalisation has a closer statistical relationship with precolonial institutions than with some other measures of ethnic fractionalisation. This relationship was also found in the South Pacific case study, which brought some concreteness to the relationship, but also highlighted its complexity. It is suggested that the closeness of the relationship is primarily driven by both measures essentially capturing ‘fractionalisation’, where one is capturing the political plane while the other is capturing the social manifestation. In this sense, one can be used as a proxy for the other – albeit an imperfect one. It is also speculated that if there is a causal relationship between precolonial political and ethnic fractionalisation, it is likely to be in both directions, however, due to data limitations, such a proposition cannot be tested.
Given the theoretical and empirical link between these two measures, and that they both have a highly significant relationship to current levels of economic development, it is worth pondering the importance of highlighting their link to one another. While speculative, it does raise the possibility that there is an underlying (unobserved and perhaps unobservable) variable common to both measures that drives their close statistical relationship with current levels of economic development. For clues on what this could be, it is worth reminding ourselves of the transmission mechanisms advanced by both sets of literature. When it is boiled down, they both highlight the importance of sub-groups operating in a broader context, where there are ‘insiders and outsiders’ and ‘us and them’ preferences, that can impede the functioning of state institutions (in particular, public good provision) and/or inhibit the gains from market exchange due to mistrust among individuals from different groups. To take this further, these different groups are also likely to have their own sets of institutions, and while they may be informal they can nonetheless be powerful. In the case of highly fractionalised societies, whether measured through precolonial political structures or current levels of ethnic fractionalisation, these non-state institutions may be far less compatible with state institutions, generating institutional dissonance.
Institutional dissonance can take many forms. For instance, Leeson (Reference Leeson2005) provides examples where colonially imposed institutions impeded precolonial signalling mechanisms that were once effective in facilitating trade between people of different groups. Larcom (Reference Larcom2015, Reference Larcom2017) has provided examples of where non-state institutions in a highly fractionalised society undermine the functioning of state institutions, and where state institutions undermine the functioning of non-state institutions – leading to dysfunctional state and non-state institutions. Easterly (Reference Easterly2001) has also shown that the existence of strong state institutions largely eliminates the negative relationship between ethnic fractionalisation and economic wellbeing. One way of interpreting Easterly's (Reference Easterly2001) results is that these states have been able to eliminate or ameliorate institutional dissonance – as evidenced by having strong and functional state institutions. At the very least, it is hoped that this paper will encourage further theoretical and empirical analysis focused at delving deeper into the link between these two measures (and their link to development) to better understand what they are actually measuring.
Acknowledgements
I am grateful to Abhishek Chakravarty, Jason Cooper, Colin Filer, Kate Johnston Ata'Ata, Caterina Gennaioli, Stelios Michalopoulos, Hanspeter Müller, Laurence Smith, Colin Poulton, Benjamin Reilly, Tim Willems for helpful comments and suggestions. I would also like to thank Francesca Di Nuzzo for excellent research assistance. All errors and omissions remain my own. I acknowledge funding support from the British Academy.