Introduction
Typical material sizes in current integrated circuits are at nanometer dimensions. As the material size approaches the dominant microstructural length scale, material response could be scale-dependent and different from that of bulk materials [Reference Arzt1, Reference Hahn and Meyers2]. In addition, processing plays a strong role on the microstructure and in dominant deformation mechanisms. For example, nanocrystalline thin films can be elastically softer or exhibit higher yield strength than bulk materials due to the smaller grain sizes [Reference Arzt1, Reference Chokshi, Rosen, Karch and Gleiter3, Reference Haque and Saif4]. The observed differences in the mechanical behavior of nanocrystalline films relative to the bulk materials have been explained in terms of the underlying microstructural features [Reference Budiansky and O’Connell5, Reference Huang6, Reference Nan, Li, Cai and Tong7, Reference Phillpot, Wolf and Gleiter8, Reference Zhou9, Reference Okolo10]. Given the strong interplay between the microstructure, processing, and material behavior, there is a need for an easy-to-replicate test method that can efficiently characterize mechanical behavior of nanomaterials.
In our study, we focus on developing a test technique for coatings with thicknesses that are relevant to current semiconductor devices. Here, we characterize the elastic modulus and residual strain of films with thickness less than 100 nm (ultrathin films). Our design is further motivated by the need of a test technique in the semiconductor industry for ultrathin films that satisfy the following conditions: (i) does not require any external mechanical test setup for loading the sample, (ii) can be seamlessly implemented in a clean room for testing ultrathin films immediately after fabrication on a silicon substrate, (iii) is applicable to a wide range of materials, and (iv) uses easy-to-replicate fabrication and metrology techniques in the clean room environment. Currently, elastic modulus is measured using techniques such as resonance frequency testing [Reference Li11], nanoindentation [Reference Suresh, Nieh and Choi12], bulge testing [Reference Vlassak and Nix13], tensile testing [Reference Haque and Saif4, Reference Sim, Park, Uchic, Shade, Lee and Vlassak14], and X-ray methods [Reference Chang, Yu and Huang15]. These techniques typically require sophisticated test setups that are not easy to replicate and can be challenging to apply to ultrathin films due to test sensitivity limits, sample manipulation and loading challenges, and substrate interactions.
We propose to use residual stress–driven structures, thereby eliminating the need for an external sample loading setup [Reference Coulombier, Guisbiers, Colla, Vayrette, Raskin and Pardoen16, Reference Favache17]. The test structures are bilayer cantilevers comprising a test film with a well-characterized stress overlayer. When released from the underlying substrate, difference in the residual stresses in the two layers causes the freestanding cantilever to curl. The resulting curvature can be related to stiffness and residual stress of the test film, since properties of the stress overlayer are known a priori. We use SU-8, a standard negative photoresist, as the stress overlayer. We demonstrate the technique for 75 nm thick sputter-deposited films. In addition, we measure Young’s modulus of an ultrathin film from the freestanding bilayer cantilevers using Weihs’ method [Reference Weihs, Hong, Bravman and Nix18]. In this method, a nanoindenter is used to measure the force–deflection response of a test film/SU-8 bilayer cantilever along the length of the cantilever, allowing calculation of Young’s modulus of the test film.
The proposed residual stress–driven method differs from the other reported studies in the following aspects. (1) The reported studies typically require special processing before the test film is deposited on the substrate, which is not permissible in a typical semiconductor production process. Our proposed technique with the choice of SU-8 and clean room–compatible fabrication and simple metrology processes allows for seamless integration of the test structures into the production line. (2) The technique is applicable to test films with both tensile and compressive residual stresses. (3) SU-8, the stress overlayer, is chemically inert and has a high etch selectivity to most etchants. This allows a broad range of materials to be tested and a flexibility in fabrication protocols.
Results
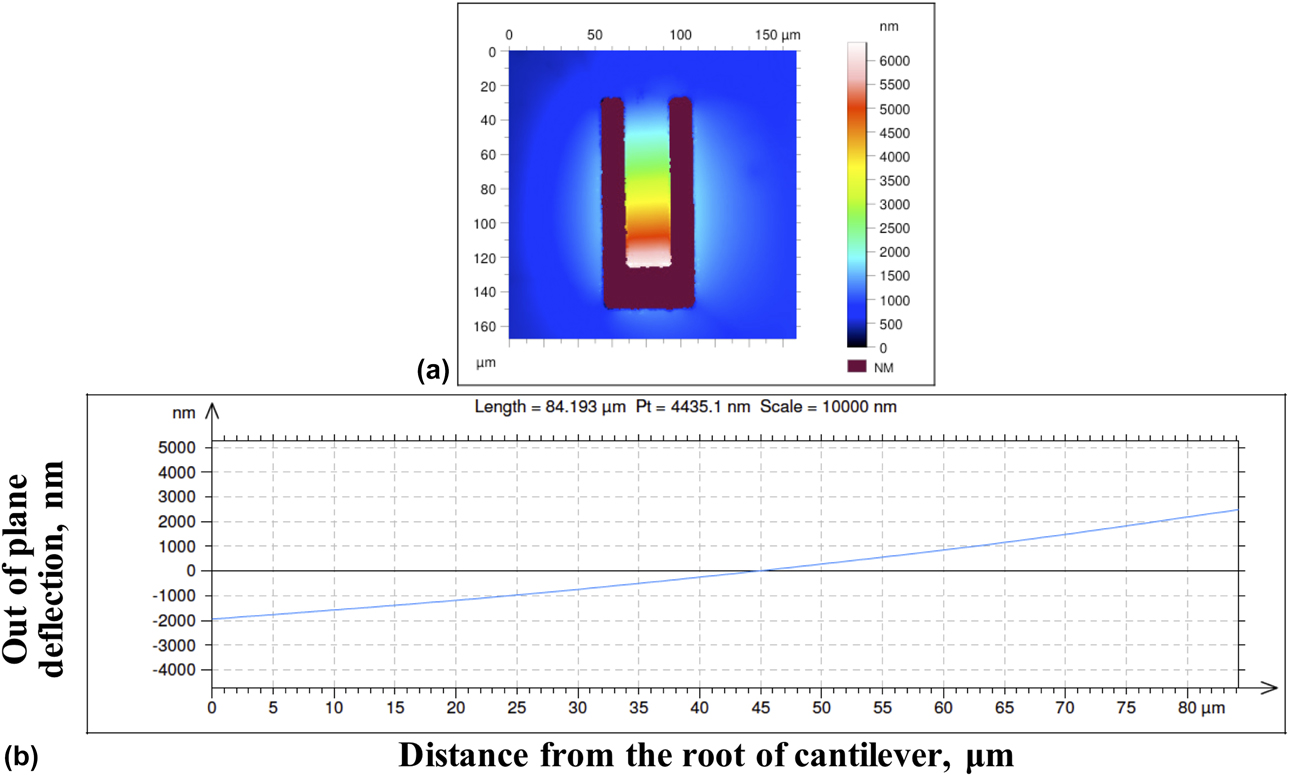
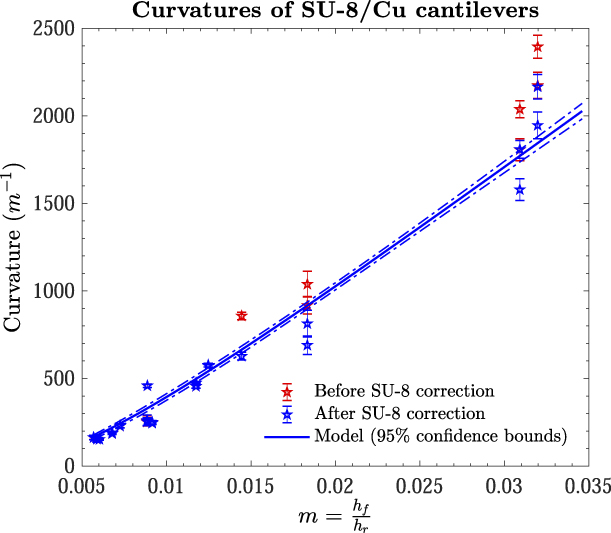
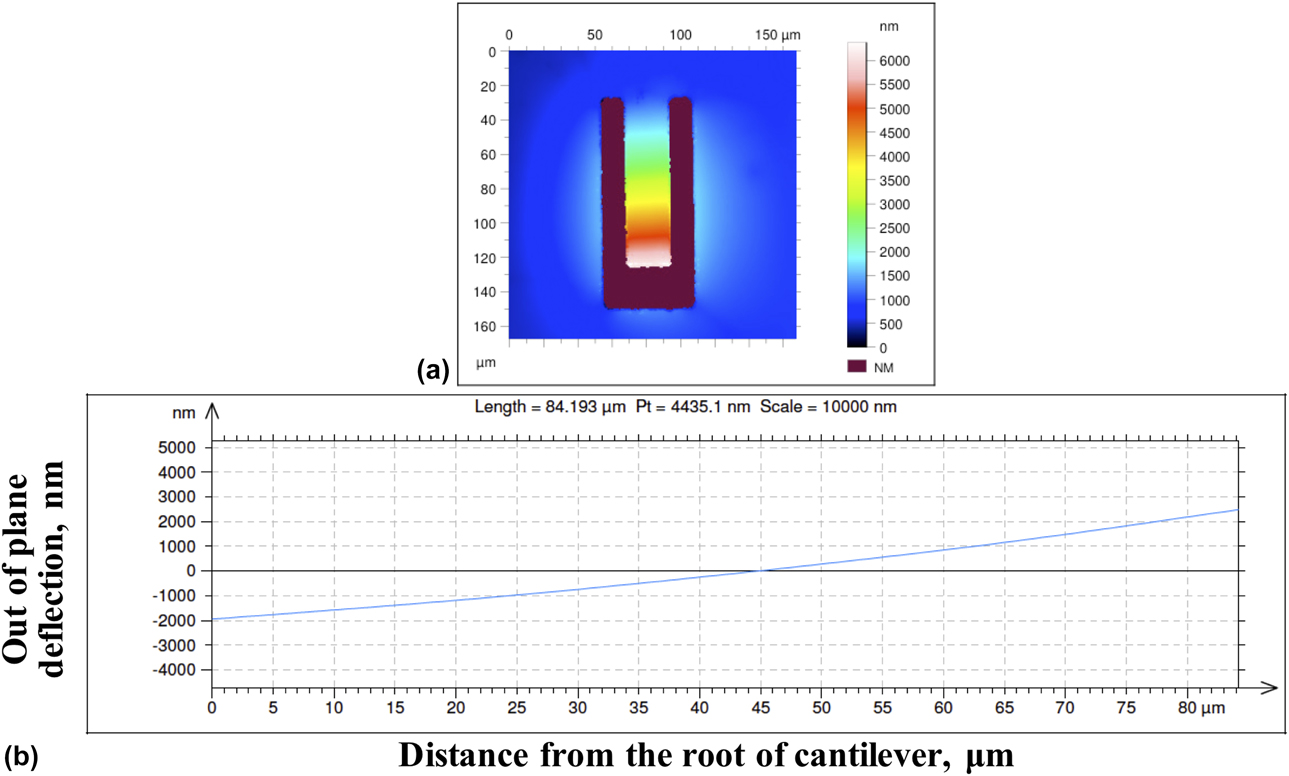
When the SU-8/Cu cantilevers are released from the Si substrate, they show a distinct and measurable out-of-plane deflection and curvature. Figure 1(a) shows a typical contour map of the deflection as measured by a white light interferometry profiler, and Fig. 1(b) shows the corresponding deflection along the centerline of the beam. It is evident from Fig. 1(b) that the deflection of the beam is a combination of a rigid body rotation around the root of the beam and a bending deformation as a result of different residual stresses in the test film and SU-8 layers. In this study, we used the deflection and curvature measured from the white light profiler but did not model them separately. The measured bilayer beam curvatures (κ) are shown in Fig. 2 as a function of the thickness ratio (m). The plot shows the curvatures before and after correcting for the SU-8 single-layer cantilevers curvatures from section “Reference material characterization—SU-8”. It is evident that the correction is quite small and only important when the SU-8 is relatively thin (<3 μm).
(a) Contour plot of the deflection of a freestanding bilayer cantilever. Thickness of the SU-8 is 9 μm. The gray arrow indicates the location along the structure where the deflection profile is measured in (b). The deflection is negligible in the freestanding undercut region surrounding the root of the cantilever.
Mean and standard deviations of the curvatures of the bilayer Cu/SU-8 cantilevers as a function of the thickness ratio of the test film and SU-8 (m). The curvatures of the SU-8/Cu bilayer cantilevers and the copper film are shown with red and blue data, respectively. The curvatures of the copper film are obtained by correcting for the curvatures of the SU-8 single-layer cantilevers from Fig. 3(b). The curvatures from the copper film are used to fit the model in Eq. (4) (blue line), and the bounds of the curvatures are included as dashed blue lines. The 2 μm SU-8/Cu samples show a larger measurement error (9%) compared to the thicker SU-8 structures. The model fit shows good agreement with the data and is dominated by 218 data points from the thicker SU-8/Cu structures ranging from 4 to 15 μm SU-8 thickness (m < 0.02) compared to the 2 μm SU-8/Cu (m > 0.3), which have 47 data points.
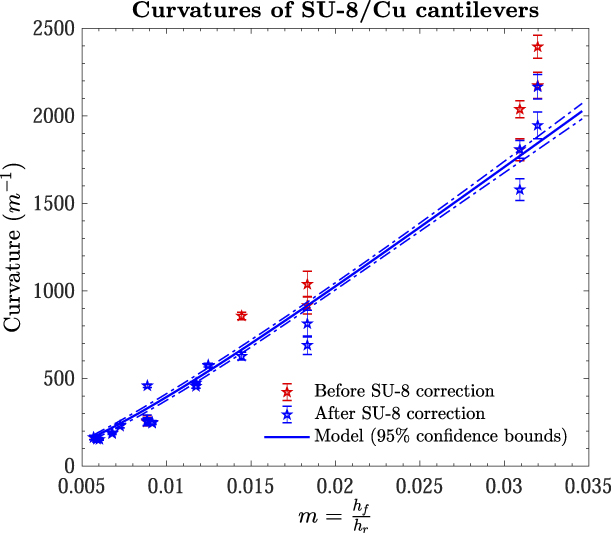
Describing the experimental data with Eq. (4) in Fig. 2, yields are λ = 27.7 ± 2.4 and Δε = εr0 − εf0 = −(3.70 ± 0.09) × 10−3. Using the measured SU-8 properties from section “Reference material characterization—SU-8” ( ${\bar{E}_{\rm{r}}}$ and εr0), we measure a biaxial modulus
 $\left( {{{\bar{E}}_{\rm{f}}}} \right)$ of 211 ± 19 GPa and a residual strain (εf0) of (7.05 ± 0.22) × 10−3 for the 75 nm thick Cu film. The residual strain in copper agrees well (within 4%) with that measured using alternate residual-stress driven structures for the same coatings [Reference Cuddalorepatta, Li, Pantuso and Vlassak19].
In this analysis, there are 218 curvature measurements of the bilayer cantilevers with SU-8 thicknesses ranging from 4 to 15 μm and 47 measurements for the 2 μm SU-8 thickness. The thinnest 2 μm SU-8 samples show a larger curvature measurement error (9%). The error at this SU-8 thickness is a systematic difference due to different widths of the beams. The mechanics analysis shows that this should not be the case, and the thicker SU-8 samples also show very small differences in curvatures at different widths for a constant thickness. The 2 μm SU-8 samples are more sensitive to variations in lithography. However, the number of measurements from the thicker SU-8 bilayer samples (4–15 μm) is larger and spread across a larger range of SU-8 thicknesses. These data dominate the curve fit for determining the biaxial modulus and residual strain, and there is good agreement between the model and fit. The measured residual strains of Cu and SU-8 in this study are in close agreement with those measured from the same coatings using additional residual stress–driven structures [Reference Cuddalorepatta, Li, Pantuso and Vlassak19, Reference Cuddalorepatta, van Rees, Li, Pantuso, Mahadevan and Vlassak20].
In the current study, Poisson’s ratio of the SU-8 coatings was not measured. Studies report Poisson’s ratios vary from 0.22 to 0.3 [Reference Lorenz, Despont, Fahrni, LaBianca, Renaud and Vettiger21, Reference Hopcroft, Kramer, Kim, Takashima, Higo, Moore and Brugger22], which results in an uncertainty of approximately ±3% in the biaxial modulus of SU-8. The same uncertainty applies to the measured value of the biaxial modulus of copper, as the biaxial modulus of copper scales with that of SU-8. Correcting for the curvatures’ contribution from the single-layer SU-8 cantilevers to that measured in bilayer cantilevers changes the λ value and the biaxial modulus of copper by less than 2%.
Additional experiments were conducted using a nanoindenter to measure the force–deflection response of the freestanding bilayer cantilevers (Supplementary material SI). Using this technique, we measure a mean Young’s modulus of 115 GPa, with an error larger than 10%. This value is in agreement with that measured from the same copper coatings using additional residual driven–structures [Reference Cuddalorepatta, Li, Pantuso and Vlassak19].
Discussion
The copper films in this study have a columnar grain structure with a strong 〈111〉 fiber texture [Reference Sim, Park, Uchic, Shade, Lee and Vlassak14]. The in-plane biaxial modulus  $\left( {\bar{E}} \right)$ and Young’s modulus (E) of a film with an ideal 〈111〉 fiber texture is given by [Reference Huang6, Reference Landolt and Börnstein23]:
 $${\bar{E}_{\left\langle {111} \right\rangle }} = {6 \over {4{S_{11}} + 8{S_{12}} + {S_{44}}}},\quad {E_{\left\langle {111} \right\rangle }} = {4 \over {2{S_{11}} + 2{S_{12}} + {S_{44}}}}\quad ,$$
where the single crystal constants (S 11, S 12, and S 44) = (150, −63, and 133) × 10−13 Pa−1, respectively [Reference Landolt and Börnstein23]. The theoretical biaxial and Young’s moduli are 261 and 130 GPa, respectively. The measured biaxial modulus of 211 GPa is 19% softer than the theoretical value. This result is consistent with a 20% modulus softening that was reported when a microstructure transitions from a coarse-grained structure to a nanocrystalline grain structure [Reference Zhou9, Reference Schiotz, Di Tolla and Jacobsen24]. Here, we explore possible factors such as the grain structure, anisotropy of copper, texture distribution, and voids to explain the observed softening.
In nanocrystalline materials, the volume fraction of grain boundaries relative to the grain interior plays an important role [Reference Huang6]. Studies indicate that the grain boundary stiffness is approximately 25% of that of the grain interior [Reference Nan, Li, Cai and Tong7, Reference Phillpot, Wolf and Gleiter8, Reference Zhou9]. The stiffness (E eff) of a film with nanocrystalline grains is [Reference Huang6]
 $${{3d} \over {4{E_{{\rm{eff}}}}}} = {{{{3d} \over 4} - {{2\delta } \over {\sqrt 3 }}} \over {E_{{\rm{eff}}}^*}} + {{{{2\delta } \over {\sqrt 3 }}} \over {{E^{{\rm{gb}}}}}},\quad E_{{\rm{eff}}}^* = {2 \over {\sqrt 3 }}{{\delta {E^{{\rm{gb}}}} + \left( {{{\sqrt 3 d} \over 2} - \delta } \right){E^{{\rm{grain}}}}} \over d}\quad ,$$
where E gb and E grain are the Young’s moduli of the grain boundary and the grain interior, respectively and δ and d represent the grain boundary width and grain size, respectively. Using the theoretical stiffness of the 〈111〉 texture (261 GPa) for the grain stiffness, a copper grain size of 65 nm and a grain boundary width of 0.5 nm [Reference Prokoshkina and Esin25, Reference Sim, Choi, Lee, Oh and Vlassak26], the decrease in stiffness as a result of the grain boundary compliance can be at most 4%.
Elastic anisotropy of copper may be another reason for the stiffness deficit. The limits of the biaxial modulus of copper are 115 GPa for films with a perfect 〈100〉 texture and 261 GPa for films with a perfect 〈111〉 texture [Reference Huang6]. The volume fraction of the 〈111〉 texture component in 220 μm thick copper films under identical deposition conditions is approximately 92% [Reference Sim, Park, Uchic, Shade, Lee and Vlassak14]. Assuming the same volume fraction of 〈111〉 texture in our coatings, and the balance of the texture is the softest component, i.e., 〈100〉, the rule of mixtures yields a drop in stiffness of about 5% and 9% respectively for isostrain and isostress conditions, respectively.
The reduction in stiffness due to the film porosity is estimated by assuming that the material has a random distribution of noninteracting spherical voids with a volume fraction f. The effective bulk and shear moduli of such a configuration are given by Eshelby’s formulation [Eq. (3)] [Reference Eshelby27, Reference Huang and Spaepen28]. For copper which has a bulk modulus K and shear modulus μ of 137 and 48 GPa [Reference Ledbetter and Naimon29], respectively, we find that a 20% softening of modulus (E eff = 0.8E 〈111〉) is achieved when the void fraction f is 0.12. Optical micrographs of our copper films, however, do not show such a high porosity.
 $${E_{{\rm{eff}}}} = {{9{K_{{\rm{eff}}}}} \over {1 + {{3{K_{{\rm{eff}}}}} \over {{\mu _{{\rm{eff}}}}}}}}\quad ,$$
 $${K_{{\rm{eff}}}} = {K \over {1 + Af}},\;{\mu _{{\rm{eff}}}} = {\mu \over {1 + Bf}},\;A = {{1 + 3K} \over {4\mu }},\;B = {{3K + 4\mu } \over {9K + 8\mu }}\quad .$$
It is evident from these calculations that neither grain size nor crystallographic texture can explain the measured softening fully. It is likely that the remaining deficit is caused by other sources. One of these could be a low percentage of microcracks and flaws in the film; however, it would be difficult to detect these defects by electron microscopy because of their low concentration.
Scope and implementation of proposed method
We show that residual stress–driven bilayer cantilevers, with SU-8 as the stress overlayer, can be used to measure the stiffness and residual stress of ultrathin films (75 nm thick). The method is somewhat sensitive to small errors in film thickness and curvature. Since both quantities can be measured accurately, this sensitivity does not seem to be a significant obstacle. The main advantages of the technique are that the deformation is driven by the internal residual stress in the films and external load drivers or sophisticated testing setups are not required. The method does not require any special wafer processing prior to depositing the film of interest, which allows for allows for a seamless integration of the proposed technique for the mechanical testing of coatings post-production. The technique is relatively easy to implement with standard equipment available in the clean room for fabrication and metrology. The technique is easy to adapt to a wide range of materials; additionally etch stop layers can be used for materials with low selectivity to Si etch. The main challenge in developing the test methodology is the requirement for an SU-8 coating that has a constant and consistent mechanical behavior across the entire range of thicknesses used in the bilayer cantilevers. The developed process flow is successful in achieving a repeatable SU-8 behavior. In addition, fabrication guidelines are provided to produce defect-free test structures under broad conditions. Measurement of thinner SU-8/Cu bilayer samples are challenging when using the white light interferometry profiler due to interference at the interface. This measurement limitation can be overcome by using phase-stepping interferometry with monochromatic illumination. As such, the technique serves as a useful in-line metrology tool that can be directly implemented on ultrathin coatings from a production line.
Conclusion
Measurement of the biaxial modulus and residual stress in ultrathin copper films (75 nm thick) is demonstrated using residual stress–driven freestanding bilayer cantilevers with SU-8 as the stress overlayer. The test design is simple and does not require external load drivers and can be directly applied to films synthesized in a clean room environment. Critical issues and remedies for producing defect-free bilayer structures with repeatable and uniform behavior have been identified. The biaxial modulus is 211 ± 19 GPa, approximately 19% lower than the theoretical value of a polycrystalline film with an ideal 〈111〉 fiber texture and in line with expectations for a nanocrystalline film. The residual strain is (7.05 ± 0.22) × 10−3. Young’s modulus of the copper films is measured from the force–deflection response of freestanding bilayer cantilevers using a nanoindenter. Young’s modulus and residual strains measured in this study are in close agreement with those measured using additional residual stress–driven structures developed for the same coatings [Reference Cuddalorepatta, Li, Pantuso and Vlassak19, Reference Cuddalorepatta, van Rees, Li, Pantuso, Mahadevan and Vlassak20].
Materials and methods
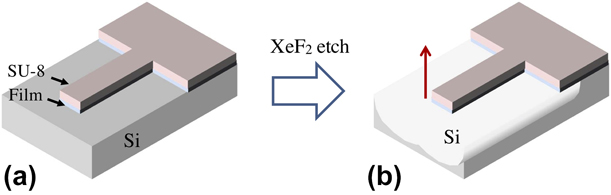
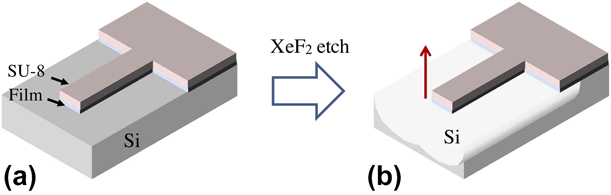
The fabrication and metrology tools used are described here. Figure 3 depicts a schematic of the bilayer cantilevers, where the test film is coated with a well-characterized stress overlayer (termed as the reference material). When released from the underlying substrate, the bilayer cantilevers curl with a measurable curvature. By varying the thickness of the known reference material, the curvatures are varied and related to the biaxial elastic modulus and residual strain of the bilayers. In addition to the above technique, Young’s modulus of the ultrathin test films is measured by deflecting the freestanding bilayer cantilevers with a nanoindenter (Supplementary material SI), using Weihs's method [Reference Weihs, Hong, Bravman and Nix18].
Schematic of the freestanding bilayer cantilever beam (a) Unreleased structure after photoresist exposure and film etching (b) Freestanding structure deflects up after the supporting Si is etched using XeF2 etch. The XeF2 etch system is an isotropic etch designed to etch silicon sacrificial layers for the fabrication of freestanding micro- and nano-electro-mechanical devices.
We choose SU-8 as the reference material since it can function both as the stress driver to deform the test film and as a photoresist for patterning. SU-8 is a well-characterized photoresist that is chemically compatible with a broad range of materials and has known mechanical behavior and fabrication protocols [Reference Lorenz, Despont, Fahrni, LaBianca, Renaud and Vettiger21, Reference Hopcroft, Kramer, Kim, Takashima, Higo, Moore and Brugger22, Reference Keller, Blagoi, Lillemose, Haefliger and Boisen30, Reference Nordstrom, Keller and Lillemose31]. However, as SU-8 is also used for driving deformation in the test film, a tight control is needed in the SU-8 processing to ensure that its behavior across all the SU-8 thicknesses used in the structures is repeatable. The technique is demonstrated for 75 nm copper films using different structures with SU-8 thicknesses ranging from 2 to 15 μm.
Test sample fabrication and metrology
The detailed process flow for fabricating the bilayer Cu/SU-8 cantilevers is provided in Supplementary material SII. Figure 4 illustrates the integrated process flow of the structures. The fabrication starts with a (100) silicon wafer that is preconditioned using a buffered oxide etch. An argon plasma clean is followed by thin film deposition using a magnetron sputter deposition system (AJA International Inc., Scituate, Massachusetts). The copper test film with a nominal thickness of 70 nm is deposited with a titanium layer of 3 nm on the top and bottom. Ti serves as an adhesion promoter for the SU-8 and as a diffusion barrier for copper. Alternately, Omnicoat (MicroChem, Westborough, Massachusetts), an adhesion promoter that is designed for SU-8 can be used. The difference in curvatures of the cantilevers with and without Omnicoat was less than 4%. SU-8 (MicroChem, Westborough, Massachusetts) is spin coated on the top of the film of interest followed by a soft bake at 95 °C. SU-8 coatings with nominal thicknesses ranging from 2 to 15 μm are used. All temperature excursions in SU-8 (soft bake, hard bake, and dehydration bake) require a slow-ramped heat and cool cycle.
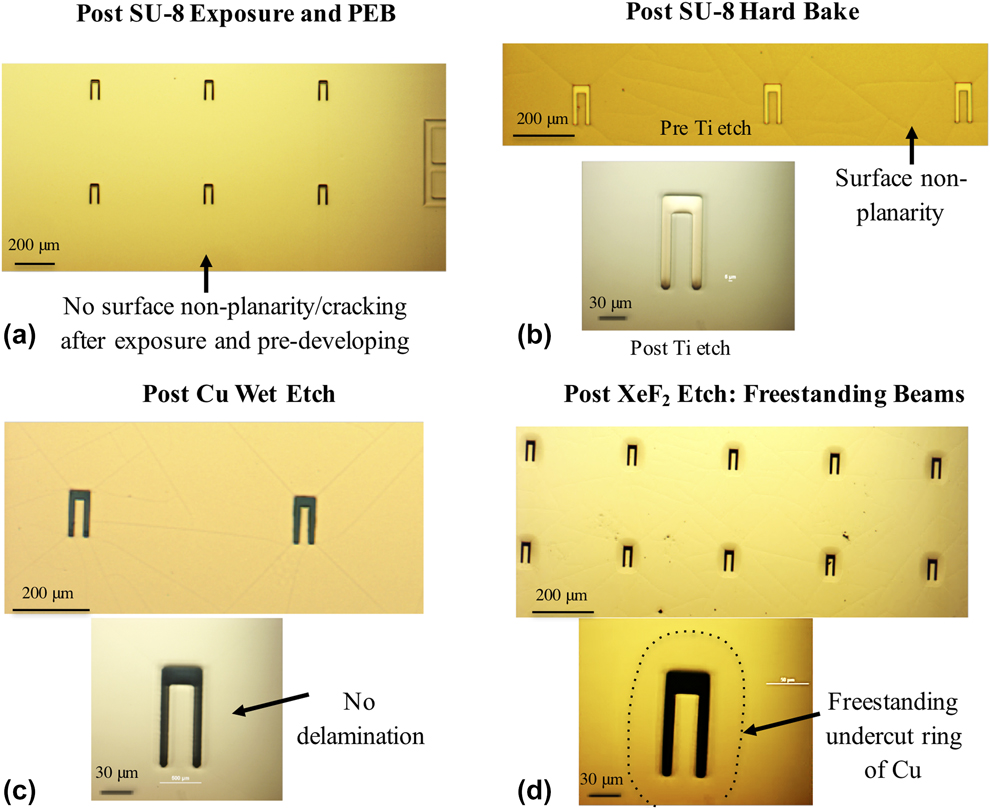
Optical images of bilayer cantilevers through the stages in fabrication. (a) After deposition of both coatings, SU-8 exposure and PEB. (b) Surface cracking that occurs in SU-8 after development (not shown here) is healed with the hard bake, although some surface planarity is evident. (c) Delamination typically occurs at the SU-8/Cu interface during wet processes. Using the optimized process flow, the structures do not show any delamination after the wet Cu etch. (d) Freestanding bilayer cantilevers after the Si etch. The lighter colored ring (outlined with the dotted boundary) around the freestanding cantilever is a bilayer ring of Cu/SU-8 from the undercutting of the Si substrate.
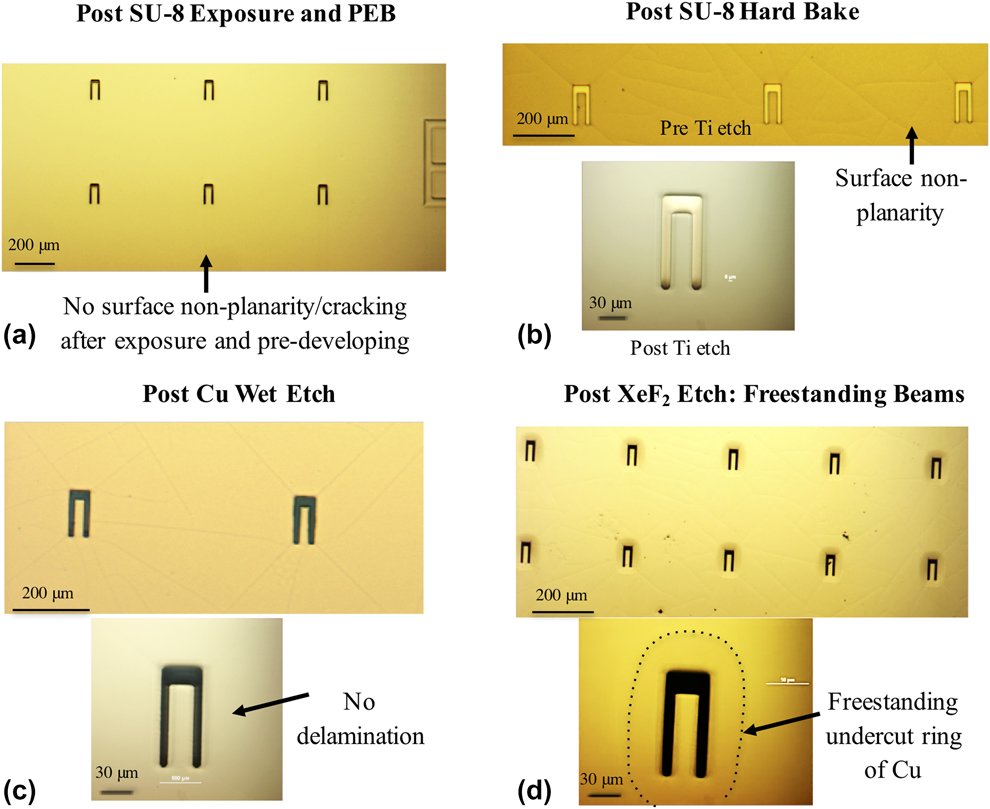
The SU-8 is patterned using a contact mask aligner (Karl Suss MA-6; Model: SUSU MA-6, SUSS MicroTec, Karl SUSS America Inc., Waterbury Center, Vermont). As the copper film is reflective, standing waves lead to underexposure and SU-8/copper interface delamination. Hence longer exposure times are used to ensure a uniform crosslink density through the thickness of SU-8. For SU-8 with thicknesses greater than 5 μm, a long pass filter that allows UV radiation higher than 350 nm is used to prevent nonrectangular cross-sections or T-topping [Reference Lee, Shi, Maciel and Cha32]. The exposed substrates undergo a soft bake at 95 °C and are then developed in an SU-8 developer (<3 min), rinsed in isopropyl alcohol (IPA), and dried with N2. A hard bake is followed at 180 °C for 20 min using a ramped temperature cycle. SU-8 could develop surface cracking after development, which is healed with the hard bake, although some surface nonplanarity remains (Fig. 4).
Reactive ion etching (RIE) is conducted using an oxygen plasma for Omnicoat (if used) and a CF4-based titanium etch (South Bay RIE). Wet etching of the copper film follows with 80 wt% phosphoric acid, 5 wt% nitric acid, 5 wt% acetic acid, and 10 wt% deionized (DI) water. DI water rinse is then followed by a dehydration bake at 100 °C for 2 min. The Si substrate beneath the structures is etched isotropically using a XeF2-based etch system and freestanding cantilevers are obtained. Owing to the isotropic nature of the Si etch, the Si is undercut and generates a freestanding bilayer ring around the cantilevers [Fig. 4(d)]. The Si etch and wet etch processes are the primary sources for defects/low yield of samples. Fabrication guidelines for avoiding defects and generating repeatable SU-8 behavior across all thicknesses are included (Supplementary material SIII).
The film thicknesses were measured using both a physical profiler (Veeco Dektak 6M; Model: Dektak 6M, Veeco Instruments Inc., Plainview, New York) and a white light optical profiler (Taylor Hobson CCI HD; Model CCI HD, Taylor Hobson Inc., Warrenville, Illinois) and were found to vary by less than 2%. The thickness of the copper is 75 ± 3 nm. The error in the SU-8 thickness is less than 0.1 μm across all thicknesses (2–15 μm). Copper films using similar deposition conditions show a columnar grain structure with a strong 〈111〉 fiber texture [Reference Sim, Park, Uchic, Shade, Lee and Vlassak14]. The same texture is expected in the copper films used in this study. The expected grain size in the copper film is at most 65 nm, as grain sizes are known to be constricted by the thickness of the film [Reference Thompson33].
Fabrication of the single-layer SU-8 cantilevers follows that of the bilayer cantilevers (without the copper processes). The curvatures of the single-layer SU-8 cantilevers across the thickness range are used to extract the curvature of the ultrathin film from the curvatures of the bilayer cantilevers (section “Reference material characterization—SU-8”). A total of 265 bilayer cantilevers were measured with 14–35 structures at a given SU-8 thickness. The deflections and curvatures are measured using the white light optical profiler. The deflection measurements obtained from the white light profiler are compared with those from an atomic force microscope (Veeco NanoMan) and are found to be in good agreement (within 2%). Bilayer structures with an SU-8 thickness of 2 μm were challenging to measure using the white light interferometry profiler due to interactions with the SU-8/Cu interface. The interference from the interface is manifested as a discontinuity in the deflection, and these data have been eliminated from the analysis. Subsequently, there are 47 measurements of the bilayer cantilevers at the 2 μm SU-8 thickness and 218 measurements for SU-8 thicknesses in the range of 4–15 μm.
Reference material characterization—SU-8
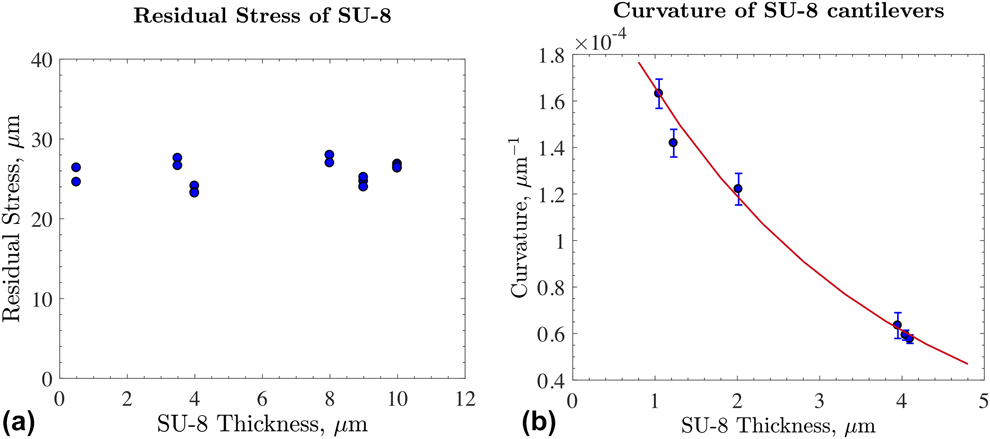
The residual stress in the SU-8 coating was characterized using the substrate curvature technique (Flexmet; Model: FLX-2320-S, Toho Technology, Chicago, Illinois) [Reference Freund, Floro and Chason34]. SU-8 coatings with varying thicknesses were spin coated on bare (100) silicon wafers. The residual stress measured in the SU-8 coatings is 25.6 ± 1.5 MPa [Fig. 5(a)] and is independent of the SU-8 thickness. This result confirms that the optimized SU-8 processing was successful in ensuring that the glass transition temperature (and hence the residual stress) was reproducible across all the thicknesses. Hence, the stress in the SU-8 layer is repeatable across all the SU-8 thicknesses used in the structures.
SU-8 material measurements (a) Residual stress in the SU-8 as a function of SU-8 thickness after hard bake. The residual stress is independent of the SU-8 thickness and measures 25.6 ± 1.5 MPa. (b) Curvatures of freestanding single-layer SU-8 cantilever beams as a function of SU-8 thickness. The test data is described by the empirical relation (thick red line)  ${1 \over \kappa } = A{{\rm{e}}^{Bh}}$, where A = 4342 ± 182 μm and B = 0.3315 ± 0.0116 μm−1. The SU-8 curvatures from these single-layer cantilevers are used to evaluate the contribution of the ultrathin films to the curvatures of bilayer cantilevers in Fig. 2.
Young’s modulus of SU-8 is 5.95 ± 0.06 GPa using nanoindentation, assuming a Poisson’s ratio of 0.22 [Reference Lorenz, Despont, Fahrni, LaBianca, Renaud and Vettiger21, Reference Hopcroft, Kramer, Kim, Takashima, Higo, Moore and Brugger22]. This value is at the higher end of the reported values (4–5 GPa) [Reference Lorenz, Despont, Fahrni, LaBianca, Renaud and Vettiger21, Reference Hopcroft, Kramer, Kim, Takashima, Higo, Moore and Brugger22], possibly due to the long exposure times used here for ensuring a uniform SU-8 crosslink density compared to that recommended for SU-8 when it serves only as a photoresist. The resulting biaxial modulus  $\left( {{{\bar{E}}_{\rm{r}}}} \right)$ and residual strain (εr0) in SU-8 are 7.63 ± 0.08 GPa and (3.35 ± 0.20) × 10−3, respectively.
Despite the long exposure times, there is a slight gradient in crosslink density through the thickness of the SU-8 coatings, which causes a thermal stress gradient through the thickness when the SU-8 cools below its glass transition temperature. This stress gradient causes the single-layer SU-8 beams to slightly curl when released from the substrate. Apart from the curvature induced by the stress gradient, the released single-layer SU-8 beams also deflect due to a rotation of the root of the beam. This rotation is a natural consequence of the residual stress in the coating and undercutting of the silicon.
The curvatures of the single-layer SU-8 cantilevers are shown in Fig. 5(b). These curvatures are used to correct the curvatures of the bilayer beams in Fig. 2. The deflections of the single-layer SU-8 cantilevers that are thicker than 10 μm contributed to less than 10% of the deflection of the bilayer cantilevers and were primarily due to rotation at the root. Thinner beams have a more significant contribution from the stress gradient–induced curvature. A total number of 40 measurements were conducted with about seven samples per thickness.
Mechanics model and sensitivity analysis
As described earlier, the difference in the residual stresses in the bilayer cantilever generates a moment causing it to curl when released from the substrate. The curvature of the freestanding bilayer cantilever depends on the elastic properties, geometry, and the residual stress in both the layers. As the SU-8 properties and geometry are known (section “Reference material characterization—SU-8”), the unknowns which are the test film properties can be obtained from the curvatures. The deformation of the bilayer cantilevers under thermal expansion is known from the linear plate theory [Reference Schafer35]. We adapt this formulation for the loading induced by the residual stress in the two layers. The resulting curvature κ of the freestanding bilayer cantilever due to residual strains is given by:
 $$\kappa = {{ - 1} \over {{h_{\rm{r}}}}}{{6\lambda m\left( {1 + m} \right)\left( {{\varepsilon _{{\rm{r0}}}} - {\varepsilon _{{\rm{f0}}}}} \right)} \over {1 + \lambda m\left( {4 + 6m + 4{m^2}} \right) + {m^4}{\lambda ^2}}}\quad ,$$
where  $\lambda = {{{{\bar{E}}_{\rm{f}}}} \over {{{\bar{E}}_{\rm{r}}}}}$ is the ratio of biaxial modulus of the film of interest and the reference material (SU-8),
 $m = {{{h_{\rm{f}}}} \over {{h_{\rm{r}}}}}$ is the ratio of thickness of film and SU-8, and εr0 and εf0 represent the average residual strains in the reference material and the film of interest before release. The biaxial modulus is
 $\bar{E} = {E \over {1 - \nu }}$, where E and ν are Young’s modulus and Poisson’s ratio, respectively.
In the mechanics formulation, we assume that the adhesion between the SU-8 and film is perfect. Any delamination at the interface is evident during the processing stages and in the deflection measurements and such data are eliminated. All the material dimensions are measured and invariant during the processing. We verified that the dimensions of copper, titanium, and SU-8 were not altered during the fabrication. As such, titanium serves as an effective etch stop layer (xenon diflouride–based Si etch) for the film and helps in maintaining the sample dimensions throughout the processing. We assume that the residual stress in SU-8 measured from the wafer curvature method applies to the SU-8 in the bilayer structures. We verified this assumption using alternate residual stress–driven SU-8 structures with similar dimensions and fabrication and found very good agreement between the two measurements (within 2%) [Reference Cuddalorepatta, Li, Pantuso and Vlassak19]. There are no shear forces on the cantilevers and only biaxial residual stresses exist in the materials.
The gradient in the residual stress of the test film is not measured using this technique; only the average residual stress is measured. For the film and SU-8 thicknesses that we used in the bilayer cantilevers, contribution of the gradients in the residual stress in the test film to the moment is very small compared to that from the average stress component. Hence, the residual stress in the 75 nm test film is assumed to be uniform in the formulation.
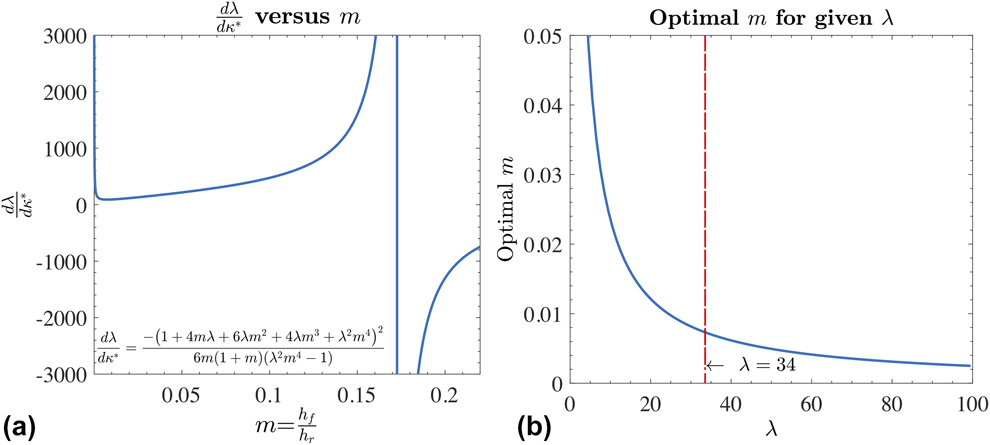
To determine the range of SU-8 thicknesses that provides the most sensitive measurement of the elastic properties and that is least susceptible to experimental error, a sensitivity analysis is conducted on Eq. (4). The change in the modulus ratio (λ) with respect to small errors of curvature (κ) is evaluated as a function of m, the thickness ratio of the film and SU-8 [Eq. (5)]. The ratio of the biaxial moduli of the test material copper and SU-8 (λ) yields a value of 34. Using this value of λ, Fig. 6(a) shows that a small error in the curvature can lead to a large error in the value of the elastic modulus depending on the SU-8 layer thickness (h r) except in the proximity of the minimum (m = 5 × 10⁻³). The values of m in this vicinity show that the structures with 75 nm thick copper require SU-8 thicknesses in the range of 4–15 μm. The values of m that correspond to a minimum in the error propagation in Eq. (5) are evaluated as a function of the stiffness ratio λ and are presented in Fig. 6(b). This plot is useful in finding the SU-8 thickness that would yield the least error propagation due to errors in the curvature measurement, if an estimate of the film’s modulus was available. In this study, the optimum SU-8 thickness for a 75 nm copper film is approximately 11 μm.
 $${{{\rm{d}}\lambda } \over {{\rm{d}}{\kappa ^*}}} = \left[ {{{ - \left( {{\varepsilon _{{\rm{r0}}}} - {\varepsilon _{{\rm{f0}}}}} \right)} \over {{h_{\rm{r}}}}}} \right]{{{\rm{d}}\lambda } \over {{\rm{d}}\kappa }} = {{ - {{\left( {1 + 4m\lambda + 6\lambda {m^2} + 4\lambda {m^3} + {\lambda ^2}{m^4}} \right)}^2}} \over {6m\left( {1 + m} \right)\left( {{\lambda ^2}{m^4} - 1} \right)}}\quad .$$
Sensitivity analyses for the influence of the thickness of the reference material and test film modulus (a) Plot of the derivative of λ with respect to curvature versus m, where  $\lambda = {{{{\bar{E}}_{\rm{f}}}} \over {{{\bar{E}}_{\rm{r}}}}}$ [Eq. (5)]. For a 75 nm thick copper film (h f), the biaxial modulus ratio λ is 34 and the minimum error amplification in λ due to measurement errors in curvature (κ) is achieved when the thicknesses of SU-8 are in the range of m = (5 × 10⁻³, 2 × 10⁻²). This corresponds to SU-8 thicknesses (h r) from 4 to 15 μm. (b) Optimal thickness ratio m as a function of stiffness ratio λ. The optimal m is the value that yields a minimum in the error amplification in Eq. (5). For a 75 nm thick copper film where λ is 34, the optimal thickness of SU-8, where the error is minimum, is 11 μm.
Supplementary material
To view supplementary material for this article, please visit https://doi.org/10.1557/jmr.2019.278.
Acknowledgments
The work presented in this paper was supported by Intel Corporation. The test structures were fabricated at the Integrated Sciences Cleanroom and Nanofabrication Facility at Boston College, the Harvard University Center for Nanoscale Systems (CNS), which is supported by the National Science Foundation under NSF ECCS award No. 1541959, and Materials Research Science and Engineering Center at Harvard University, which is supported by the National Science Foundation under Award No. DMR-14-20570.