1 Introduction
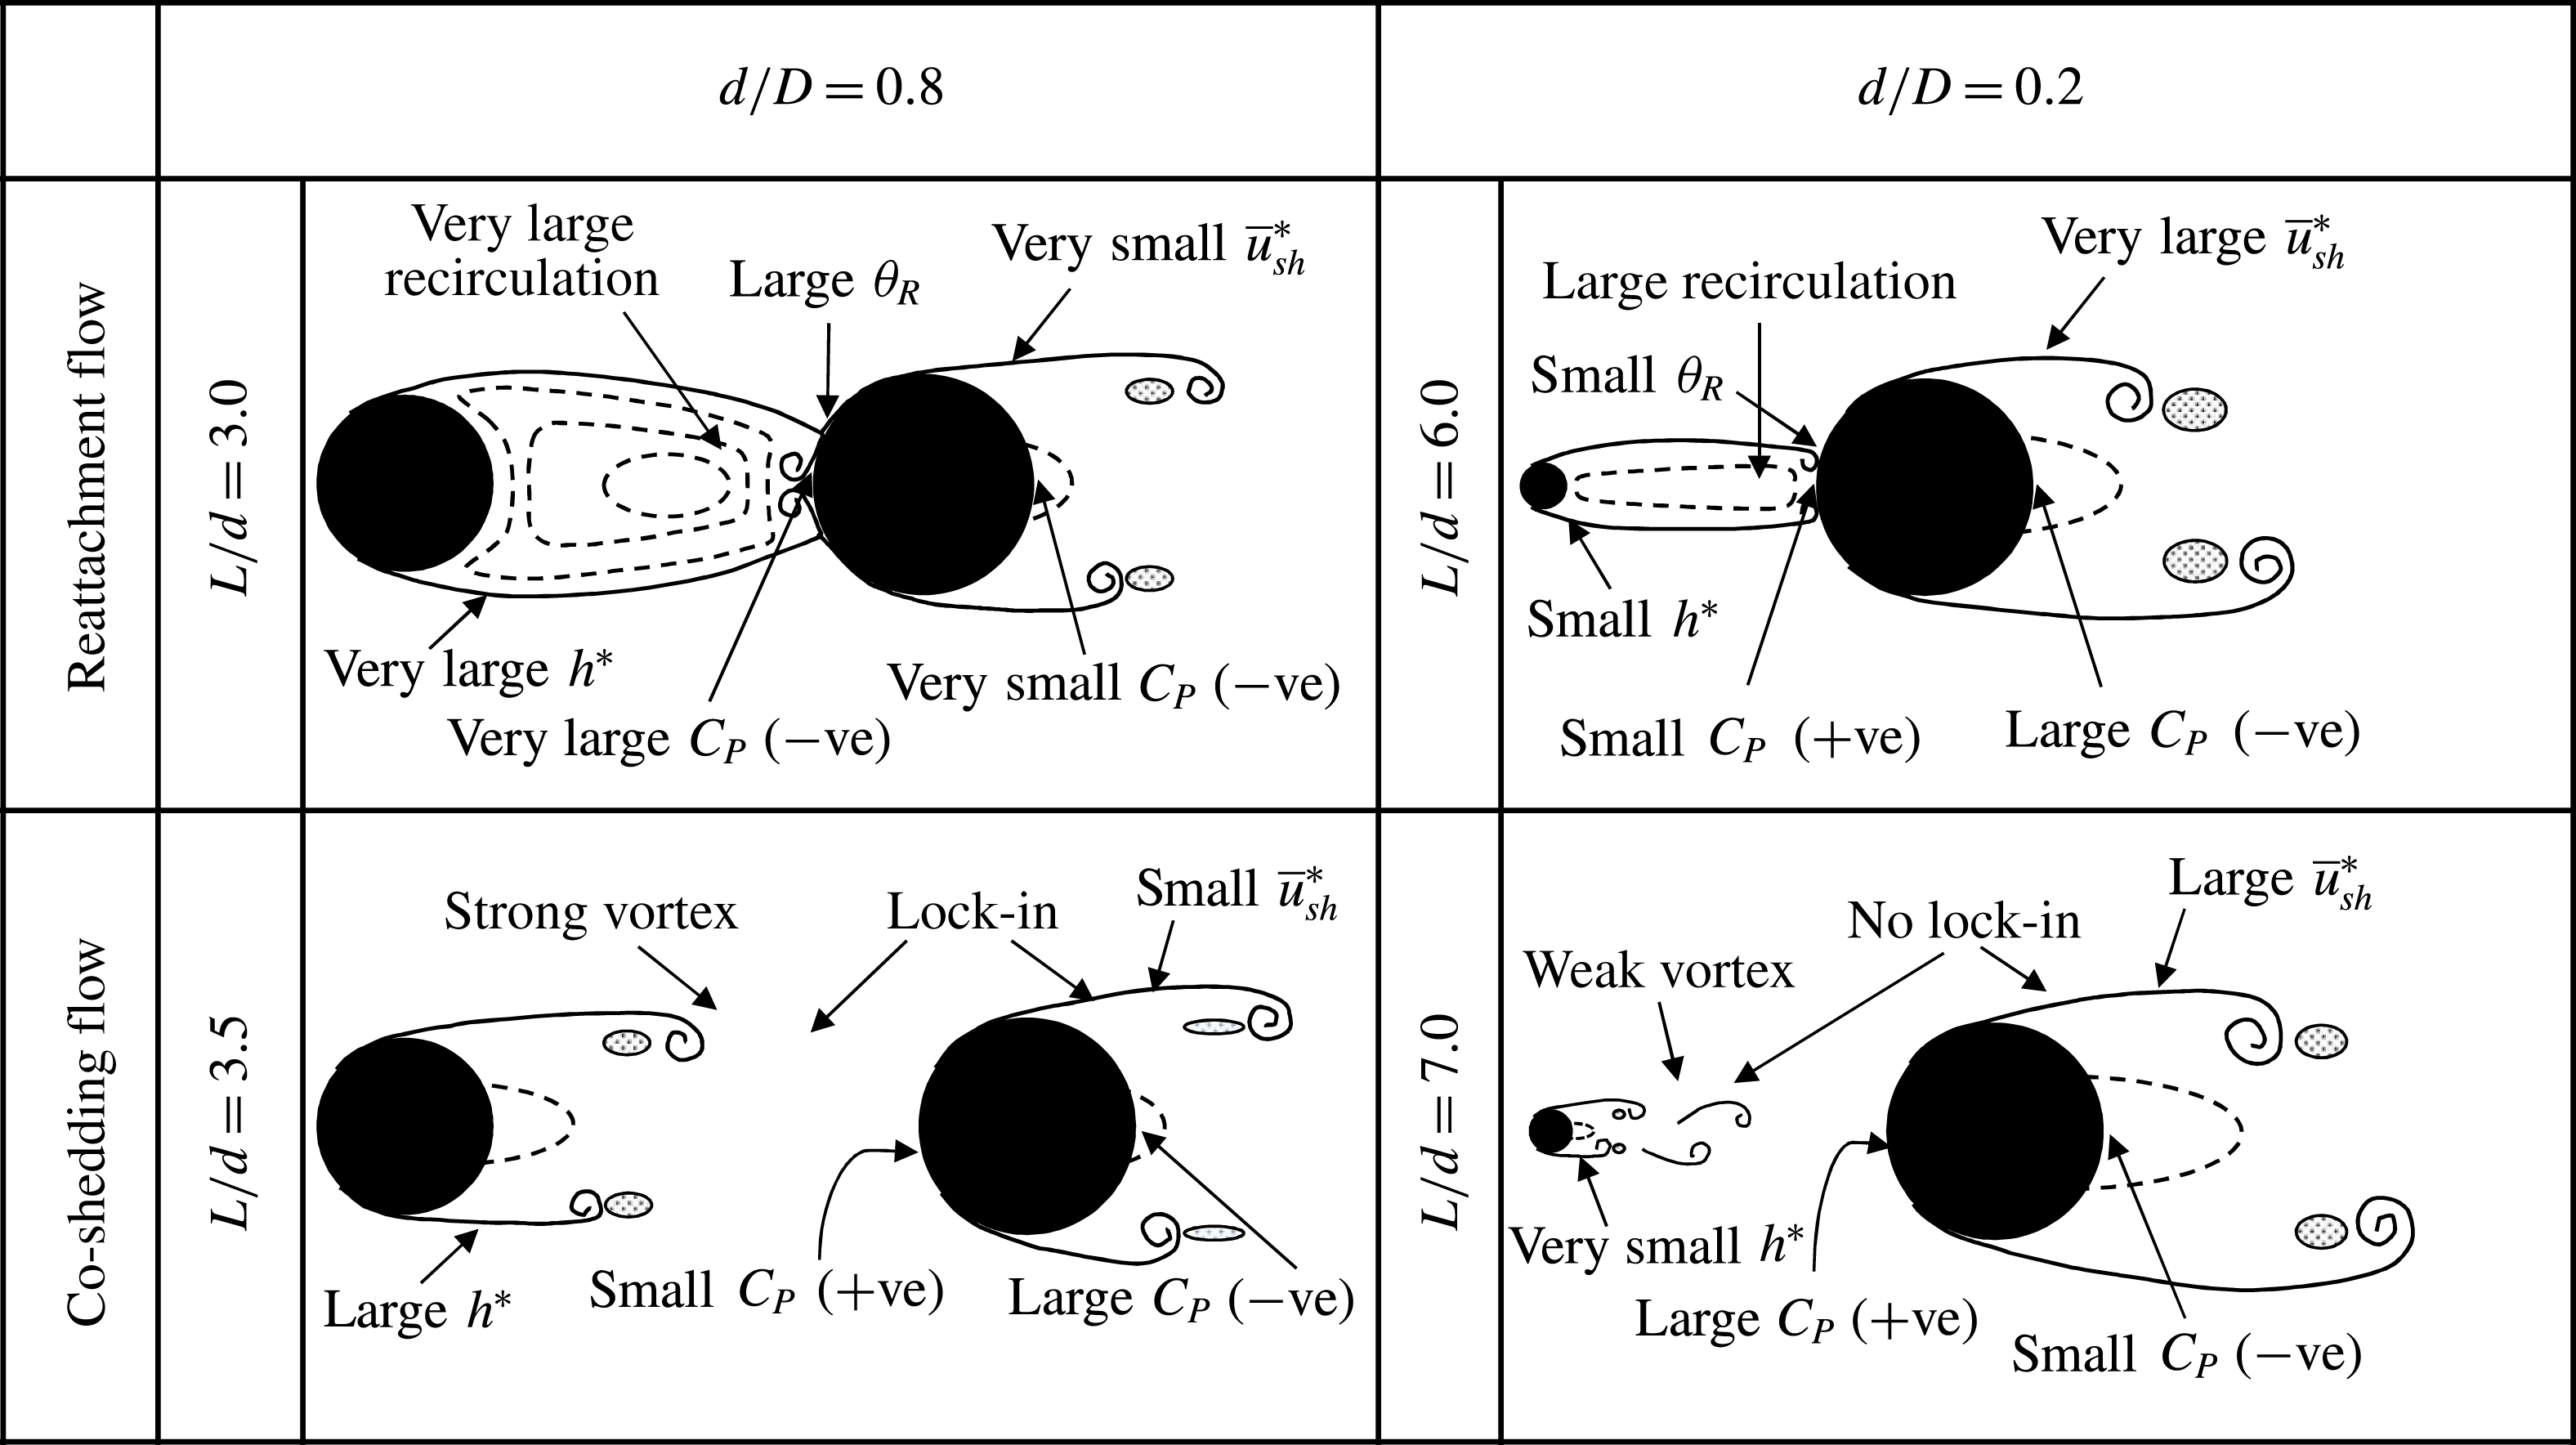
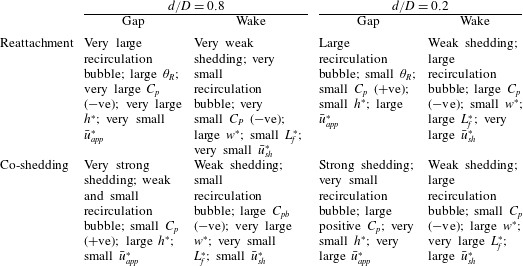
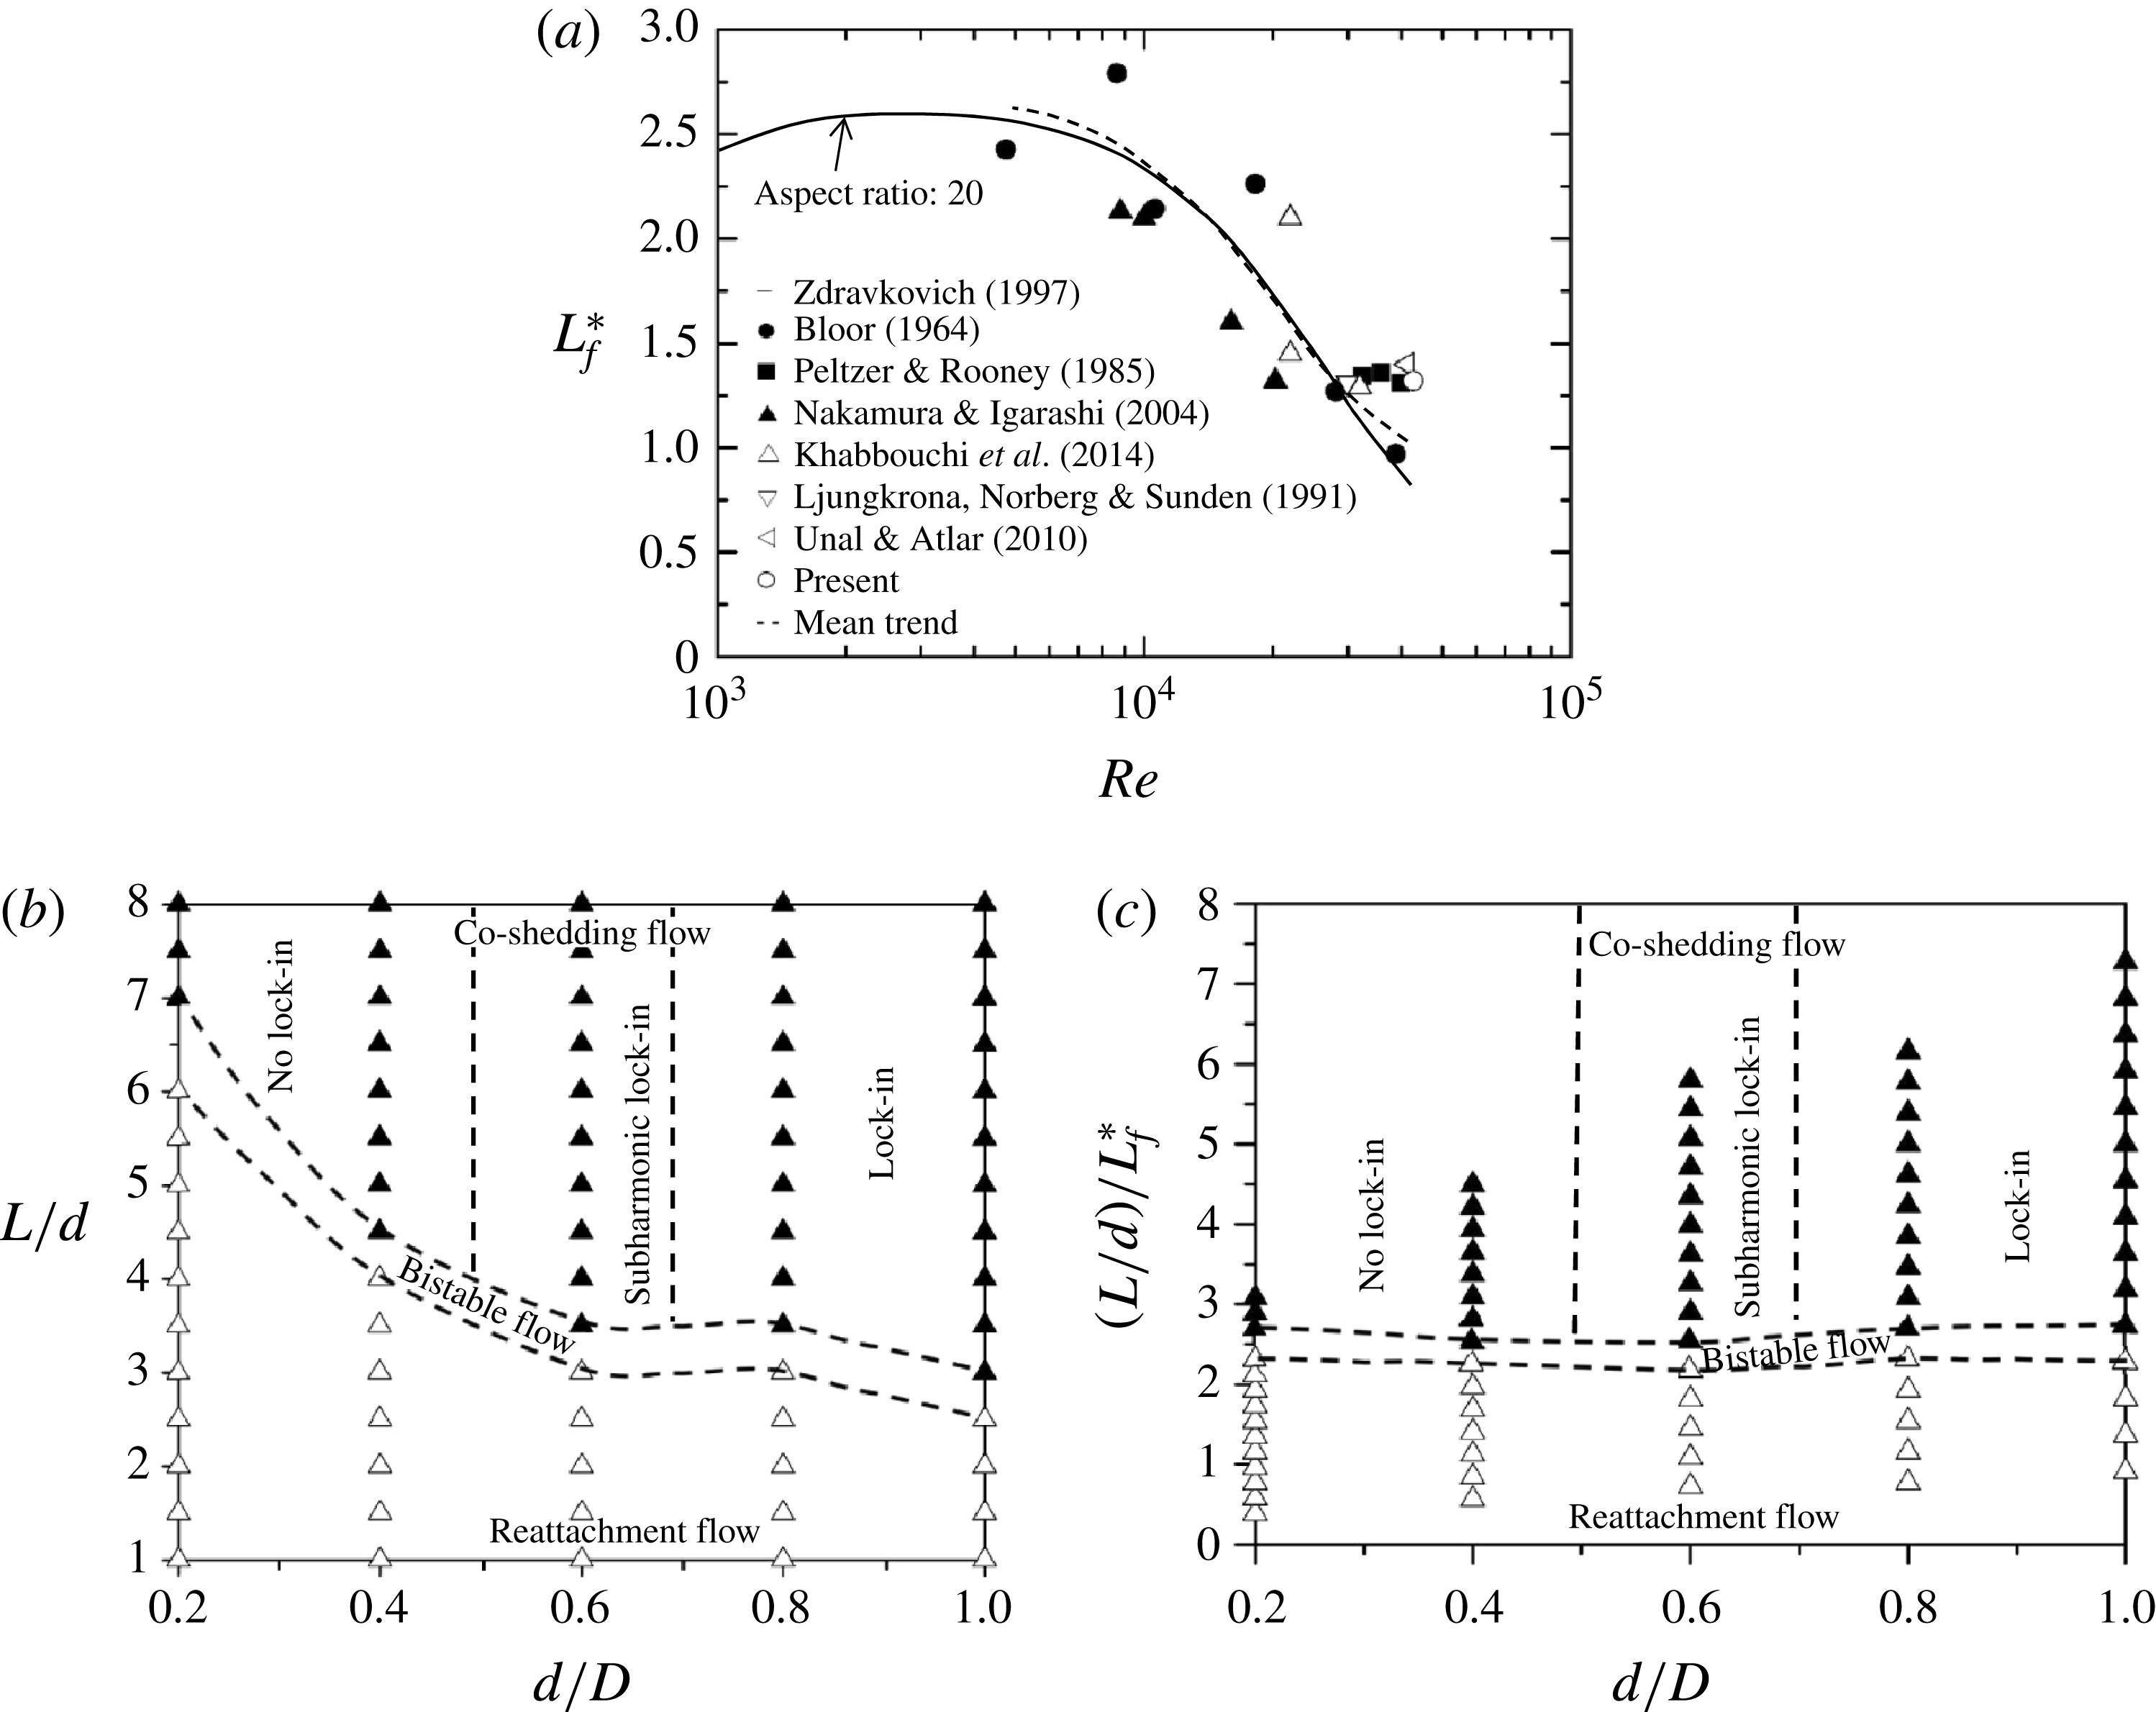
Multiple slender structures in cross-flow are widely seen in engineering. Typical examples are high-rise buildings or skyscrapers, chimney stacks, overhead power-line bundles, submarine communication systems, undersea piggyback pipelines, electronic components on boards, drilling risers, tube bundles in heat exchangers, bridge piers, stays, masts and chemical-reaction towers. Naturally, it is of fundamental and practical importance to thoroughly understand the proximity effect on the fluid dynamics associated with multiple closely separated cylindrical structures. The flow around two tandem circular cylinders involves the most generic flow features, including shear layer separation/reattachment, quasi-periodic vortices, mutual interactions, separation bubble, vortex impingement, etc., thus providing an excellent model for gaining insight into the flow physics of multiple cylindrical structures. This flow is highly dependent on the separation
 $L/d$
between the upstream-cylinder centre and the forward stagnation point of the downstream cylinder, the Reynolds number
 $Re$
and the ratio
 $d/D$
of the diameters of the cylinders, where
 $d$
and
 $D$
are the upstream- and downstream-cylinder diameters respectively. Extensive investigations have been conducted to understand the dependence of the flow on
 $L/d$
and
 $Re$
(e.g. Zdravkovich Reference Zdravkovich1977, Reference Zdravkovich1987; Igarashi Reference Igarashi1981, Reference Igarashi1984; Arie et al.
Reference Arie, Kiya, Moriya and Mori1983; Ljungkrona, Norberg & Sunden Reference Ljungkrona, Norberg and Sunden1991; Mahir & Rockwell Reference Mahir and Rockwell1996; Alam et al.
Reference Alam, Moriya, Takai and Sakamoto2003).
Two elastically supported cylinders in tandem behave differently from fixed cylinders and are well known for experiencing both vortex-induced vibration (VIV) and galloping vibrations which are sensitive to
 $d/D$
and
 $L/d$
(Bokaian & Geoola Reference Bokaian and Geoola1984a
,Reference Bokaian and Geoola
b
; Zdravkovich Reference Zdravkovich1988; Borazjani & Sotiropoulos Reference Borazjani and Sotiropoulos2009; Kim, Alam & Zhou Reference Kim, Alam and Zhou2009; Huang & Sworn Reference Huang and Sworn2011). For
 $d/D=1.0$
where the upstream cylinder is fixed and the downstream one is free to vibrate, Bokaian & Geoola (Reference Bokaian and Geoola1984a
) observed that the cylinder experienced only galloping (
 $L/d=0.59$
), or only VIV (
 $L/d>2.5$
) or a combined VIV and galloping (
 $L/d=1.0$
), or a separated VIV and galloping (
 $1.5\leqslant L/d\leqslant 2.5$
). The vibration physics is very complicated (Zdravkovich Reference Zdravkovich1988). Bokaian & Geoola (Reference Bokaian and Geoola1984b
) investigated the other case where the downstream cylinder is fixed and the upstream one is free to vibrate. Galloping and VIV were reported for
 $L/d\leqslant 1.25$
and
 $1.25<L/d<4.5$
respectively. Huang & Sworn (Reference Huang and Sworn2011) found that the upstream cylinder always exhibited a typical VIV response for
 $d/D=2.0$
, not galloping, as the upstream-cylinder size was larger. Due to the complicated nature of VIV and galloping for tandem cylinders, it is crucial to gain a thorough knowledge of the fluid dynamics of two fixed cylinders, which facilitates the understanding of VIV and galloping.
Igarashi (Reference Igarashi1981, Reference Igarashi1984) and Zdravkovich (Reference Zdravkovich1987) classified the wake flow of two tandem cylinders of identical diameter into three regimes: (i) the extended-body regime
 $(0.5<L/d<1.0)$
, where the two cylinders are so close to each other that the shear layers separated from the upstream cylinder overshoot the downstream; (ii) the reattachment regime
 $(1.0<L/d<3.5)$
, where the separated shear layers reattach on the downstream cylinder; (iii) the co-shedding regime
 $(L/d>3.5)$
, where both cylinders generate vortices at the same frequency. There is a transition or bistable flow between the reattachment and co-shedding regimes, where both reattachment and co-shedding flows occur intermittently, switching from one to the other (Igarashi Reference Igarashi1981); the corresponding
 $L/d$
is often referred to as the critical spacing
 $(L/d)_{c}$
. Xu & Zhou (Reference Xu and Zhou2004) examined the
 $Re$
effect on the flow classification (
 $Re=0.8\times 10^{3}{-}4.2\times 10^{4}$
) and further divided the reattachment regime into two subregimes, i.e.
 $L/d=1.5{-}2.5$
and 2.5–4.5, corresponding to the occurrence of shear layer reattachment on the downstream and upstream sides of the downstream cylinder respectively (see also Zhou & Yiu Reference Zhou and Yiu2006). Ljungkrona, Norberg & Sunden (Reference Ljungkrona, Norberg and Sunden1991) and Ljungkrona & Sunden (Reference Ljungkrona and Sunden1993) found at
 $Re=(0.33{-}4.0)\times 10^{4}$
that
 $(L/d)_{c}$
decreases with increasing
 $Re$
because of the dependence of the vortex formation length on
 $Re$
.
Extensive investigations have been conducted on the fluid forces acting on two tandem cylinders of identical diameter (Zdravkovich Reference Zdravkovich1977; Igarashi Reference Igarashi1981, Reference Igarashi1984; Arie et al.
Reference Arie, Kiya, Moriya and Mori1983; Jendrzejcyk & Chen Reference Jendrzejcyk and Chen1986; Zhang & Melbourne Reference Zhang and Melbourne1992; Ljungkrona & Sunden Reference Ljungkrona and Sunden1993; Alam et al.
Reference Alam, Moriya, Takai and Sakamoto2003; Alam & Zhou Reference Alam and Zhou2008; Sumner Reference Sumner2010; Alam Reference Alam2014, Reference Alam2016). The time-mean drag coefficient (
 $C_{D}$
) on the upstream cylinder gradually decreases with
 $L/d$
in the extended-body and reattachment regimes; on the other hand, that on the downstream cylinder is negative (forward thrust) for
 $L/d<3.5$
, with a local maximum at
 $L/d\approx 2.0$
(Zdravkovich & Pridden Reference Zdravkovich and Pridden1977; Igarashi Reference Igarashi1981; Alam et al.
Reference Alam, Moriya, Takai and Sakamoto2003). The occurrence of the local maximum is
 $Re$
-dependent. The local maximum appears for
 $Re>3.1\times 10^{4}$
and disappears for
 $Re<3.1\times 10^{4}$
. Alam (Reference Alam2014) discussed the physical aspects behind the presence and absence of the local maximum. The fluctuating drag and lift coefficients,
 $C_{D}^{\prime }$
and
 $C_{L}^{\prime }$
, on the downstream cylinder are much larger than those of the upstream cylinder in the reattachment and co-shedding regimes, and are strongly dependent on
 $L/d$
in the reattachment regime, exceeding at
 $L/d\approx 2.0$
their counterparts of a single cylinder by 2.8 and 2.0 times respectively (Alam et al.
Reference Alam, Moriya, Takai and Sakamoto2003).
The Strouhal number (
 $St$
) characterizes the wake of two tandem cylinders. It is now well documented that the two cylinders shed vortices at the same frequency at least up to
 $L/d=10$
, and two distinct values of
 $St$
occur only in the transition from one regime to another (Novak Reference Novak1974; Kiya et al.
Reference Kiya, Arie, Tamura and Mori1980; Igarashi Reference Igarashi1981, Reference Igarashi1984; Alam et al.
Reference Alam, Moriya, Takai and Sakamoto2003; Xu & Zhou Reference Xu and Zhou2004). The flow structure has been characterized by e.g. Yiu, Zhou & Zhu (Reference Yiu, Zhou and Zhu2004) and Zhou & Yiu (Reference Zhou and Yiu2006). Sumner (Reference Sumner2010) and Zhou & Alam (Reference Zhou and Alam2016) give recent compendiums of past investigations.
Previous investigations have greatly improved our understanding of the fluid dynamics around two tandem cylinders of the same diameter. However, the engineering structures in a group or in close proximity are not always of the same diameter. For example, an offshore piggyback pipeline normally comprises one small pipe (or multiple pipes) and a large pipe, which could be either in contact or separated, depending on the design and installation requirements. Yet, there have been so far few investigations on the wake of two tandem cylinders of different diameters. To investigate the feasibility for flow control, Lee, Lee & Park (Reference Lee, Lee and Park2004) measured
 $C_{D}$
on the downstream cylinder when placing a small control cylinder upstream (
 $L/d=3.75{-}26.25$
,
 $d/D=0.133{-}0.267$
,
 $Re=2.0\times 10^{4}$
). They observed a maximum reduction in
 $C_{D}$
by 29 % at
 $d/D=0.233$
and
 $L/d=6.786$
. Zhao et al.’s (Reference Zhao, Cheng, Teng and Liang2005) numerical simulation of the wake of two different cylinders (
 $d/D=0.25$
) at
 $Re=500$
showed that the gap between cylinders had a significant effect on the forces on the downstream cylinder, and its increase from
 $0.05D$
to
 $1.0D$
was followed by a decrease in
 $C_{D}$
. Zhao et al. (Reference Zhao, Cheng, Teng and Dong2007) performed a similar numerical investigation at
 $Re=5.0\times 10^{4}$
for
 $d/D=0.5$
with a gap of
 $0.05D{-}0.4D$
and found that
 $C_{D}$
was almost independent of the gap size. Alam & Zhou (Reference Alam and Zhou2008) conducted a detailed experimental investigation on the wake of two tandem cylinders of different diameters (
 $d/D=0.24{-}1.0$
) at a fixed
 $L/d~(=5.5)$
. They made an interesting finding, that is, two predominant frequencies were detected behind the two cylinders, one identical to that of the vortex shedding from the upstream cylinder and the other from the downstream cylinder being lower. They further found that
 $d/D$
may have a pronounced effect on the time-averaged and fluctuating forces on the downstream cylinder.
The previous scattered investigations naturally cannot provide the full picture of the wake of two tandem cylinders of different diameters and many issues have yet to be resolved. For instance, how does the flow structure change as both
 $L/d$
and
 $d/D$
vary? Is it followed by drastic changes in the fluid forces on the downstream cylinder? How is the frequency of vortex shedding from the downstream cylinder influenced by that from the upstream one? How should the flow be classified? What are the characteristics of the fluid dynamics compared with those associated with two identical cylinders? This work aims to address these issues and to provide a systematic experimental study of this flow. The flow structure, predominant vortex shedding frequencies and
 $(L/d)_{c}$
, along with
 $C_{D}$
,
 $C_{D}^{\prime }$
,
 $C_{L}^{\prime }$
and
 $St$
, are all investigated as
 $L/d$
and
 $d/D$
are varied over 1.0–8.0 and 0.2–1.0 respectively, which cover all possible changes in the flow structure. Extensive measurements are made using hotwire, time-resolved particle imaging velocimetry (PIV), flow visualization, load cell and pressure scanner techniques.
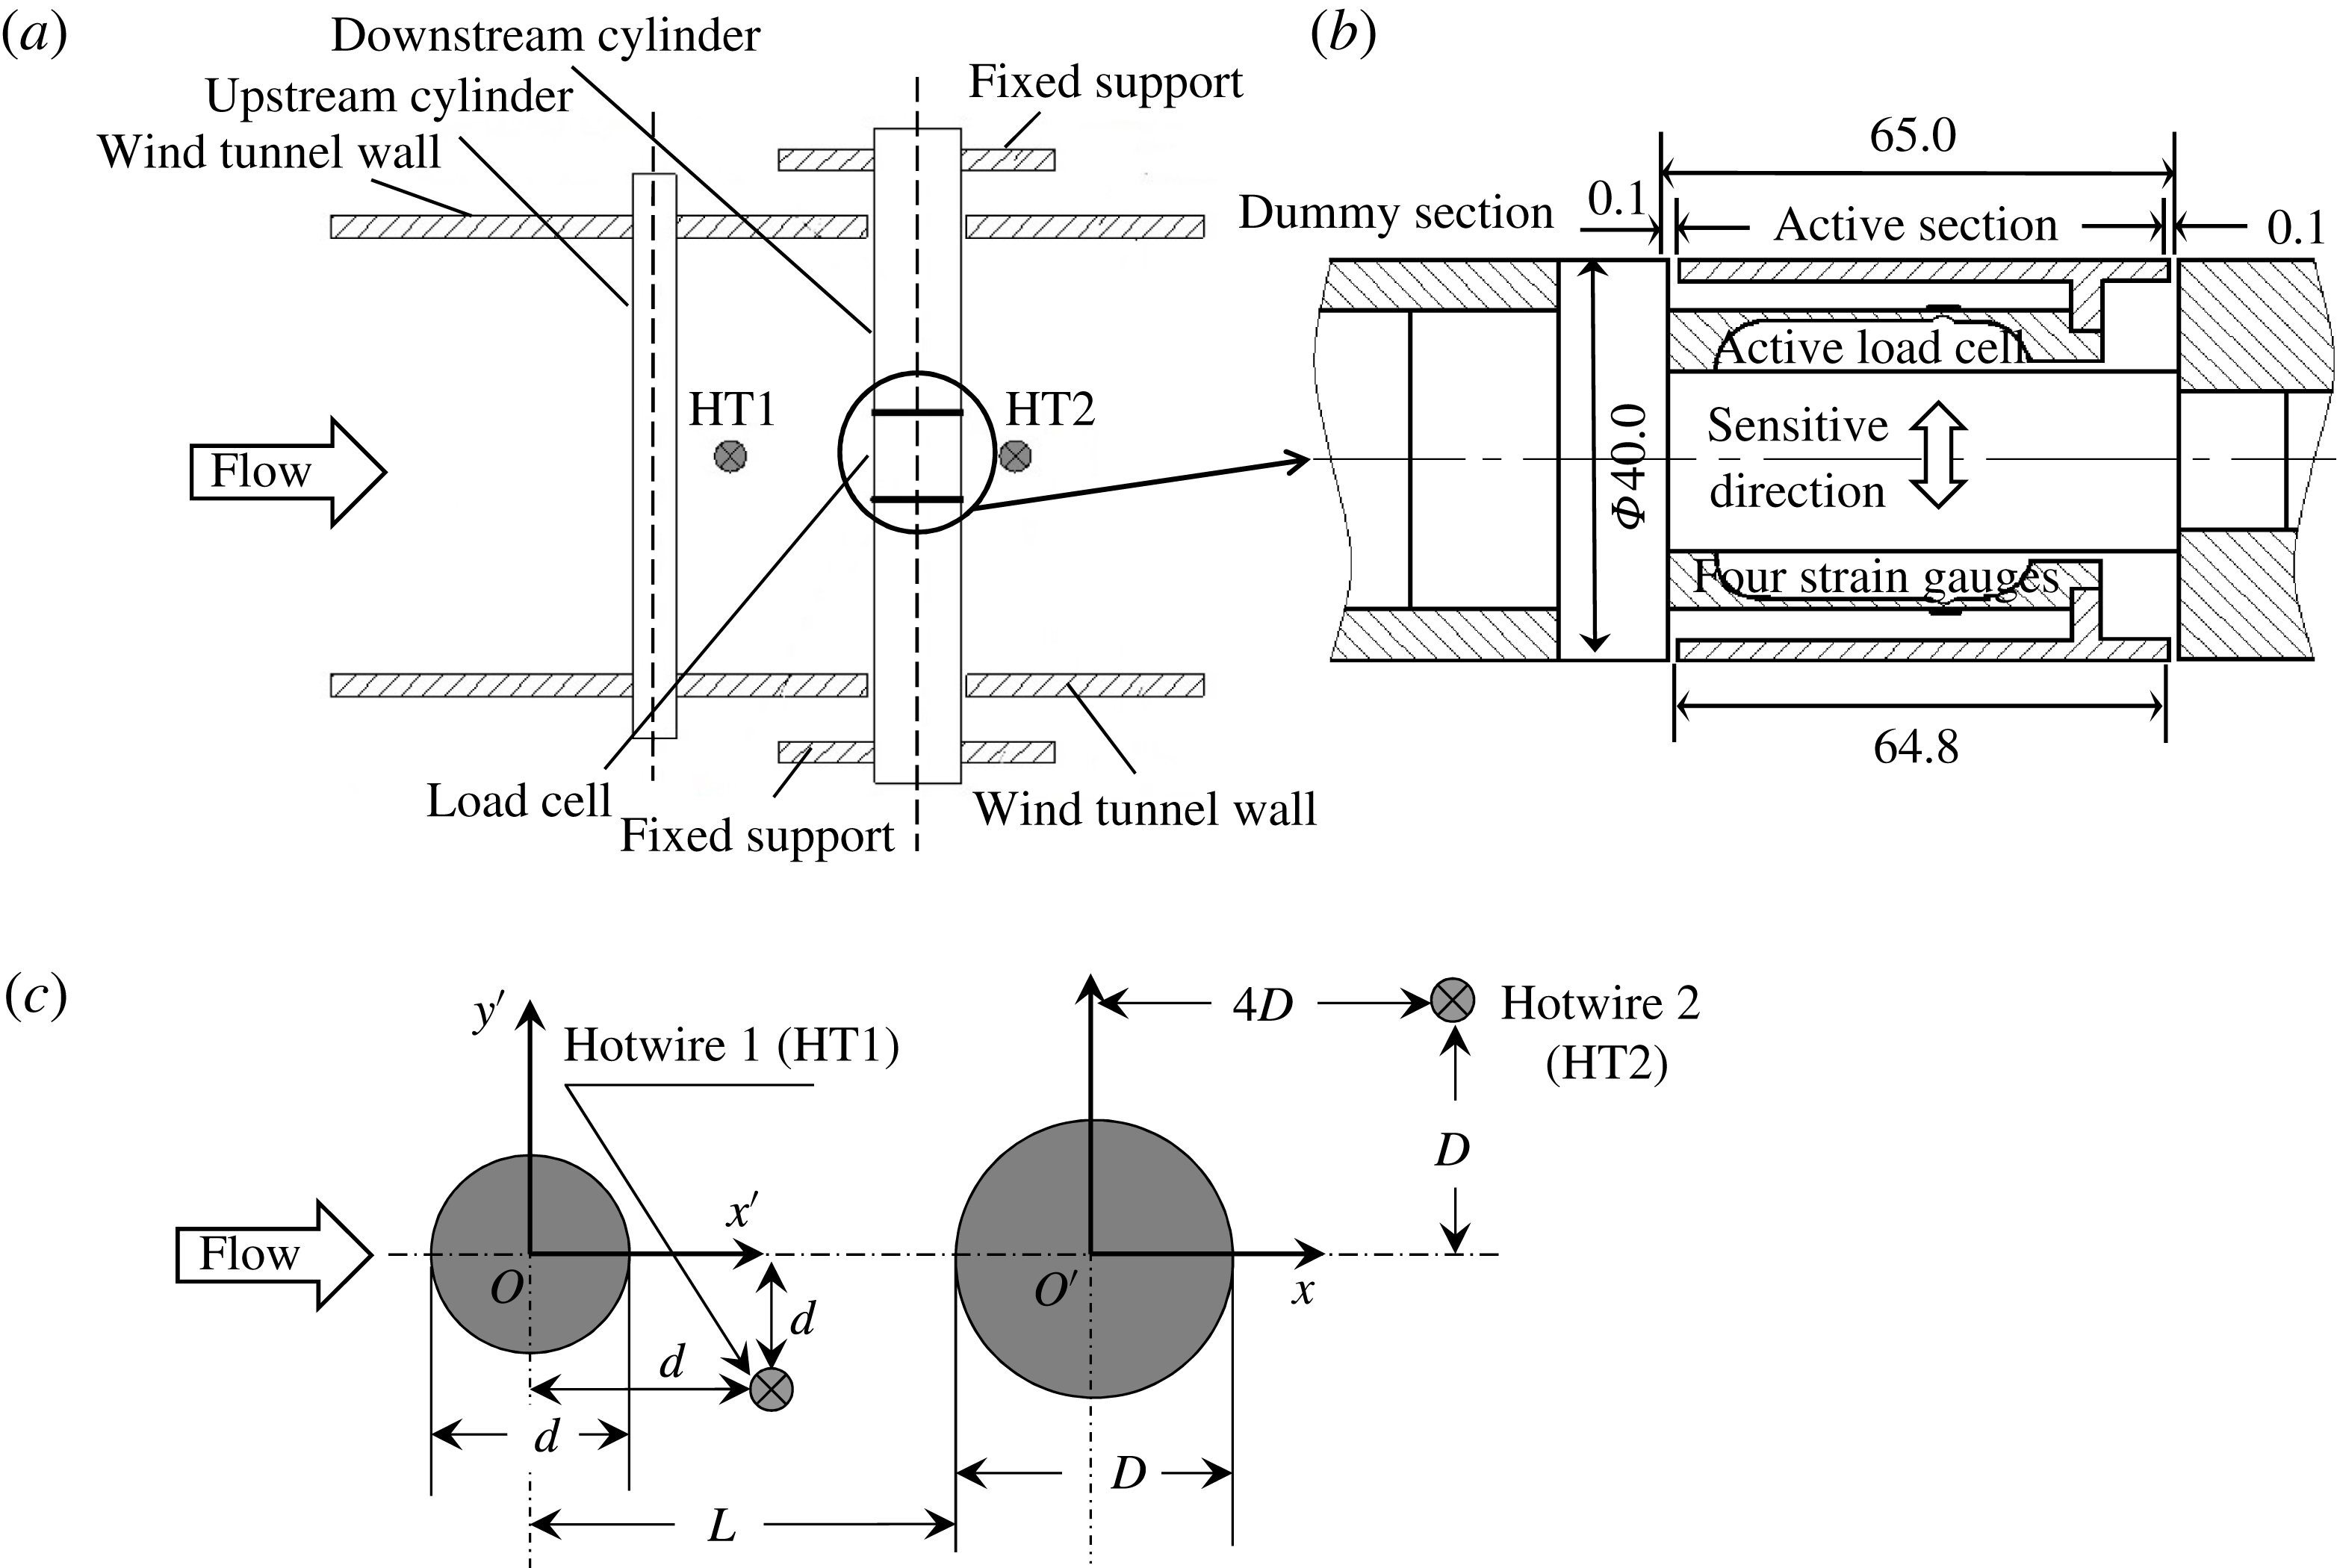
(a) Experimental set-up, (b) installation of the load cell inside the downstream cylinder and (c) definitions of symbols. Lengths are in millimetres.

2 Experimental set-up
2.1 Wind tunnel and cylinder models
Measurements were performed in a closed-circuit wind tunnel with a 5.5 m long test section of 0.8 m in width and 1.0 m in height. The free-stream velocity
 $U_{\infty }$
in the test section ranged from
 $1.5~\text{m}~\text{s}^{-1}$
to
 $50~\text{m}~\text{s}^{-1}$
. The arrangement of cylinder models is schematically presented in figure 1, along with the definition of symbols. Two Cartesian coordinate systems, (
 $x^{\prime }{-}O^{\prime }{-}y^{\prime }$
) and (
 $x{-}O{-}y$
), were defined such that the origins
 $O^{\prime }$
and
 $O$
were at the centres of the upstream and downstream cylinders respectively. The
 $U_{\infty }$
was measured using a Pitot tube connected to a micro-manometer (Furness FCO510, 0–20 mm
 $\text{H}_{2}\text{O}$
,
 $0{-}18~\text{m}~\text{s}^{-1}$
), with an uncertainty of less than 2 %. The downstream cylinder was hollow, made of aluminium, with outer and inner diameters of 40 and 24 mm respectively, and its diameter
 $D$
was fixed at 40 mm. The cylinder was mounted on an external frame detached from the wind tunnel in order to minimize the effect of the wind tunnel vibration on force measurements. A number of upstream-cylinder diameters were used, namely 8, 16, 24, 32 and 40 mm, corresponding to
 $d/D=0.2$
, 0.4, 0.6, 0.8 and 1.0 respectively. While the cylinders of
 $d=8$
and 16 mm were made of brass, those of
 $d=24$
, 32 and 40 mm were made of acrylic glass. The spacing ratio
 $L/d$
between the cylinders was systematically varied from 1.0 to 8.0. Both cylinders were placed horizontally in the midspan and spanned the full width of the test section, resulting in a maximum blockage ratio of 4 % and a minimum aspect ratio of 20. Experiments were carried out at
 $U_{\infty }=16~\text{m}~\text{s}^{-1}$
, at which the longitudinal turbulence intensity
 $T_{u}=0.3\,\%$
, corresponding to
 $Re(\equiv U_{\infty }D/\unicode[STIX]{x1D708})=4.27\times 10^{4}$
, where
 $\unicode[STIX]{x1D708}$
is the kinematic viscosity of air.
2.2 Strouhal number and force measurement
Two single hotwire probes (Dantec 55P01) HT1 and HT2 were placed in the gap (
 $x^{\prime \ast }=x^{\prime }/d=1.0$
,
 $y^{\prime \ast }=y^{\prime }/d=-1.0$
) between the cylinders and behind (at
 $x^{\ast }=x/D=4.0$
,
 $y^{\ast }=y/D=1.0$
) the downstream cylinder respectively to measure the streamwise velocity fluctuations
 $u_{1}$
and
 $u_{2}$
, from which the vortex shedding frequencies may be extracted. The sensing elements made of tungsten wire (Pt-10 % Rh) were each
 $0.5~\unicode[STIX]{x03BC}\text{m}$
in diameter and 1.25 mm in length. The probe holder was mounted perpendicularly to the wake-centre plane to minimize the disturbance to flow. The signals were captured at a sampling frequency of 1.5 kHz (cutoff frequency
 $=$
1.0 kHz) over a sampling duration of 30 s. The power spectral density functions,
 $E_{u1}$
and
 $E_{u2}$
, of
 $u_{1}$
and
 $u_{2}$
were calculated using a fast Fourier transform algorithm. Following Zhou et al. (Reference Zhou, Du, Mi and Wang2012), the frequency resolution in the power spectra was estimated to be 0.36 Hz, resulting in an uncertainty of approximately
 $\pm 3\,\%$
in the estimate of
 $St$
in an isolated single cylinder wake.
The fluid forces were measured over a small spanwise length of the cylinders using a load cell system (Alam, Sakamoto & Zhou Reference Alam, Sakamoto and Zhou2005). The downstream cylinder had an active section built in with spanwise length
 $L_{0}=1.62D(=64.8~\text{mm})$
and two dummy parts. The active section, placed between the two dummy sections, was at the midspan of the cylinder, installed with a load cell consisting of four strain gauges (ZEMIC Model SB3.8-120-P-2), two on the upper and two on the lower side of the load cell beam (figure 1
b). The gap between the active and dummy sections was 0.1 mm. The gauges were connected to form a full Wheatstone bridge. As a result, the output voltage
 $e_{0}=K_{s}\unicode[STIX]{x1D700}E_{e}$
, where
 $K_{s}$
was the preset gauge factor of the strain amplifier,
 $\unicode[STIX]{x1D700}$
was the bending strain and
 $E_{e}$
was the excitation voltage. The load cell was calibrated to determine the quantitative relation between the output voltage and the applied force
 $F$
. The output–input relation was linear, giving a calibration factor of
 $K=11.13~\text{mV}~\text{g}^{-1}$
. The natural frequency of the load cell was 808 Hz, 8–16 times greater than the frequency of the fluctuating lift. This natural frequency needs to be at least four times that of the dominant force frequency to ensure a good measurement accuracy (So & Savkar Reference So and Savkar1981). The vortex shedding frequency was 50–94 Hz, depending on
 $d/D$
and
 $L/d$
. As such, the fluctuating fluid forces were captured without the association of any resonant problem. The end effects on the measured force were negligibly small, as the force measurements were made only on the instrumented midsection of
 $1.62D$
in length. The force coefficients are calculated by
 $$\begin{eqnarray}\displaystyle & \displaystyle C_{D}=\frac{F_{D}}{0.5\unicode[STIX]{x1D70C}U_{\infty }^{2}L_{0}D}, & \displaystyle\end{eqnarray}$$
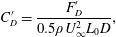 $$\begin{eqnarray}\displaystyle & \displaystyle C_{D}^{\prime }=\frac{F_{D}^{\prime }}{0.5\unicode[STIX]{x1D70C}U_{\infty }^{2}L_{0}D}, & \displaystyle\end{eqnarray}$$
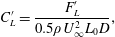 $$\begin{eqnarray}\displaystyle & \displaystyle C_{L}^{\prime }=\frac{F_{L}^{\prime }}{0.5\unicode[STIX]{x1D70C}U_{\infty }^{2}L_{0}D}, & \displaystyle\end{eqnarray}$$
where
 $F_{D}$
,
 $F_{D}^{\prime }$
and
 $F_{L}^{\prime }$
are the time-averaged drag, fluctuating drag (root mean square (r.m.s.) value) and fluctuating lift forces respectively.
2.3 Pressure measurements
The pressure distribution around the downstream cylinder was captured via 32 pressure taps. Each pressure tap was 0.8 mm in diameter. Each two adjacent taps were spanwise-offset by 1 mm to minimize their possible interference, producing a spiral tap distribution with a spanwise separation of 32 mm between the first and last taps, which corresponded to the same azimuthal position and hence measured the same pressure. The taps were connected to a piezo-resistive pressure scanner (Pressure Systems DTC Initium
 $+$
ESP-32HD) with a range of
 $\pm 2.5~\text{kPa}$
. The scanner output was calibrated to give a reading of 6.22 V for 1 kPa of applied pressure. The pressure scanner responded to pressure fluctuations of up to 625 Hz. The ensuing phase lag was negligibly small.
2.4 Flow measurements
Particle imaging velocimetry and smoke visualization measurements were conducted in the same wind tunnel. A Dantec high-frequency PIV system (Litron LDY 304-PIV, Nd:YLF), with a maximum trigger rate of 727 Hz for the double-frame mode, was used to measure the flow in the (
 $x$
,
 $y$
) plane between and behind the cylinders. Both the cylinder surface and the test section wall hit by the laser sheet were painted black to minimize reflection noise. The flow was seeded by particles, generated from paraffin oil using a TSI 9307-6 particle generator, with a particle size of approximately
 $1.0~\unicode[STIX]{x03BC}\text{m}$
in diameter. Flow illumination was provided by two pulsed laser sources of 527 nm in wavelength, each with a maximum energy output of 30 mJ per pulse. One CCD camera (Phantom V641, double frames, with a resolution of
 $2560\times 1600$
pixels) was used to capture particle images. A Dantec 80N77 timer box was used to synchronize the laser pulses and the image-taking. An adaptive PIV method with an interrogation window of
 $32\times 32$
pixels was applied for image processing with a 50 % overlap in each direction. A total of 800 images were captured for each flow configuration, i.e. one combination of
 $d/D$
and
 $L/d$
, for calculation of the time-averaged streamwise and cross-stream velocities (
 $\bar{u}^{\ast }$
and
 $\bar{v}^{\ast }$
) and their r.m.s. values (
 $u_{rms}^{\ast }$
and
 $v_{rms}^{\ast }$
). In this paper, a superscript asterisk denotes normalization by
 $D$
and/or
 $U_{\infty }$
. It has been confirmed that
 $\bar{u}^{\ast }$
,
 $\bar{v}^{\ast }$
,
 $u_{rms}^{\ast }$
and
 $v_{rms}^{\ast }$
measured at
 $(x^{\ast },y^{\ast })=(1.41,1.62)$
, where the maximum
 $u_{rms}^{\ast }$
occurs in the wake of an isolated single cylinder (Alam, Zhou & Wang Reference Alam, Zhou and Wang2011), were all converged to their asymptotic values, with a maximum departure of 2.8 %, when the number of images reached 500.
The PIV system was also used for smoke visualization of the flow structure separately between and behind the cylinders. Smoke generated from paraffin oil was released from two pinholes of 0.8 mm in diameter at the midspan of each cylinder, symmetrically drilled at
 $\pm 30^{\circ }$
for the upstream cylinder or
 $\pm 120^{\circ }$
for the downstream cylinder, measured from the nominal forward stagnation point. The particle images were taken using the same CCD camera (Phantom V641).
3 Flow classification
3.1 Flow structure between cylinders
The flow structures for the presently considered
 $d/D$
and
 $L/d$
ranges are first studied by examining the images taken from extensive flow visualization experiments. The shear layers separating from the upstream cylinder reattach on the downstream cylinder given
 $L/d<2.5{-}6.0$
, depending on
 $d/D$
, but roll up between the cylinders given
 $L/d>3.0{-}7.0$
, again depending on
 $d/D$
. The former and latter correspond to the reattachment and co-shedding regimes respectively. Presently, the smallest
 $L/d$
examined is 1.0. At the high
 $Re=4.27\times 10^{4}$
examined, extended (overshoot) flow does not occur even for the largest examined
 $d/D~(=1.0)$
with zero gap spacing, i.e.
 $L/d=0.5$
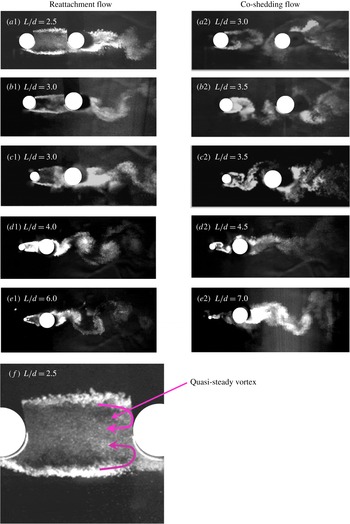
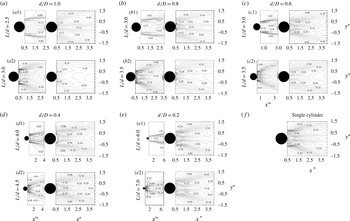
(e.g. Xu & Zhou Reference Xu and Zhou2004; Alam Reference Alam2014). Figure 2 presents the flow structures around the two cylinders for various values of
 $d/D$
near
 $(L/d)_{c}$
, where the flow changes from the reattachment to the co-shedding regime. For
 $d/D=1.0$
, the shear layers separated from the upstream cylinder reattach on the downstream cylinder at
 $L/d=2.5$
(figure 2
a1) but roll up in the gap between the cylinders at
 $L/d=3.0$
(figure 2
a2). Evidently,
 $(L/d)_{c}$
is between 2.5 and 3.0. An intermittent switch between the reattachment and co-shedding flow structure may occur at
 $(L/d)_{c}$
(Zdravkovich Reference Zdravkovich1977; Igarashi Reference Igarashi1981). The critical spacing
 $(L/d)_{c}$
occurs between
 $L/d=3.0$
and 3.5 for
 $d/D=0.6{-}0.8$
(figure 2
b1, b2, c1, c2), between
 $L/d=4.0$
and 4.5 for
 $d/D=0.4$
(figure 2
d1, d2) and between
 $L/d=6.0$
and 7.0 for
 $d/D=0.2$
(figure 2
e1, e2). It is clear that the
 $(L/d)_{c}$
associated with the bistable flow state is prolonged as
 $d/D$
is reduced. Ljungkrona et al. (Reference Ljungkrona, Norberg and Sunden1991), Chyu & Rockwell (Reference Chyu and Rockwell1996) and Lin, Yang & Rockwell (Reference Lin, Yang and Rockwell2002) observed that
 $(L/d)_{c}$
is highly dependent on
 $Re$
and
 $T_{u}$
, both of which enhance the development of the Kelvin–Helmholtz vortices in the shear layer. A higher
 $Re$
or
 $T_{u}$
corresponds to a smaller
 $(L/d)_{c}$
. Presently, the Reynolds number is constant based on
 $D$
(unchanged) but becomes smaller, if based on
 $d$
, for a smaller
 $d/D$
. This explains why a smaller
 $d/D$
corresponds to a larger
 $(L/d)_{c}$
. More discussion will be provided later.
Visualized flow structures at (a)
 $d/D=1.0$
, (b) 0.8, (c) 0.6, (d) 0.4 and (e) 0.2. (f) Zoomed-in view of flow in the gap for (a1).

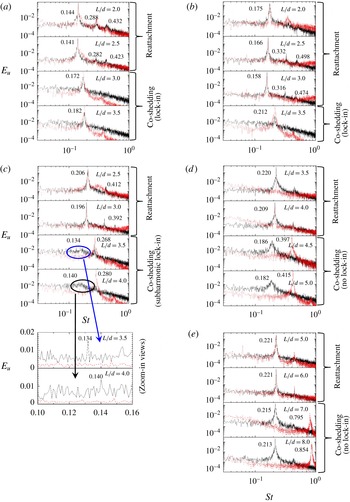
The power spectral density functions
 $E_{u1}$
(dotted red line) and
 $E_{u2}$
(solid black line) for various values of
 $L/d$
: (a)
 $d/D=1.0$
, (b) 0.8, (c) 0.6, (d) 0.4 and (e) 0.2.

In the reattachment case (figure 2
a1, b1, c1, d1, e1), the vortices behind the downstream cylinder at a given
 $L/d({<}(L/d)_{c})$
become a Kármán-vortex-street-like alternate pattern as
 $d/D$
decreases. This is because, given a smaller
 $d/D$
, the downstream cylinder is less interrupted and blockaded by the upstream cylinder. On the other hand, the gap shear layer reattachments are more symmetric at a smaller
 $d/D$
. The major features of the flow dependence on
 $d/D$
can be summarized as follows. With a decrease in
 $d/D$
from 1.0 to 0.2, (i) the upstream-cylinder wake width shrinks gradually, (ii) the shear layer reattachment position shifts towards the forward stagnation point and (iii) alternating vortices shed from the upstream cylinder for the co-shedding flow are smaller in size when impinging upon the downstream cylinder.
3.2 Vortex shedding frequencies
The dependence of the flow structure on
 $d/D$
and
 $L/d$
may be further examined based on the power spectral density functions
 $E_{u1}$
and
 $E_{u2}$
(figure 3), where the predominant Strouhal numbers are marked. It should be noted that part of the reattached shear layer in the reattachment regime rolls up between the cylinders, generating a quasi-steady vortex in the gap (figure 2
a1, b1, c1, d1, e1 and figure 2
f), and the other part continues downstream, forming the vortex shed from the downstream cylinder. The
 $u_{1}$
thus fluctuates, albeit weakly, following its shedding. The
 $St$
jumps from 0.141 to 0.172 as
 $L/d$
increases from 2.5 to 3.0 for
 $d/D=1.0$
(figure 3
a) and from 0.158 to 0.212 as
 $L/d$
changes from 3.0 to 3.5 for
 $d/D=0.8$
(figure 3
b). Such a jump results from a change from the reattachment to co-shedding flow with increasing
 $L/d$
(figure 2
a,b), while the higher
 $St$
is smaller at
 $d/D=1.0$
than the Strouhal number
 $St_{0}~(=0.197)$
in the wake of an isolated cylinder but becomes higher at
 $d/D=0.8$
. In the co-shedding case (i.e.
 $L/d\geqslant 3.0$
), the two cylinders at
 $d/D=1.0$
generate vortices of identical
 $St$
, slightly smaller than
 $St_{0}$
since the upstream-cylinder-generated convective vortices trigger vortex shedding from the downstream cylinder, resulting in the same
 $St$
. That is, the vortex sheddings from the two cylinders are locked in with each other (Sakamoto & Haniu Reference Sakamoto and Haniu1988; Alam & Zhou Reference Alam and Zhou2008). A single value of
 $St~(=0.212)$
, slightly larger than
 $St_{0}$
, is again observed at
 $d/D=0.8$
due to the lock-in phenomenon. One may wonder why this
 $St$
is larger than
 $St_{0}$
. Since the upstream-cylinder diameter is now small, i.e.
 $d=0.8D$
, its shedding frequency is thus higher given the same incident flow velocity. As a matter of fact, the Strouhal number based on
 $d$
is
 $0.212\times 0.8\approx 0.17$
, almost the same as that in the case of
 $d/D=1.0$
. Alam & Sakamoto (Reference Alam and Sakamoto2005) found that, in the co-shedding regime, a change in the upstream-cylinder cross-section of the same characteristic width may be associated with a different vortex shedding frequency, and the frequency of vortex shedding from the downstream cylinder is accordingly modified due to the lock-in phenomenon, adjusting itself to the upstream vortex frequency. On the other hand, a change in the downstream-cylinder cross-section causes no difference in the frequency of vortex shedding from either of the cylinders. In other words, the upstream cylinder controls the fluid dynamic instability in the wake of two tandem cylinders.
At
 $d/D=0.6$
(figure 3
c), both
 $St$
values are identical to each other in the reattachment case, but two distinct values, e.g. 0.134 and 0.268 for
 $L/d=3.5$
, as shown in the zoomed-in views, are detected behind the downstream cylinder in the co-shedding flow. In the latter case, the upstream
 $St$
is 0.268, double and equal to the low and high
 $St$
values measured behind the downstream cylinder respectively, suggesting that the vortex frequency and its subharmonic behind the cylinders are both locked in with the frequency in the gap. The higher
 $St$
measured behind the downstream cylinder is faintly identifiable at
 $L/d=4.0$
, as shown in the zoomed-in views. It seems that the lock-in of the fundamental vortex frequency is weaker than that of the subharmonic. The results conform to Alam & Zhou’s (Reference Alam and Zhou2008) finding from the flow visualization data at
 $L/d=5.5$
that the two types of lock-in occur intermittently.
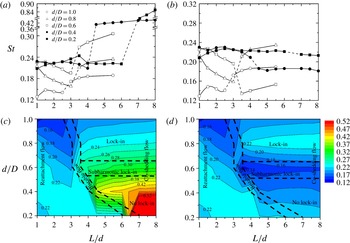
The dependence on
 $L/d$
and
 $d/D$
of
 $St$
(a) between the cylinders and (b) behind them. (c,d) The isocontours of
 $St$
corresponding to (a) and (b) respectively. The dashed lines in (a) and (b) indicate the critical spacing
 $(L/d)_{c}$
that separates the reattachment and co-shedding regimes, while those in (c) and (d) represent the boundaries between flow regimes.

At
 $d/D=0.4$
and 0.2 (figure 3
d,e), the
 $St$
measured between the two cylinders is identical to that behind them in the reattachment case but not in the co-shedding case; that is, there is no lock-in, which is different from the situation at
 $d/D=0.6$
. The fundamental
 $St$
values are 0.268 and 0.134 between and behind cylinders respectively for
 $L/d=3.5$
and
 $d/D=0.6$
, 0.397 and 0.186 respectively for
 $L/d=4.5$
and
 $d/D=0.4$
, and 0.795 and 0.215 respectively for
 $L/d=7.0$
and
 $d/D=0.2$
. Both Strouhal numbers rise with decreasing
 $d/D$
. The rise in the upstream
 $St$
is due to a decrease in diameter. On the other hand, the rise in the downstream
 $St$
results from an increased flow velocity in the gap of the cylinders as a smaller upstream cylinder produces less blockage, implying a higher flow velocity in the gap. It should be noted that the upstream
 $St$
, when normalized by
 $d$
instead of
 $D$
, becomes 0.161, 0.159 and 0.159 for
 $(d/D,L/d)=(0.6,3.5)$
, (0.4, 4.5) and (0.2, 7.0) respectively, comparable to 0.172 and 0.170 at
 $(d/D,L/d)=(0.8,3.5)$
and (1.0, 3.0). Given
 $d/D=1.0$
,
 $St$
rises slowly and approaches
 $St_{0}~({\approx}0.2)$
with increasing
 $L/d~({>}(L/d)_{c})$
(Igarashi Reference Igarashi1981; Ohya, Okajima & Hayashi Reference Ohya, Okajima, Hayashi and Cheremisinoff1989; Xu & Zhou Reference Xu and Zhou2004). For small
 $L/d~({>}(L/d)_{c})$
in the co-shedding regime, the presence of the downstream cylinder influences the vortex shedding from the upstream cylinder, causing
 $St<St_{0}$
, due to a feedback mechanism (Bearman Reference Bearman1984). The effect of the downstream cylinder on the vortex shedding from the upstream cylinder diminishes as
 $L/d$
increases, and
 $St$
measured between and behind the cylinders becomes independent of
 $L/d$
(Ohya et al.
Reference Ohya, Okajima, Hayashi and Cheremisinoff1989).
The alternate vortex impingement upon the downstream cylinder produces essentially a quasi-periodic excitation, thus locking in vortex shedding from the downstream cylinder. The level of excitation may be linked to the size and strength of the impinging vortices. The present data demonstrate that the vortex shedding from the downstream cylinder is completely locked in with this excitation for
 $d/D=1.0{-}0.8$
, but only intermittently for
 $d/D=0.6$
because of the weakened excitation. The excitation is too weak to get vortex shedding from the downstream cylinder locked in for
 $d/D=0.2{-}0.4$
.
Figure 4(a,b) summarizes the dependence on
 $d/D$
and
 $L/d$
of the upstream and downstream Strouhal numbers. At
 $d/D=1.0$
, both Strouhal numbers reach a peak value of 0.149 at
 $L/d=1.5$
and then, with increasing
 $L/d$
, retreat to a minimum value of 0.141 at
 $L/d=2.5$
. They both then jump to 0.172 at
 $L/d=3.0$
, where co-shedding sets in, with slowly rising
 $St$
in the co-shedding regime as
 $L/d$
increases beyond 3.0. The dashed line in the figure indicates the value of
 $(L/d)_{c}$
that separates the reattachment and co-shedding regimes. At
 $d/D=0.8$
(figure 3
b),
 $St$
declines from 0.213 at
 $L/d=1.0$
to 0.158 at
 $L/d=3.0$
and then jumps to 0.212 at
 $L/d=3.5$
; it rises slowly in the co-shedding regime (
 $L/d\geqslant 3.5$
). In both regimes,
 $St$
measured between the cylinders remains identical to that behind them. A similar observation is made at
 $d/D=0.6$
in the reattachment regime (
 $L/d=1.0{-}3.0$
), where
 $St$
exhibits a variation very similar to that at
 $d/D=0.8$
except for a very small peak at
 $L/d=1.5$
as in the case of
 $d/D=1.0$
. Interestingly,
 $St$
jumps greatly at
 $(L/d)_{c}$
between the cylinders but drops behind them, in contrast to the large rise, both between and behind the cylinders, at
 $d/D=0.8{-}1.0$
. The changes in
 $St$
at
 $(L/d)_{c}$
are qualitatively the same at
 $d/D=0.2{-}0.4$
as at
 $d/D=0.6$
, although the drop behind the cylinders is milder.
The dependence of
 $St$
on
 $L/d$
and
 $d/D$
may be alternatively presented by the isocontours of
 $St$
(figure 4
c,d), which may reflect better the correlation between the two Strouhal numbers. It should be noted that
 $St$
is mostly below 0.52 except at
 $d/D=0.2$
and
 $L/d\geqslant 6.5$
, where
 $St=0.800{-}0.854$
(figure 4
a). The maximum value in the colour code of figure 4(c,d) is therefore set as 0.52 in order to see clearly the variation in
 $St$
for the range of small values. For a given
 $d/D$
,
 $St$
is less sensitive to
 $L/d$
in the co-shedding regime but more so in the reattachment regime, especially for
 $d/D=0.6{-}1.0$
. For a given
 $L/d$
, on the other hand, the
 $St$
in the reattachment regime increases as
 $d/D$
decreases from 1.0 to 0.6. The increase in
 $St$
is attributed to the fact that placing a small cylinder in front of a large one acts to reduce the combined bluffness of the two cylinders. In the reattachment regime, the two cylinders are connected by shear layers, behaving like a single elongated bluff body. For
 $d/D=1.0$
, the approaching flow confronts the front and trailing bodies both of the same width
 $D$
. On the other hand, for a smaller
 $d/D$
(e.g.
 $=0.6$
), the front width (
 $0.6D$
) is smaller than the trailing width (
 $1.0D$
). The combined body is more ‘streamlined’ for the latter than the former, thus producing a higher
 $St$
for the latter. With
 $d/D$
decreasing, the upstream-cylinder wake contracts in width (figure 2), leading to effectively a larger incident flow for the downstream cylinder.
We may classify the flow regimes in the phase plane of
 $d/D$
and
 $L/d$
based on the behaviour of the shear layer in the gap and the relationship between
 $St$
measured between the cylinders and that behind them. Depending on whether the shear layer separated from the upstream cylinder reattaches on the downstream cylinder or not, the flow may be divided into two regimes, i.e. reattachment and co-shedding flows (figure 4
c,d). The co-shedding regime is further subdivided into the lock-in, subharmonic lock-in and no lock-in regions based on the relationship between
 $St$
captured between the two cylinders and that behind them. In the reattachment regime, there is only one
 $St$
which declines with increasing
 $d/D$
. In the co-shedding regime, given
 $d/D$
and
 $L/d$
, the
 $St$
is the same between the cylinders as that behind them in the case of lock-in, but the former is double the latter in the subharmonic lock-in region. In the case of no lock-in, the former is much larger than the latter, by more than two times. The critical spacing
 $(L/d)_{c}$
associated with the bistable flow is prolonged with a decrease in
 $d/D$
.
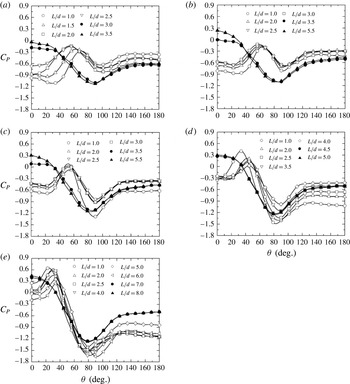
The distribution of the time-averaged pressure coefficient
 $C_{P}$
around the cylinder surface: (a)
 $d/D=1.0$
, (b) 0.8, (c) 0.6, (d) 0.4 and (e) 0.2.

4 Pressure and forces
4.1 Surface pressure
Information on the flow near the cylinder surface can be extracted from the distribution of the time-averaged pressure coefficient
 $C_{P}$
around the downstream cylinder at various values of
 $L/d$
and
 $d/D$
(figure 5), which may complement the discussion on flow in § 3. In the reattachment flow regime (open symbols),
 $C_{P}$
displays a peak, depending on
 $L/d$
, at
 $\unicode[STIX]{x1D703}=58^{\circ }{-}68^{\circ }$
for
 $d/D=1.0$
,
 $57^{\circ }{-}62^{\circ }$
for
 $d/D=0.8$
,
 $50^{\circ }{-}55^{\circ }$
for
 $d/D=0.6$
,
 $34^{\circ }{-}45^{\circ }$
for
 $d/D=0.4$
and
 $22^{\circ }{-}32^{\circ }$
for
 $d/D=0.2$
. The peak results from the reattachment of the upstream-cylinder shear layer on the downstream cylinder, and the reattachment point or angle declines for a smaller
 $d/D$
. In the reattachment regime,
 $C_{P}$
is negative for
 $d/D\geqslant 0.6$
around the entire cylinder surface, including the reattachment region, and becomes positive in the reattachment region at smaller
 $d/D$
. The negative
 $C_{P}$
around the entire cylinder surface suggests that the cylinder may have been immerged in the separation bubble of the upstream cylinder. At a given
 $L/d$
,
 $C_{P}$
at the reattachment point rises with a decrease in
 $d/D$
. At the same time, the reattachment position (peak) moves towards the forward stagnation point. Assuming the same velocity of the upstream-cylinder shear layer for all
 $d/D$
(Roshko Reference Roshko1955), the raised
 $C_{P}$
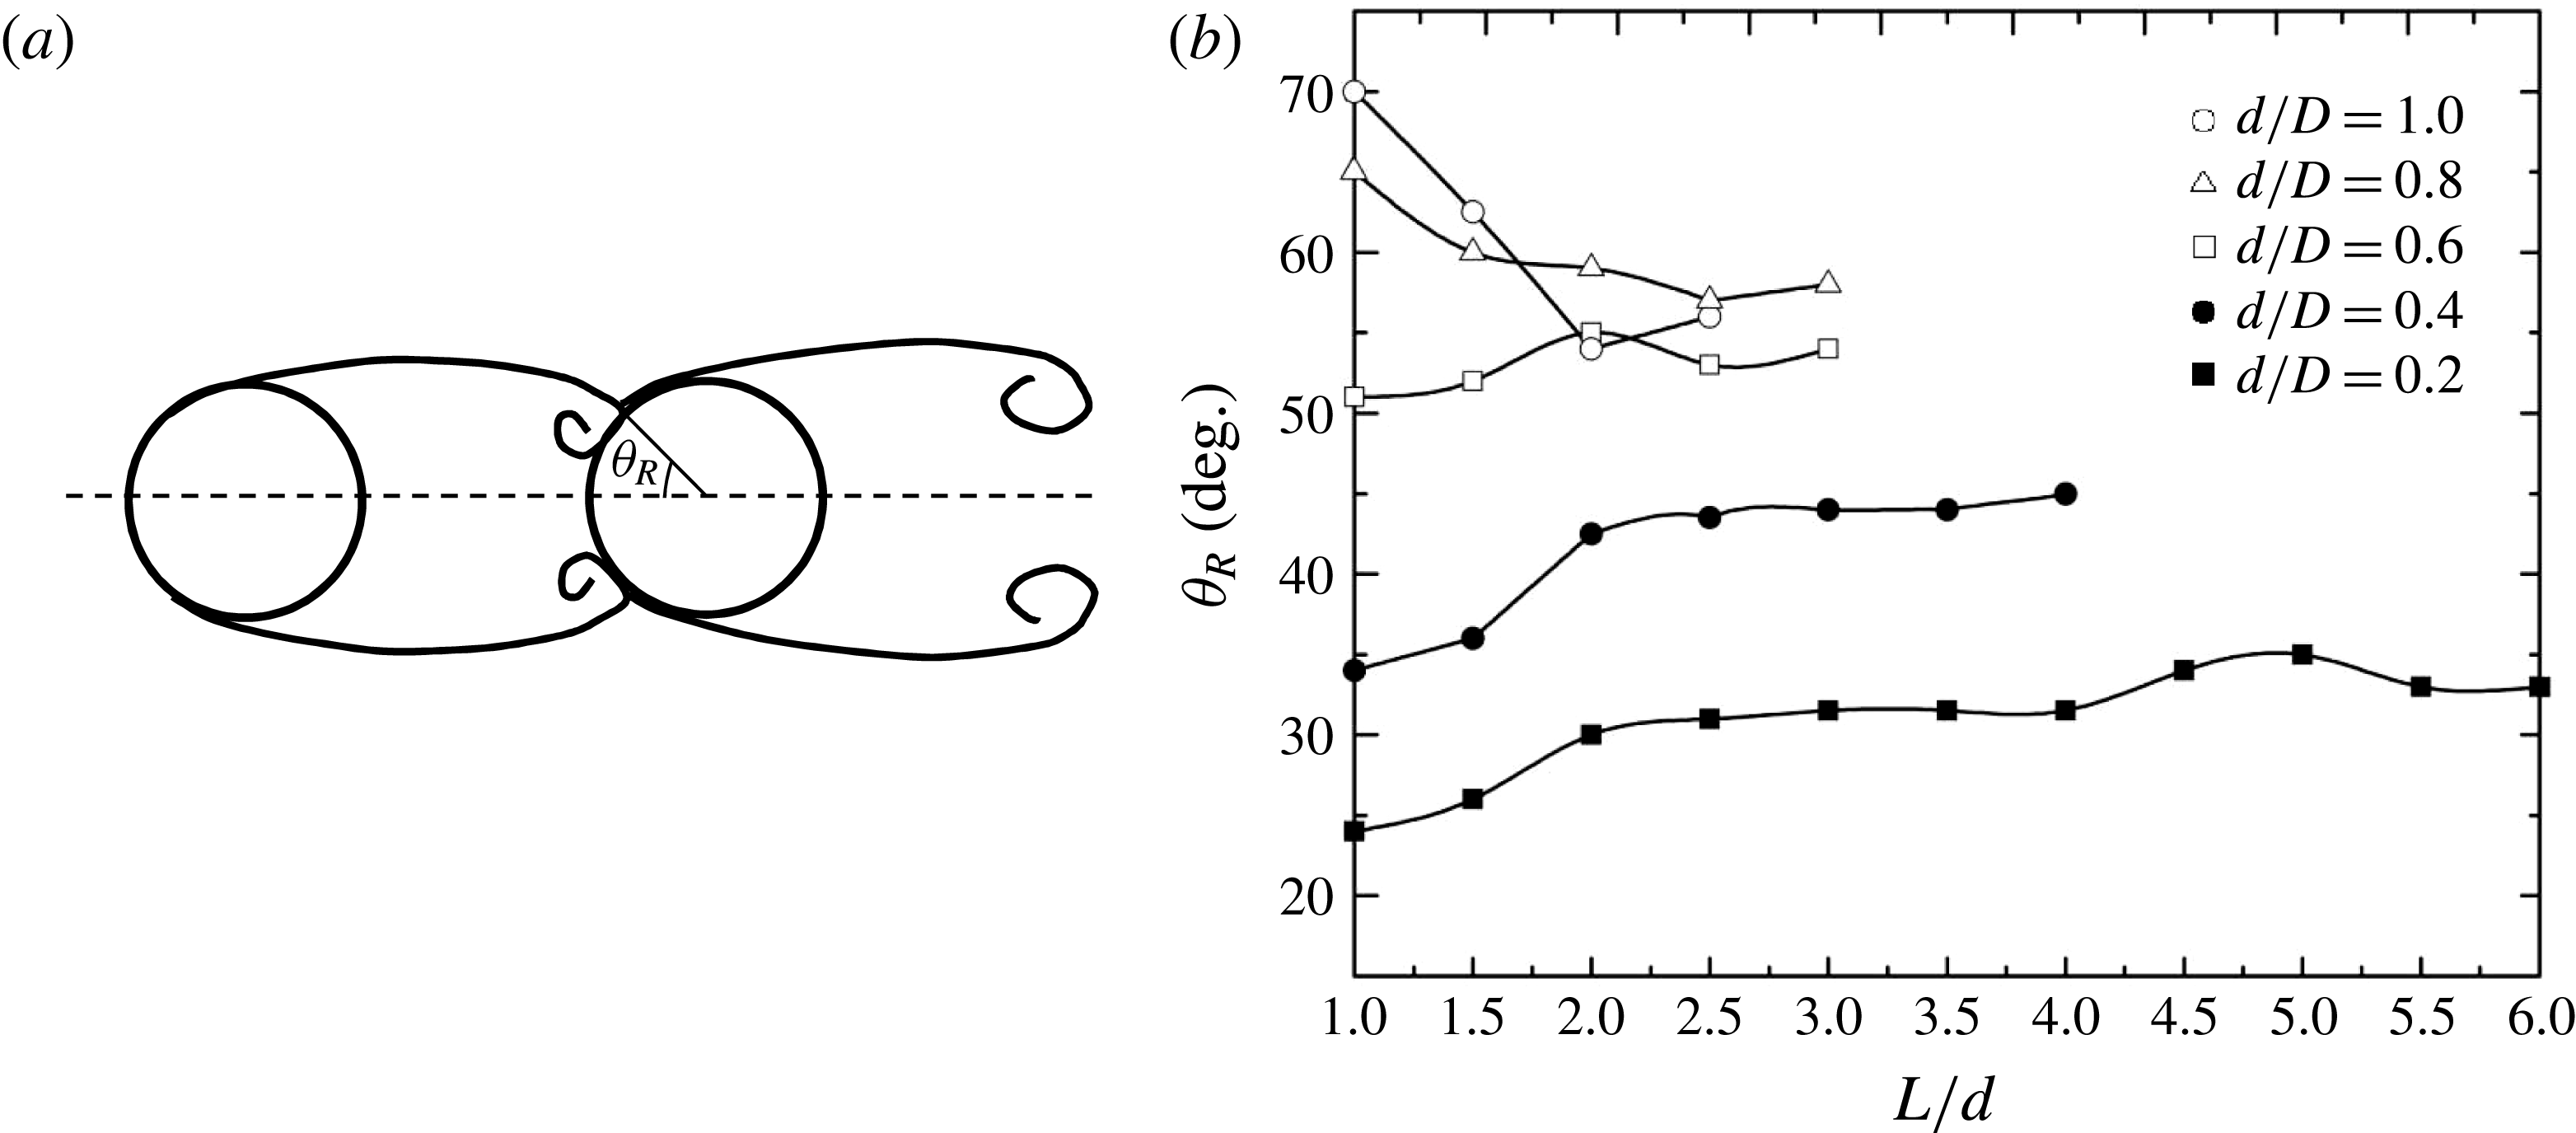
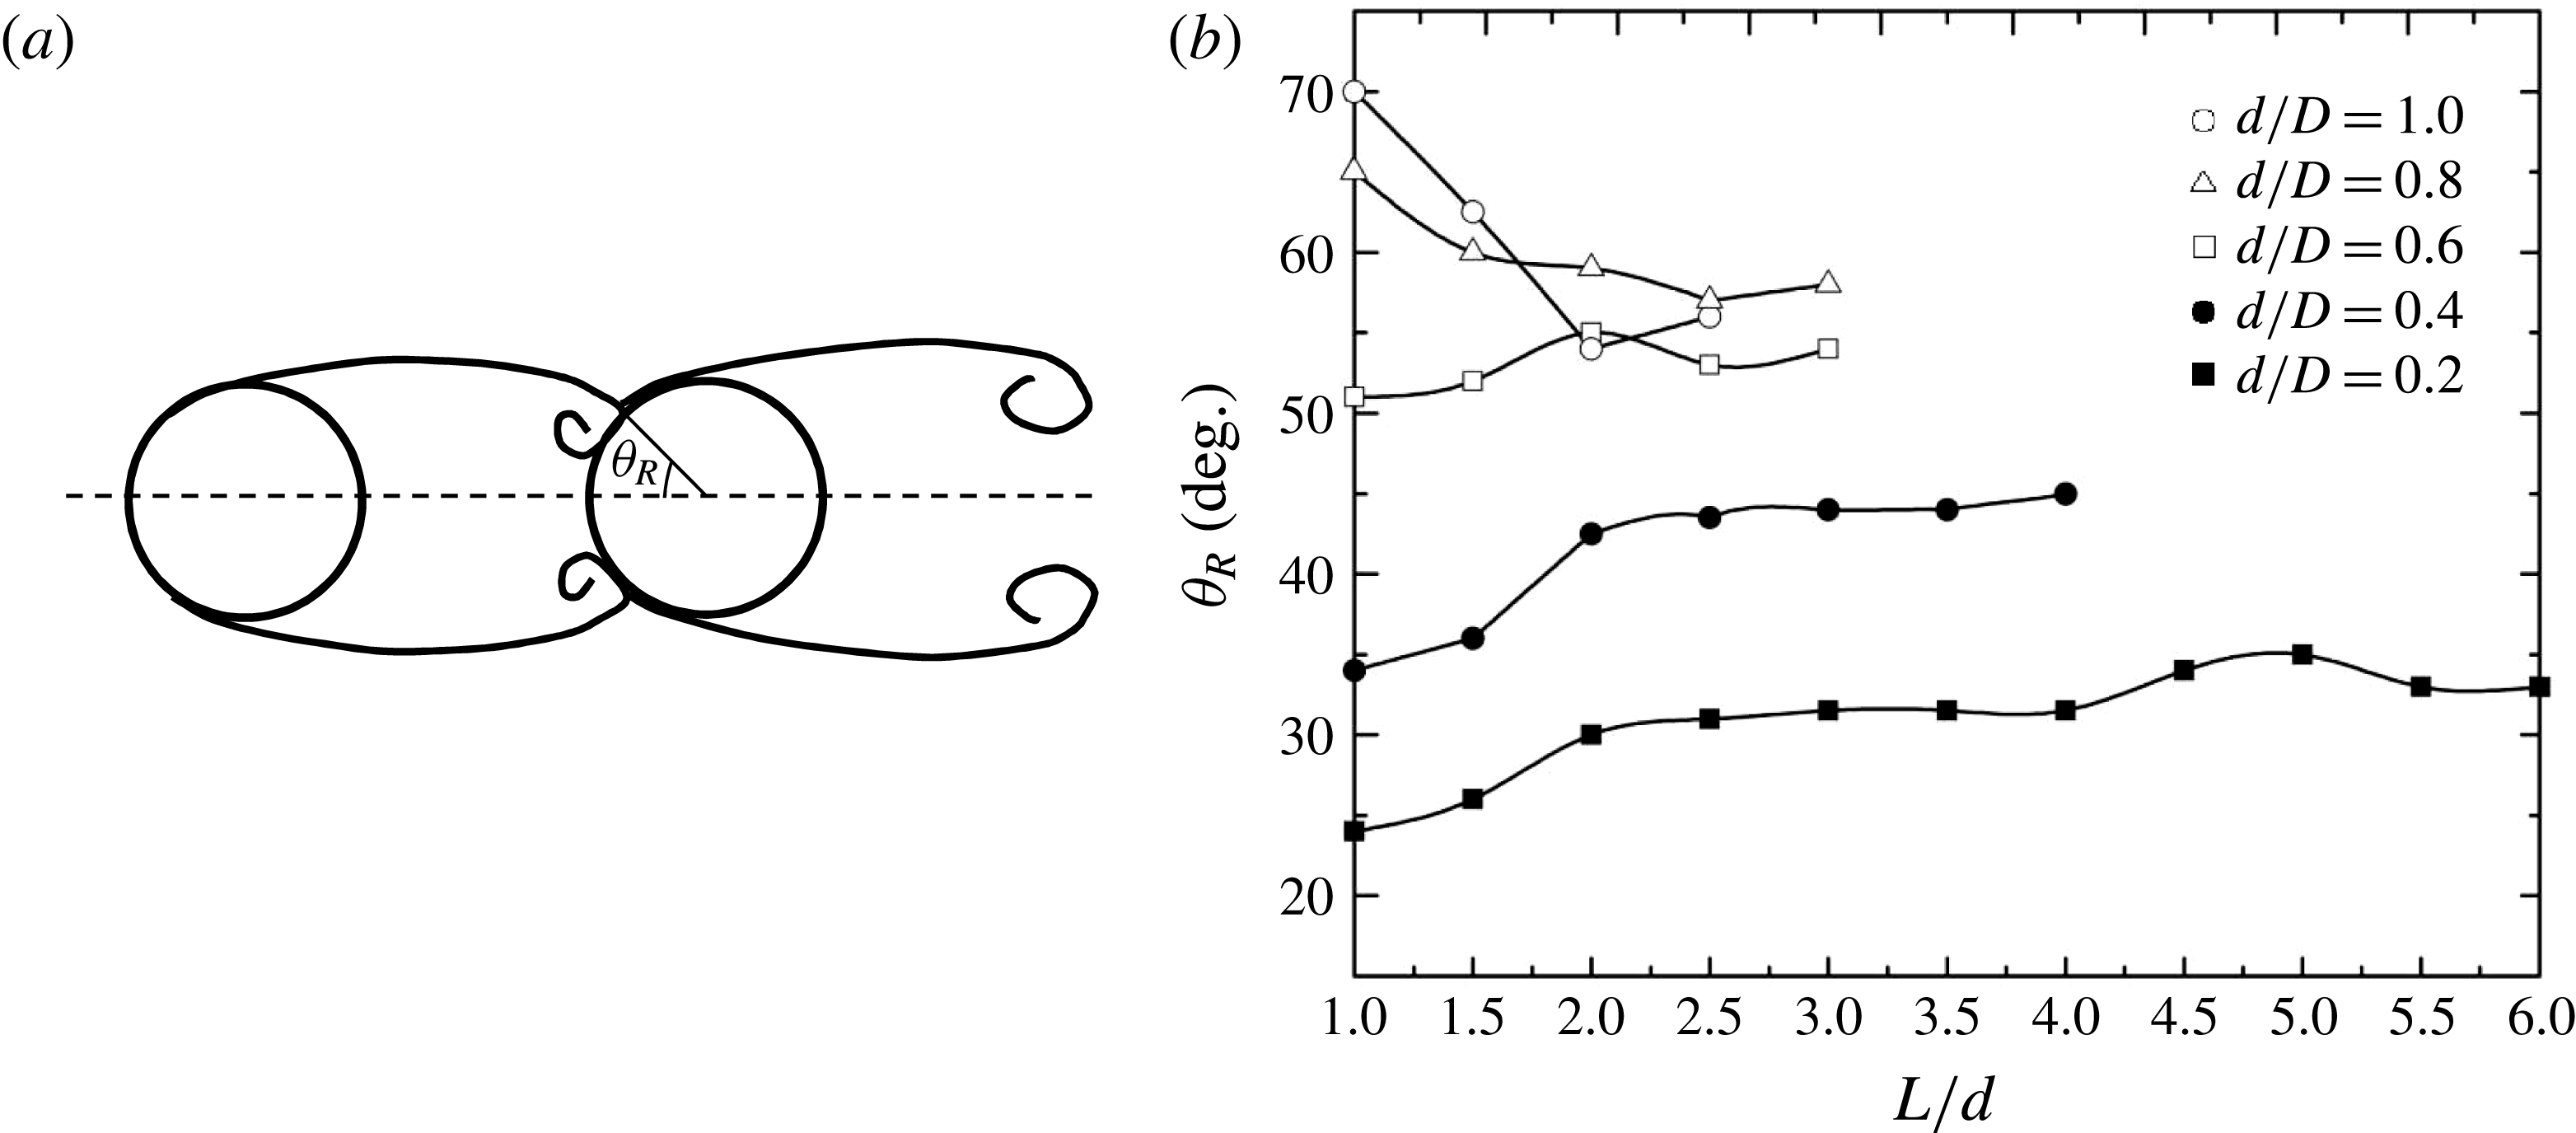
may result from the shear layer reattachment at a small incidence angle. This is because the incidence angle is reduced when the reattachment position shifts towards the forward stagnation point and the wake in the gap shrinks in width. The reattachment position
 $\unicode[STIX]{x1D703}_{R}$
extracted from the
 $C_{P}$
distribution is plotted against
 $d/D$
and
 $L/d$
in figure 6. In general, with an increase in
 $L/d$
,
 $\unicode[STIX]{x1D703}_{R}$
moves towards the forward stagnation point for
 $d/D=1.0{-}0.8$
and towards the backward stagnation point for
 $d/D=0.4{-}0.2$
. At
 $d/D=0.6$
,
 $\unicode[STIX]{x1D703}_{R}$
exhibits mixed behaviour, shifting backward and forward for
 $L/d<2.0$
and
 ${>}2.0$
respectively.
(a) The definition of the reattachment angle
 $\unicode[STIX]{x1D703}_{R}$
. (b) The variation in
 $\unicode[STIX]{x1D703}_{R}$
with
 $L/d$
.
In the co-shedding regime, a smaller
 $d/D$
is accompanied by a larger
 $C_{P}$
at the forward stagnation point (figure 5, solid symbols), reconfirming the assertion that the smaller the
 $d/D$
is, the larger the flow velocity is in the gap of the cylinders. It should be noted that, when the reattachment flow changes to co-shedding,
 $C_{P}$
at the base of the cylinder drops for
 $d/D=1.0{-}0.4$
and rises for
 $d/D=0.2$
. The drop and rise in
 $C_{P}$
at the base may contribute to a change in drag at
 $(L/d)_{c}$
, as confirmed in next subsection.
4.2 Forces
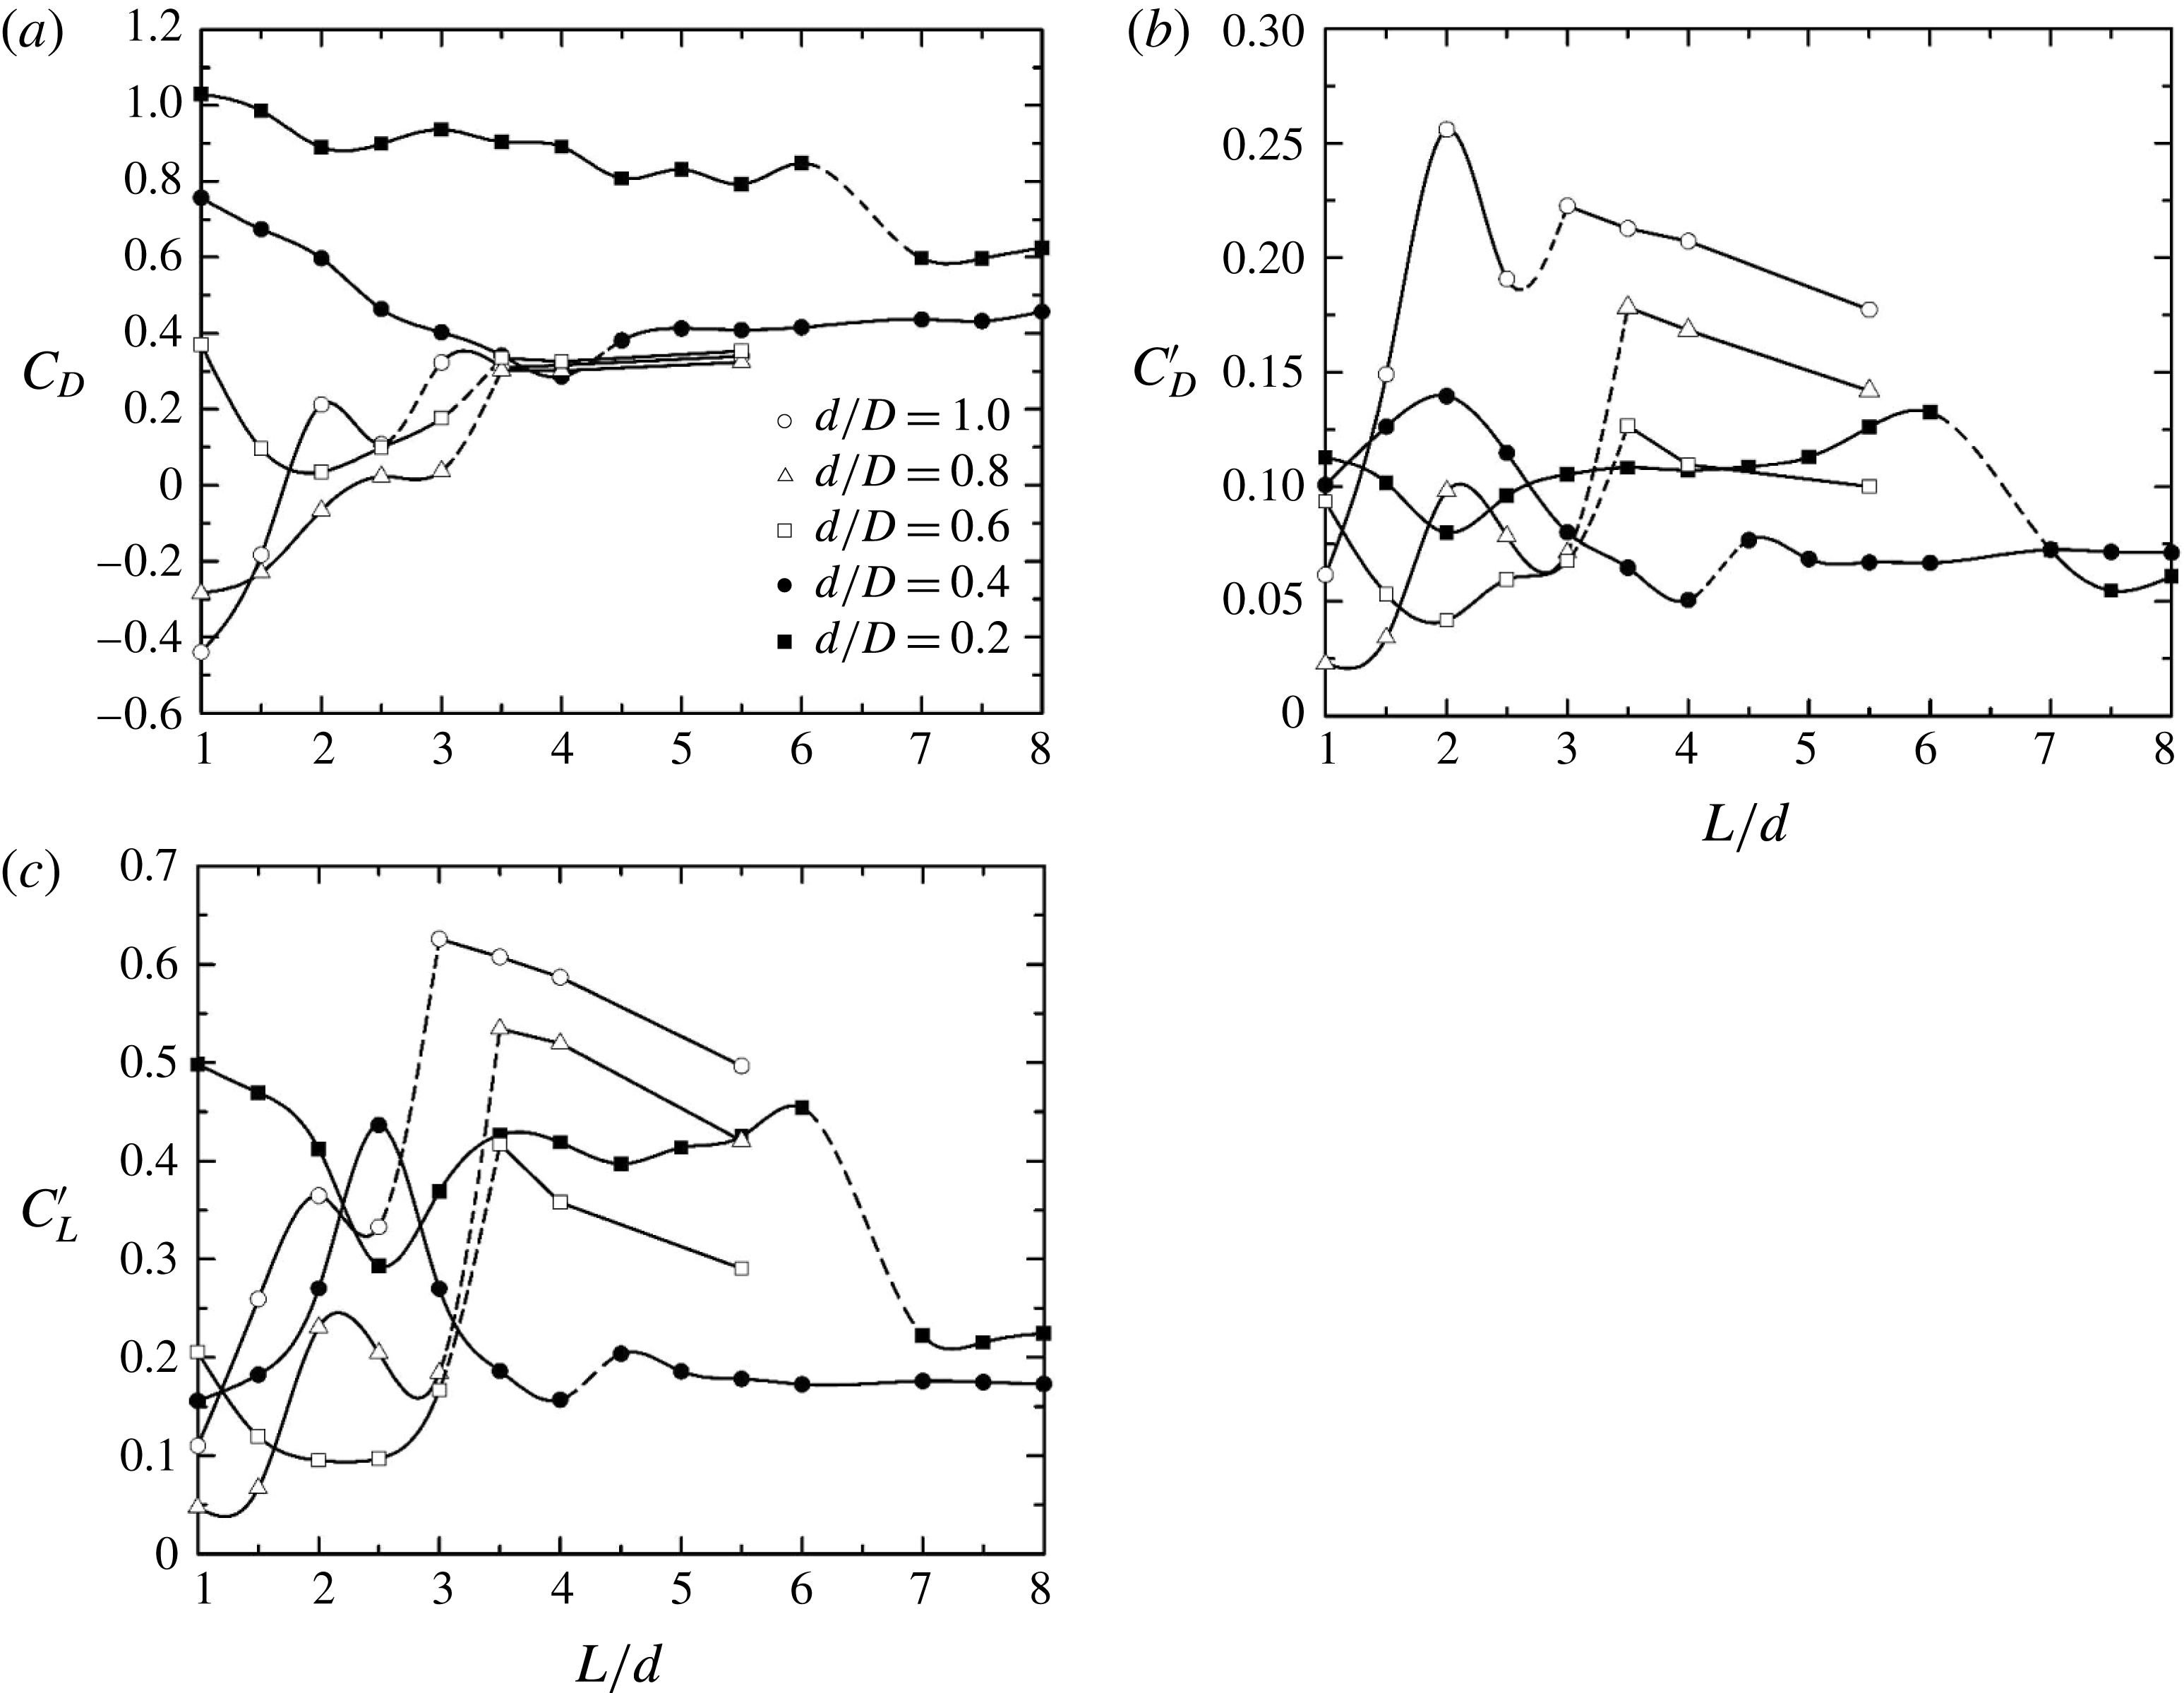
The
 $C_{D}$
,
 $C_{D}^{\prime }$
and
 $C_{L}^{\prime }$
values on the downstream cylinder depend strongly on
 $L/d$
as well as
 $d/D$
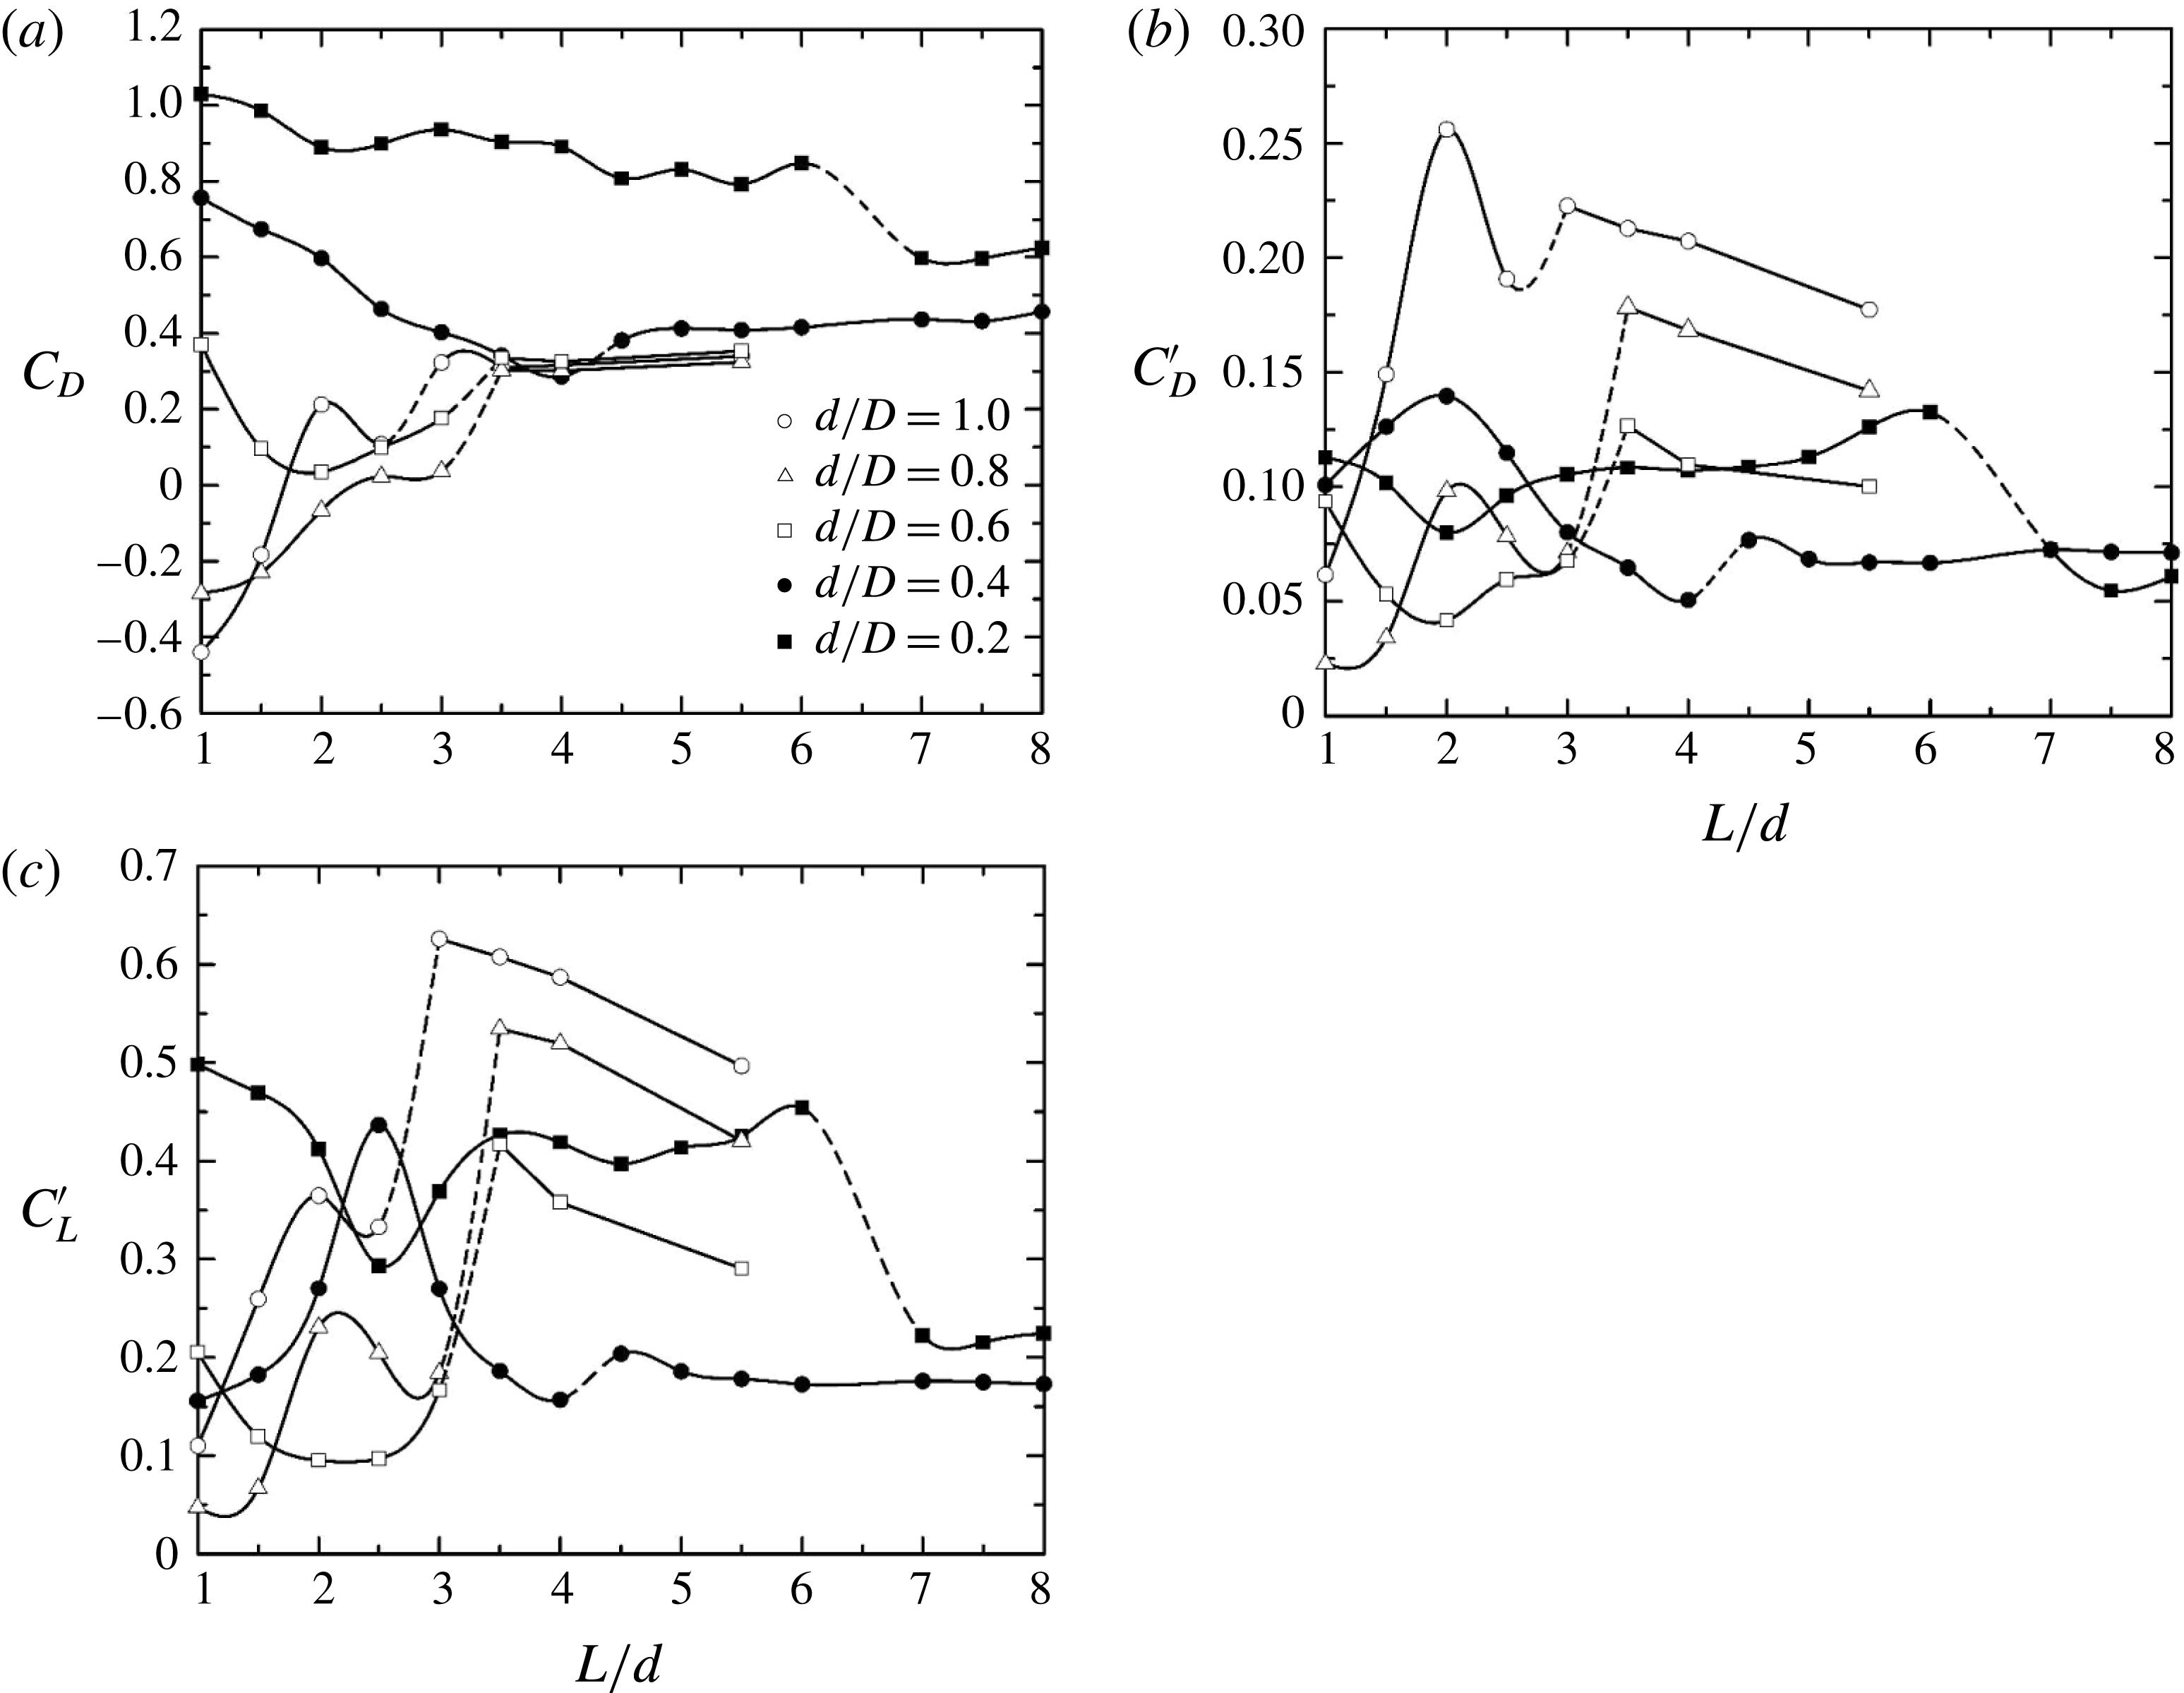
, especially in the reattachment regime, as is evident in figure 7. There is a correlation between the forces and
 $\unicode[STIX]{x1D703}_{R}$
. For
 $d/D=1.0$
and 0.8, as
 $L/d$
increases from 1.0 to 2.0,
 $C_{D}$
,
 $C_{D}^{\prime }$
and
 $C_{L}^{\prime }$
all escalate, while
 $\unicode[STIX]{x1D703}_{R}$
declines (figure 6
b). In the same
 $L/d$
range, the forces at
 $d/D=0.6$
and 0.2 show the opposite behaviour to those at
 $d/D=0.8{-}1.0$
;
 $C_{D}$
,
 $C_{D}^{\prime }$
and
 $C_{L}^{\prime }$
all drop with rising
 $\unicode[STIX]{x1D703}_{R}$
. The small decreases in
 $C_{D}$
,
 $C_{D}^{\prime }$
and
 $C_{L}^{\prime }$
for
 $d/D=1.0$
and 0.6 between
 $L/d=2.0$
and 2.5 are accompanied by small increases in
 $\unicode[STIX]{x1D703}_{R}$
. The correlation between
 $\unicode[STIX]{x1D703}_{R}$
and the forces is, however, weak for small
 $d/D~(=0.4{-}0.2)$
. It should be noted that
 $C_{D}$
,
 $C_{D}^{\prime }$
and
 $C_{L}^{\prime }$
all jump at
 $(L/d)_{c}$
for
 $d/D=1.0{-}0.4$
but drop for
 $d/D=0.2$
. The flow physics behind the distinct observations is different, which will be discussed in § 5.
The dependence on
 $L/d$
of (a)
 $C_{D}$
, (b)
 $C_{D}^{\prime }$
and (c)
 $C_{L}^{\prime }$
on the downstream cylinder. The dashed lines indicate the critical spacing
 $(L/d)_{c}$
that separates the reattachment and co-shedding regimes.
Zdravkovich & Pridden (Reference Zdravkovich and Pridden1977) observed at
 $d/D=1.0$
in the reattachment regime that
 $C_{D}$
on the downstream cylinder displayed a local peak at
 $L/d\approx 2.0$
for
 $Re>3.1\times 10^{4}$
as
 $L/d$
varied over 0.5–3.5. This peak, however, disappeared for
 $Re<3.1\times 10^{4}$
. A local peak in the
 $C_{D}$
distribution for
 $d/D=1.0$
occurs at
 $L/d=2.0$
(figure 7
a). The
 $C_{D}$
values at
 $L/d=2.5$
and 3.0 for
 $d/D=0.8$
are comparable to each other. This could suggest a peak between
 $L/d=2.5$
and 3.0. The peak, however, does not appear for other values of
 $d/D$
. The present
 $Re$
based on
 $D$
is
 $4.27\times 10^{4}$
. The Reynolds number
 $Re_{d}$
based on
 $d$
for
 $d/D=0.8$
is
 $3.4\times 10^{4}$
, exceeding
 $3.1\times 10^{4}$
for
 $d/D=1.0$
and 0.8 but below
 $3.1\times 10^{4}$
for other values of
 $d/D$
. This explains why the local peak appears for
 $d/D=1.0$
and 0.8, but not for other values of
 $d/D$
, and also indicates a consistency between the present data and Zdravkovich & Pridden’s (Reference Zdravkovich and Pridden1977) measurement. Alam (Reference Alam2014) connected this local peak in
 $C_{D}$
to the observation that the reattaching shear layer upon the front surface of the downstream cylinder swept to the opposite side of the downstream cylinder.
Beyond
 $(L/d)_{c}$
(dashed line),
 $C_{D}$
changes little with increasing
 $L/d$
for all values of
 $d/D$
(figure 7
a). The forces
 $C_{D}^{\prime }$
and
 $C_{L}^{\prime }$
, however, behave differently, depending on
 $d/D$
, more or less constant for
 $d/D=0.4{-}0.2$
and decreasing for
 $d/D=1.0{-}0.6$
(figure 7
b,c). The dependence of
 $C_{D}^{\prime }$
and
 $C_{L}^{\prime }$
on
 $d/D$
is connected to the fact that the sheddings from the two cylinders are locked in for
 $d/D=1.0{-}0.6$
. Alam, Sakamoto & Zhou (Reference Alam, Sakamoto and Zhou2006) and Alam & Zhou (Reference Alam and Zhou2007a
) found that for
 $d/D=1.0$
the phase lag between the vortex sheddings from the two cylinders is zero (in phase) at the onset (the lower
 $L/d$
) of co-shedding flow and then increases with
 $L/d$
almost linearly. They further observed that the phase lag has a great influence on the fluctuating forces, a smaller phase lag corresponding to larger fluctuating forces. The alternating impingement of the upstream-cylinder-generated vortices on the downstream cylinder induces additional fluctuating forces at the same frequency of vortex shedding from the downstream cylinder. The impingement is weakened at a large
 $L/d$
. This explains why
 $C_{D}^{\prime }$
and
 $C_{L}^{\prime }$
contract with increasing
 $L/d$
in the co-shedding regime for
 $d/D=1.0{-}0.6$
. On the other hand, as the lock-in does not occur for
 $d/D=0.4{-}0.2$
,
 $C_{D}^{\prime }$
and
 $C_{L}^{\prime }$
are not much influenced by the impingement.
It is well known that
 $C_{D}^{\prime }$
and
 $C_{L}^{\prime }$
on a cylinder are highly dependent on the free-stream flow conditions. The forces
 $C_{D}^{\prime }$
and
 $C_{L}^{\prime }$
decrease with increasing turbulent intensity (Laneville, Gartshore & Parkinson Reference Laneville, Gartshore, Parkinson and Eator1975; Nakamura & Ohya Reference Nakamura and Ohya1984), but rise with impinging vortices growing in size (Rockwell Reference Rockwell1998; Alam & Sakamoto Reference Alam and Sakamoto2005; Alam et al.
Reference Alam, Sakamoto and Zhou2006). In the cases of
 $d/D=1.0$
and 0.8,
 $C_{D}^{\prime }$
and
 $C_{L}^{\prime }$
show the same trend in variation; with increasing
 $L/d$
, they rise until
 $L/d=2.0$
and then drop until the end of the reattachment regime. Actually,
 $\unicode[STIX]{x1D703}_{R}$
at
 $d/D=1.0$
and
 $L/d=2.0$
is minimum; that is, the incidence angle of the shear layer reattaching on the downstream cylinder is a minimum (figure 6). As such, the downstream cylinder is effectively more bluff, generating strong vortices. The alternate buffeting of the shear layers with a small incidence angle and the strong vortex shedding near
 $L/d=2.0$
both contribute to the higher fluctuating forces. Based on experimental data for
 $d/D=1.0$
at
 $Re=6.5\times 10^{4}$
, Alam et al. (Reference Alam, Moriya, Takai and Sakamoto2003) established, in the reattachment regime, a correlation between
 $C_{D}^{\prime }$
or
 $C_{L}^{\prime }$
and the shear layer reattachment position on the downstream cylinder. As the reattachment position moves towards the forward stagnation point, both
 $C_{D}^{\prime }$
and
 $C_{L}^{\prime }$
on the downstream cylinder increase, and vice versa.
At
 $(L/d)_{c}$
,
 $C_{D}$
,
 $C_{D}^{\prime }$
and
 $C_{L}^{\prime }$
all jump for
 $d/D=1.0{-}0.4$
but contract for
 $d/D=0.2$
. In general,
 $C_{D}$
rises with a decrease in
 $d/D$
except at
 $d/D=1.0$
and
 $L/d=2.0$
, where
 $C_{D}$
reaches a local maximum (figure 7
a). On the other hand,
 $C_{D}^{\prime }$
and
 $C_{L}^{\prime }$
drop with
 $d/D$
decreasing from 1.0 to 0.6 and then go up as
 $d/D$
decreases from 0.4 to 0.2.
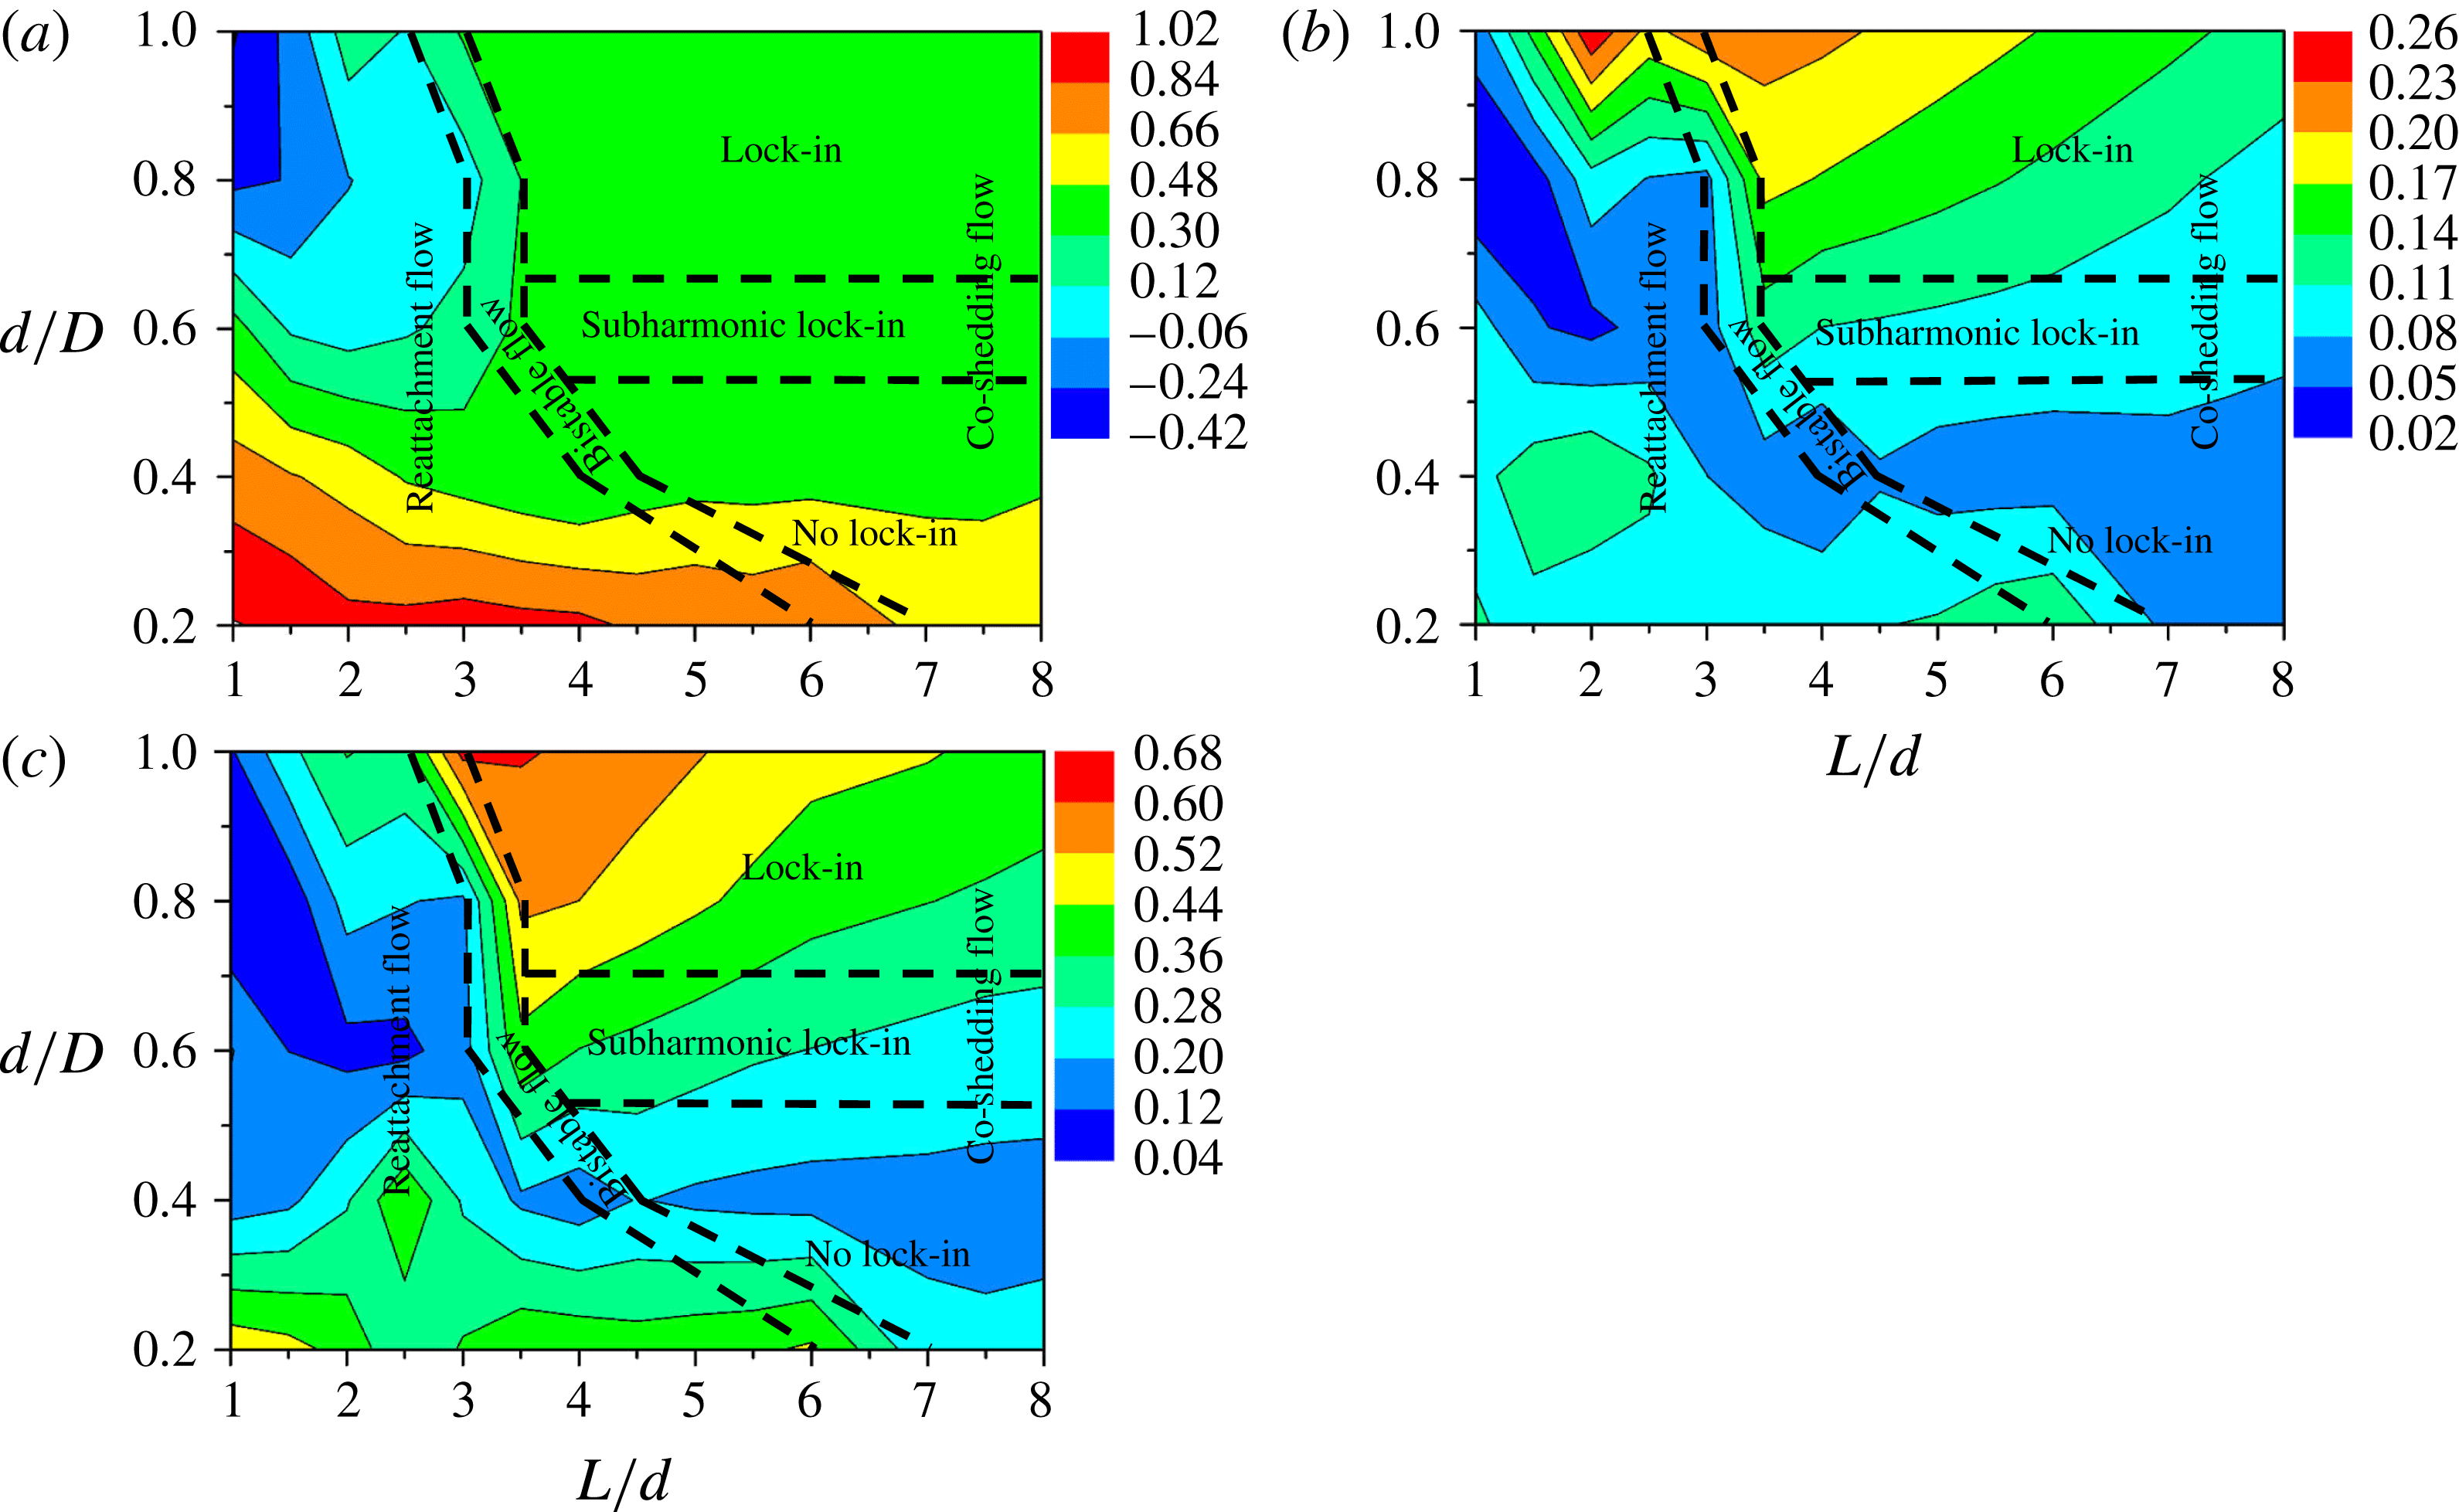
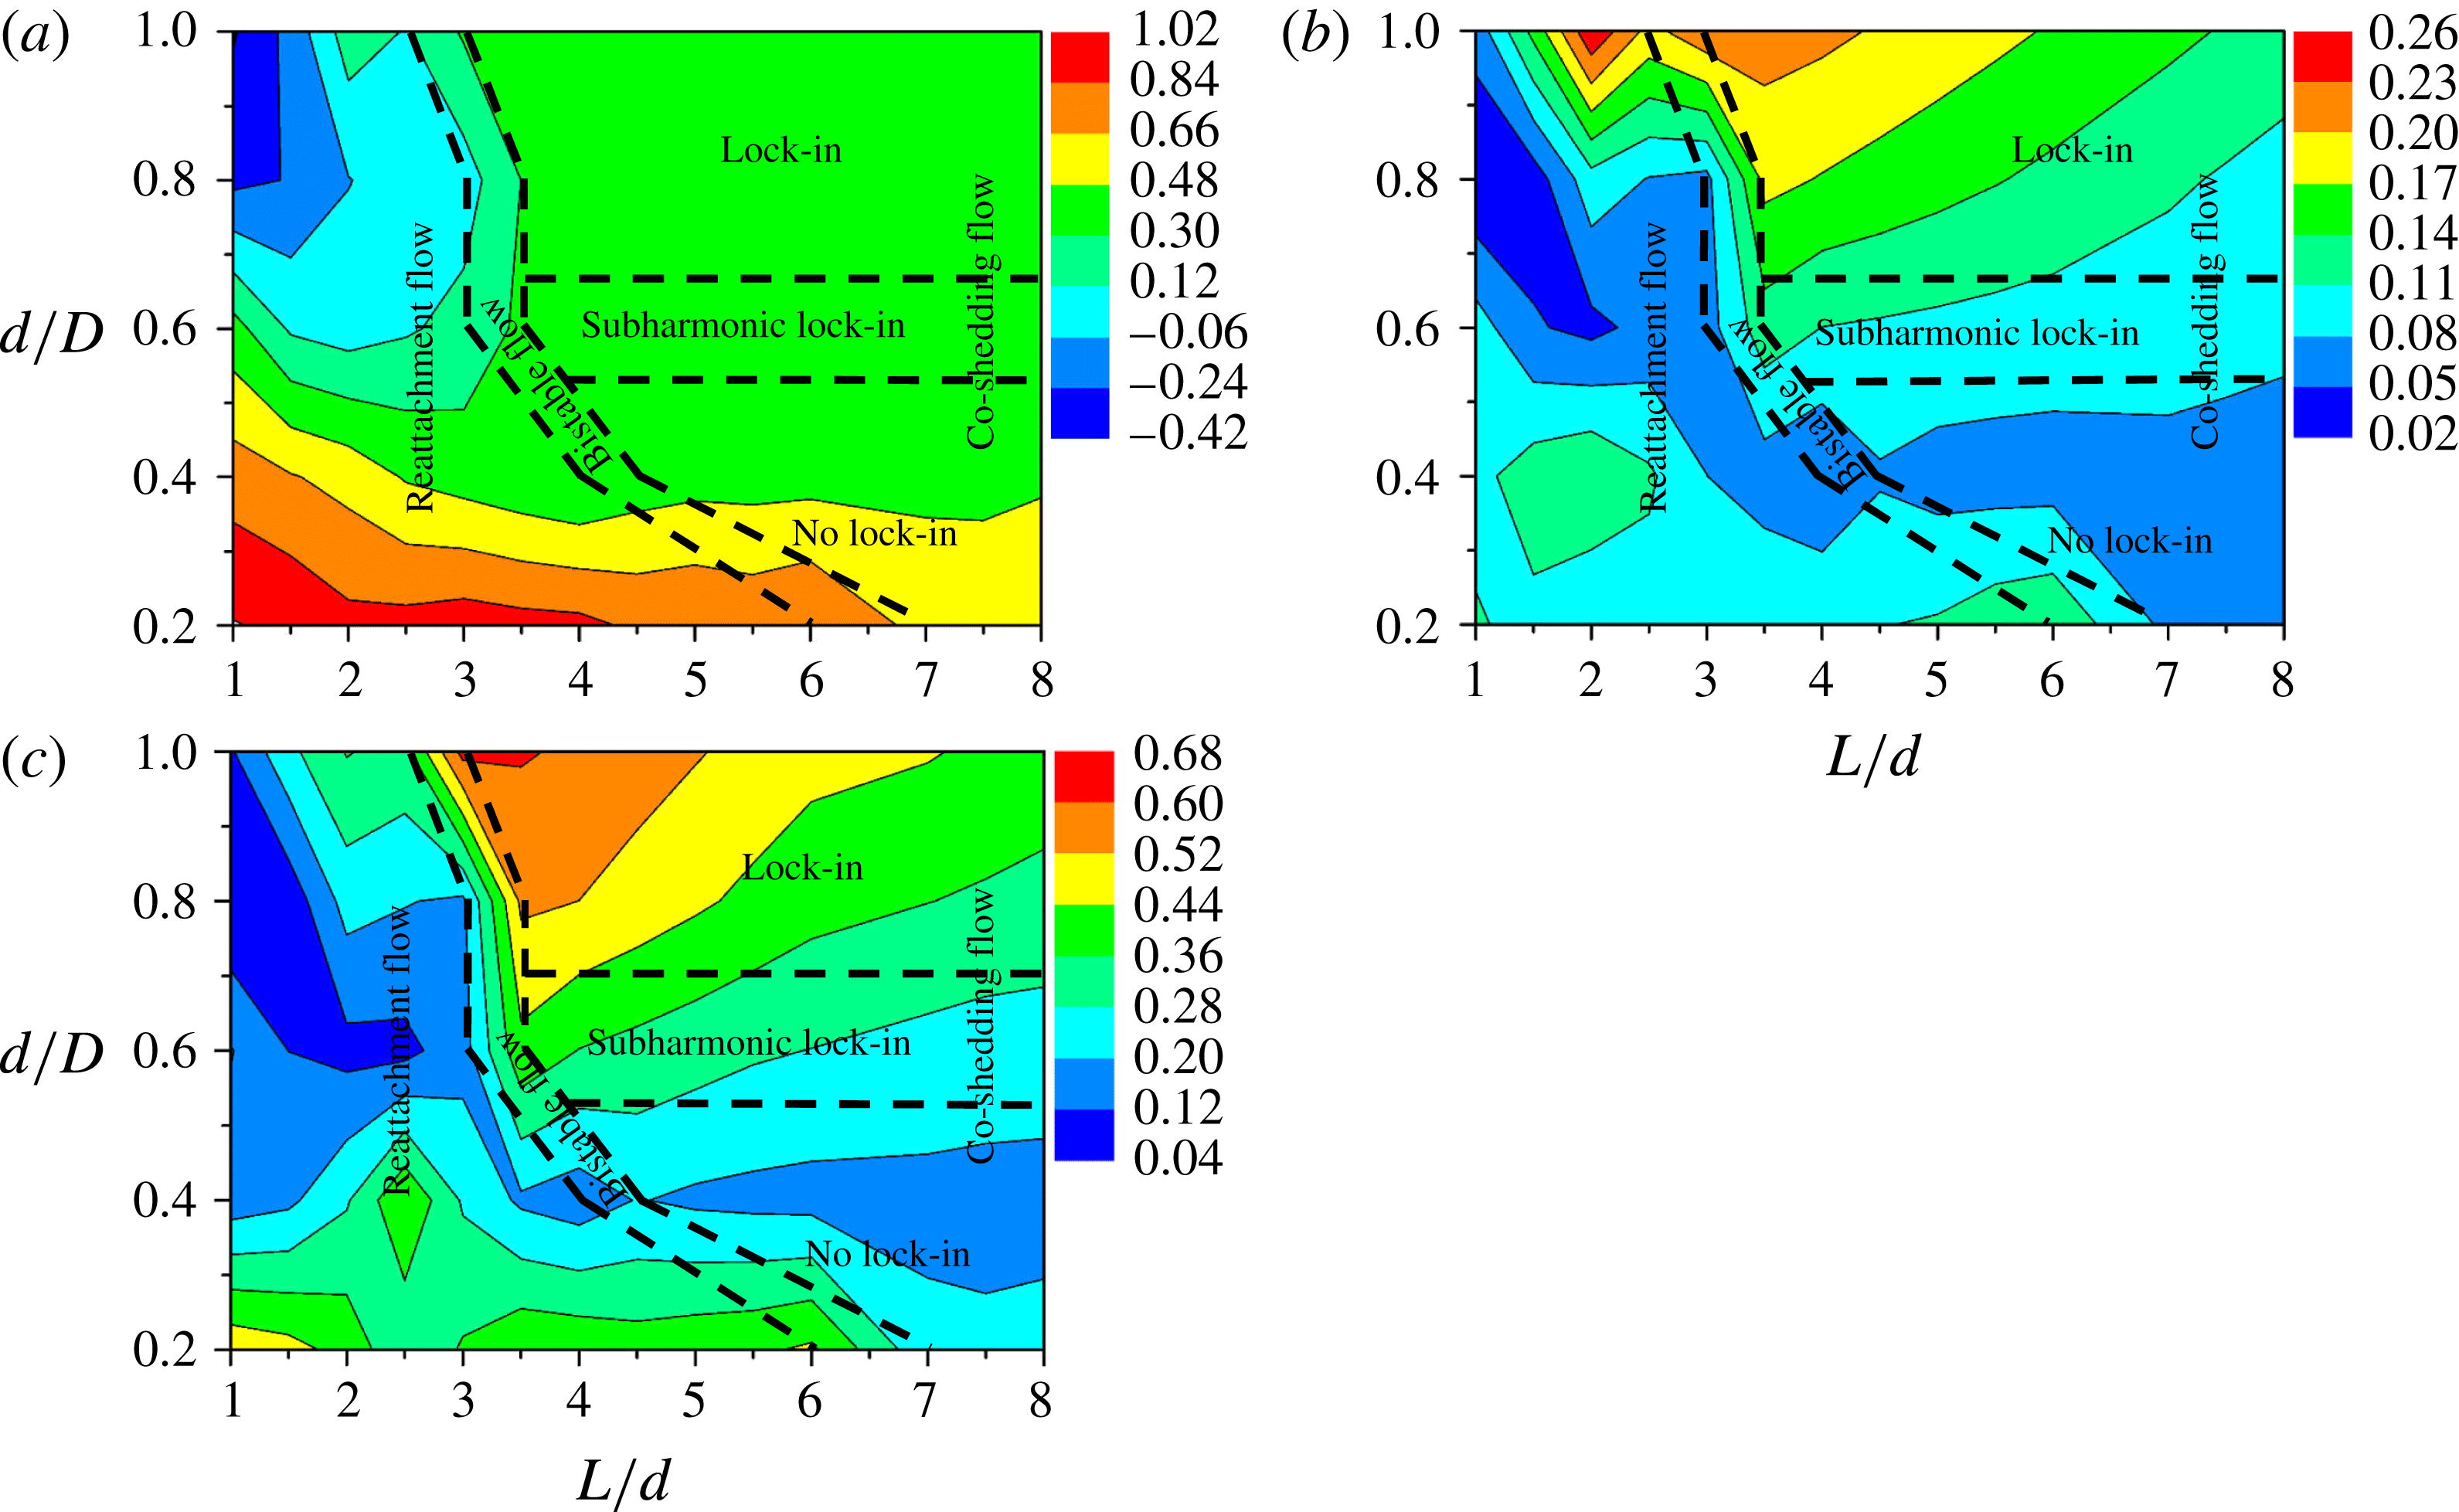
The isocontours of
 $C_{D}$
,
 $C_{D}^{\prime }$
and
 $C_{L}^{\prime }$
provide a good picture of the dependence of the quantities on
 $L/d$
and
 $d/D$
(figure 8). In the reattachment flow regime,
 $C_{D}$
increases with
 $d/D$
decreasing (figure 8
a). While
 $C_{D}^{\prime }$
becomes maximum at the largest
 $d/D(=1.0)$
near the boundary of the bistable flow,
 $C_{L}^{\prime }$
becomes maximum at the lowest
 $d/D$
and smallest
 $L/d$
examined (figure 8
b,c). Minimum
 $C_{D}^{\prime }$
and
 $C_{L}^{\prime }$
occur for
 $d/D=0.6$
. In the co-shedding flow, both
 $C_{D}^{\prime }$
and
 $C_{L}^{\prime }$
decline with decreasing
 $d/D$
, except for a small increase in
 $C_{L}^{\prime }$
between
 $d/D=0.4$
and 0.2. The physical mechanisms behind the observations of
 $C_{D}$
,
 $C_{D}^{\prime }$
and
 $C_{L}^{\prime }$
will be discussed in the following sections.
The dependence on
 $L/d$
and
 $d/D$
of (a)
 $C_{D}$
, (b)
 $C_{D}^{\prime }$
and (c)
 $C_{L}^{\prime }$
on the downstream cylinder. The dashed lines represent the boundaries between flow regimes.
5 Flow structures between and behind the cylinders
The near-wake characteristics are connected to the forces, including the vortex strength, wake width, vortex formation length, recirculation bubble, streamwise velocity recovery and lateral entrainment of ambient fluid into the wake, and can be explored through the isocontours of
 $\unicode[STIX]{x1D714}^{\ast }$
,
 $\bar{u}^{\ast }$
,
 $\bar{v}^{\ast }$
, and
 $u_{rms}^{\ast }$
and
 $v_{rms}^{\ast }$
, where
 $\unicode[STIX]{x1D714}$
is the instantaneous spanwise vorticity calculated from the PIV-measured
 $u$
and
 $v$
.
5.1 Instantaneous vorticity field
Figure 9 shows the
 $\unicode[STIX]{x1D714}^{\ast }$
-contours between and behind the two cylinders for different values of
 $d/D(=1.0{-}0.2)$
and
 $L/d(=1.0{-}7.0)$
, along with those measured in an isolated-cylinder wake which act as a reference. Four
 $L/d$
ratios are chosen for each of
 $d/D=1.0$
, 0.8 and 0.6, and three are given for each of
 $d/D=0.4$
and 0.2. Only one
 $L/d$
is chosen for each
 $d/D$
in the co-shedding regime where the forces are not so sensitive to
 $L/d$
, while more are examined in the reattachment regime where the forces can be sensitive to
 $L/d$
. The flow structures between and behind the cylinders are captured at the same phase of the vortex shedding cycle.
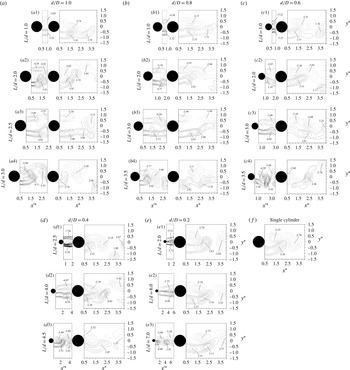
Isocontours of the instantaneous spanwise vorticity
 $\unicode[STIX]{x1D714}^{\ast }=\unicode[STIX]{x1D714}D/U_{\infty }$
. The solid and dotted lines represent positive (
 ${\geqslant}0$
) and negative (
 ${<}0$
) contour levels. The contour increment and cutoff level are 0.5 and
 $\pm 0.5$
respectively.

The wake behind the downstream cylinder exhibits the typical characteristics of the alternate Kármán-vortex street, and is qualitatively comparable to that behind an isolated single cylinder (figure 9
f). However, the flow between the cylinders depends very much on whether the separated shear layers roll up to form vortices. For a given
 $L/d$
, say 2.0, in the reattachment regime, the lateral width between the two shear layers shrinks gradually as
 $d/D$
decreases from 1.0 to 0.2, while the wake behind the cylinders varies little (figure 9
a2, b2, c2, e1). The shear layers between the cylinders are elongated longitudinally with increasing
 $L/d$
(e.g. figure 9
b2, b3; e1, e2). The two shear layers between the cylinders are almost symmetrically reattached on the downstream cylinder for a small
 $L/d({<}2.0)$
(figure 9
a2, b2, e1) but are asymmetric for a large
 $L/d({\geqslant}2.0)$
(figure 9
a3, b3, c3), perhaps with alternating reattachment taking place. This is because the elongated shear layers are prone to the development of instabilities. This development can be readily interrupted by the downstream cylinder in the case of reattachment on the front surface.
The impingement of the shear layers from the upstream cylinder can affect the pressure distribution around the downstream-cylinder surface and the evolution of the shear layers separating from the downstream cylinder. This evolution is closely correlated with the fluctuating forces on the cylinder (Gursul & Rockwell Reference Gursul and Rockwell1990; Lee & Smith Reference Lee and Smith1991; Rockwell Reference Rockwell1998; Alam et al.
Reference Alam, Moriya, Takai and Sakamoto2003; Alam & Sakamoto Reference Alam and Sakamoto2005; Alam et al.
Reference Alam, Sakamoto and Zhou2006). Gursul & Rockwell (Reference Gursul and Rockwell1990) examined the interaction between oncoming vortices and an elliptical leading edge and found that the fluctuating pressure on the edge is highly dependent on the strength of the oncoming vortices, and a high fluctuation of pressure occurs where the vortices impinge. A similar observation was made by Zhang, Cheng & Zhou (Reference Zhang, Cheng and Zhou2006). One should recall our earlier observation that
 $C_{D}^{\prime }$
and
 $C_{L}^{\prime }$
for
 $d/D=1.0$
and 0.8 in the reattachment regime increased up to
 $L/d=2.0$
and then declined (figure 7
b,c). For
 $d/D=1.0$
, the maximum magnitudes of
 $\unicode[STIX]{x1D714}^{\ast }$
between and behind the cylinders rise from 3.53 and 2.74 to 5.91 and 3.91 respectively from
 $L/d=1.0$
to 2.0 and then decline for a further increase in
 $L/d$
(figure 9
a1–a3); that is, the maximum magnitudes of
 $\unicode[STIX]{x1D714}^{\ast }$
occur at
 $L/d=2.0$
in the reattachment regime. A similar observation is made for
 $d/D=0.8$
, as shown in figure 9(b1–b3). At
 $L/d=2.0$
, the maximum magnitudes of
 $\unicode[STIX]{x1D714}^{\ast }$
between and behind the cylinders decline with decreasing
 $d/D(=1.0{-}0.6)$
, and so do
 $C_{D}^{\prime }$
and
 $C_{L}^{\prime }$
.
When the flow changes from reattachment to co-shedding for a given
 $d/D$
, the lateral width between the shear layers separated from the upstream cylinder contracts. The corresponding jump in the forces can also be attributed to the change in the vorticity concentration between the cylinders (Lin et al.
Reference Lin, Yang and Rockwell2002; Alam & Zhou Reference Alam and Zhou2007b
). As such, the maximum magnitude of
 $\unicode[STIX]{x1D714}^{\ast }$
between the cylinders rises from the reattachment to the co-shedding flow for
 $d/D=1.0{-}0.4$
but drops for
 $d/D=0.2$
(figure 9
a3, a4; b3, b4; c3, c4; d2, d3; e2, e3), following the jump and drop in the forces (figure 8).
5.2 Time-averaged streamwise velocities
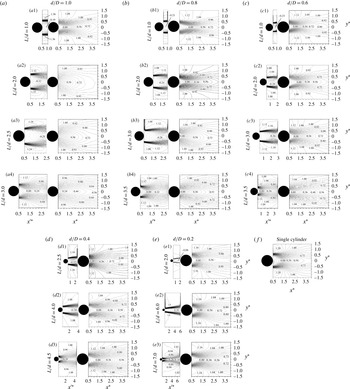
Figure 10 presents the
 $\bar{u}^{\ast }$
-contours for
 $d/D=1.0$
, 0.8, 0.6, 0.4 and 0.2 at different values of
 $L/d$
, along with those in an isolated-cylinder wake. The minimum
 $\bar{u}^{\ast }$
in a recirculation bubble enclosed by
 $\bar{u}^{\ast }=0$
provides a measure for the strength of a recirculation bubble, which is highly connected to the forces on the cylinders. Like the forces, the flow structure, both between and behind the cylinders, is dependent on both
 $d/D$
and
 $L/d$
. At
 $d/D=1.0$
, the recirculation bubble between the cylinders shrinks in lateral width from
 $L/d=1.0$
to 2.0 (figure 10
a1, a2) and grows from
 $L/d=2.0$
to 2.5 (figure 10
a2, a3). A narrow recirculation bubble means a small
 $\unicode[STIX]{x1D703}_{R}$
(figure 6
b) and a large flow recirculation, i.e. a large magnitude of the minimum
 $\bar{u}^{\ast }$
. The shear layers reattaching at small
 $\unicode[STIX]{x1D703}_{R}$
lead to a narrow bubble and strong impingement, which feeds more fluid into the gap. The flow recirculation thus gets stronger and
 $\bar{u}^{\ast }$
becomes more negative. The entrainment of the recirculating fluid from the gap between the cylinders to the shear layers results in a wide shear layer in the gap and around the downstream cylinder as well as a large velocity recovery behind the cylinders (figure 10
a). This observation is consistent with the maximum
 $C_{D}$
at
 $L/d=2.0$
in the reattachment regime for
 $d/D=1.0$
(figure 7
a). Similarly to that in a single cylinder wake (figure 10
f), the recirculation bubble between the cylinders contracts at
 $L/d=3.0$
(figure 10
a4), implying a co-shedding flow. At
 $d/D=0.8$
, the minimum
 $\bar{u}^{\ast }$
between the cylinders rises in magnitude and the recirculation bubble behind the cylinders contracts in size from
 $L/d=1.0$
to 2.5. The former contributes to an increase in
 $C_{D}$
(figure 7
a), while the latter does not. The observation is different for
 $d/D=0.6$
; the bubble behind the downstream cylinder grows from
 $L/d=1.0$
to 2.0 but diminishes from
 $L/d=2.0$
to 3.0, which is consistent with
 $C_{D}$
that is smallest at
 $L/d=2.0$
(figure 7
a). For
 $d/D=0.4$
and 0.2, the shear layer approaching the downstream cylinder grows in width with increasing
 $L/d$
. The bubble behind the downstream cylinder is elongated longitudinally, in contrast to that for
 $d/D=1.0$
or 0.8. As such,
 $C_{D}$
declines.
Isocontours of the time-averaged streamwise velocity
 $\bar{u}^{\ast }=\bar{u}/U_{\infty }$
. The solid and dotted lines represent positive (
 ${\geqslant}0$
) and negative
 $({<}0)~\bar{u}^{\ast }$
. The contour increment is 0.04.

At
 $L/d=1.0$
, the minimum
 $\bar{u}^{\ast }$
between the cylinders grows in magnitude from
 $d/D=1.0$
to 0.6 as a result of the shear layer reattachment at small
 $\unicode[STIX]{x1D703}_{R}$
with decreasing
 $d/D$
. Accordingly, the
 $C_{P}$
around the shear layer reattachment position and on the front surface increases with decreasing
 $d/D$
(figure 5), resulting in a rise in
 $C_{D}$
(figure 7
a).
When the reattachment flow (figure 10
a3, b3, c3, d2, e2) changes to co-shedding (figure 10
a4, b4, c4, c4, d3, e3) with an increase in
 $L/d$
, the recirculation bubble contracts drastically between the cylinders. In the reattachment regime,
 $\unicode[STIX]{x1D703}_{R}$
becomes smaller gradually from
 $d/D=1.0$
to 0.2 (figure 6) due to the reduced lateral separation between the two shear layers. Therefore, the shear layers reattach on the side surface (
 $\unicode[STIX]{x1D703}_{R}>45^{\circ }$
) of the downstream cylinder for
 $d/D=1.0{-}0.6$
(figure 10
a3, b3, c3), forming a wide bubble between the cylinders, but on the front surface (
 $\unicode[STIX]{x1D703}_{R}<45^{\circ }$
) for
 $d/D=0.4$
and 0.2 (figure 10
d2, e2), forming a narrow bubble. The value of
 $C_{D}$
on the downstream cylinder is thus larger at
 $d/D=0.4$
and 0.2 than at
 $d/D=1.0{-}0.6$
. It was found in figure 7(a) that
 $C_{D}$
jumps at
 $(L/d)_{c}$
for
 $d/D=1.0{-}0.4$
but drops for
 $d/D=0.2$
. It would be of interest to explain the difference in terms of the approaching velocity of the downstream cylinder and the wake velocity deficit.
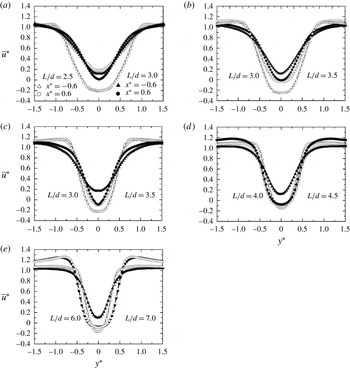
Figure 11(a–e) presents the
 $\bar{u}^{\ast }$
-contours across the wake at
 $x^{\ast }=-0.6$
and 0.6. While the contours at
 $x^{\ast }=-0.6$
characterize the incident flow of the downstream cylinder, those at
 $x^{\ast }=0.6$
are within the vortex formation region and may provide the information on the velocity of the free shear layer and velocity deficit in the wake. Two values of
 $L/d$
are selected for each
 $d/D$
, corresponding to the reattachment and co-shedding flows respectively. At
 $d/D=1.0$
, the reattachment flow (
 $L/d=2.5$
) changes to co-shedding flow (
 $L/d=3.0$
), and
 $\bar{u}^{\ast }$
at
 $x^{\ast }=-0.6$
goes up across
 $y^{\ast }=-0.5{-}0.5$
(figure 11
a). The rise is attributed to the disappearance of the quasi-steady vortex in the gap for the co-shedding flow. A similar observation is made for the other
 $d/D$
values (figure 11
b–e). In the reattachment regime, although the approaching
 $\bar{u}^{\ast }$
does not change much at
 $y^{\ast }=0$
with decreasing
 $d/D$
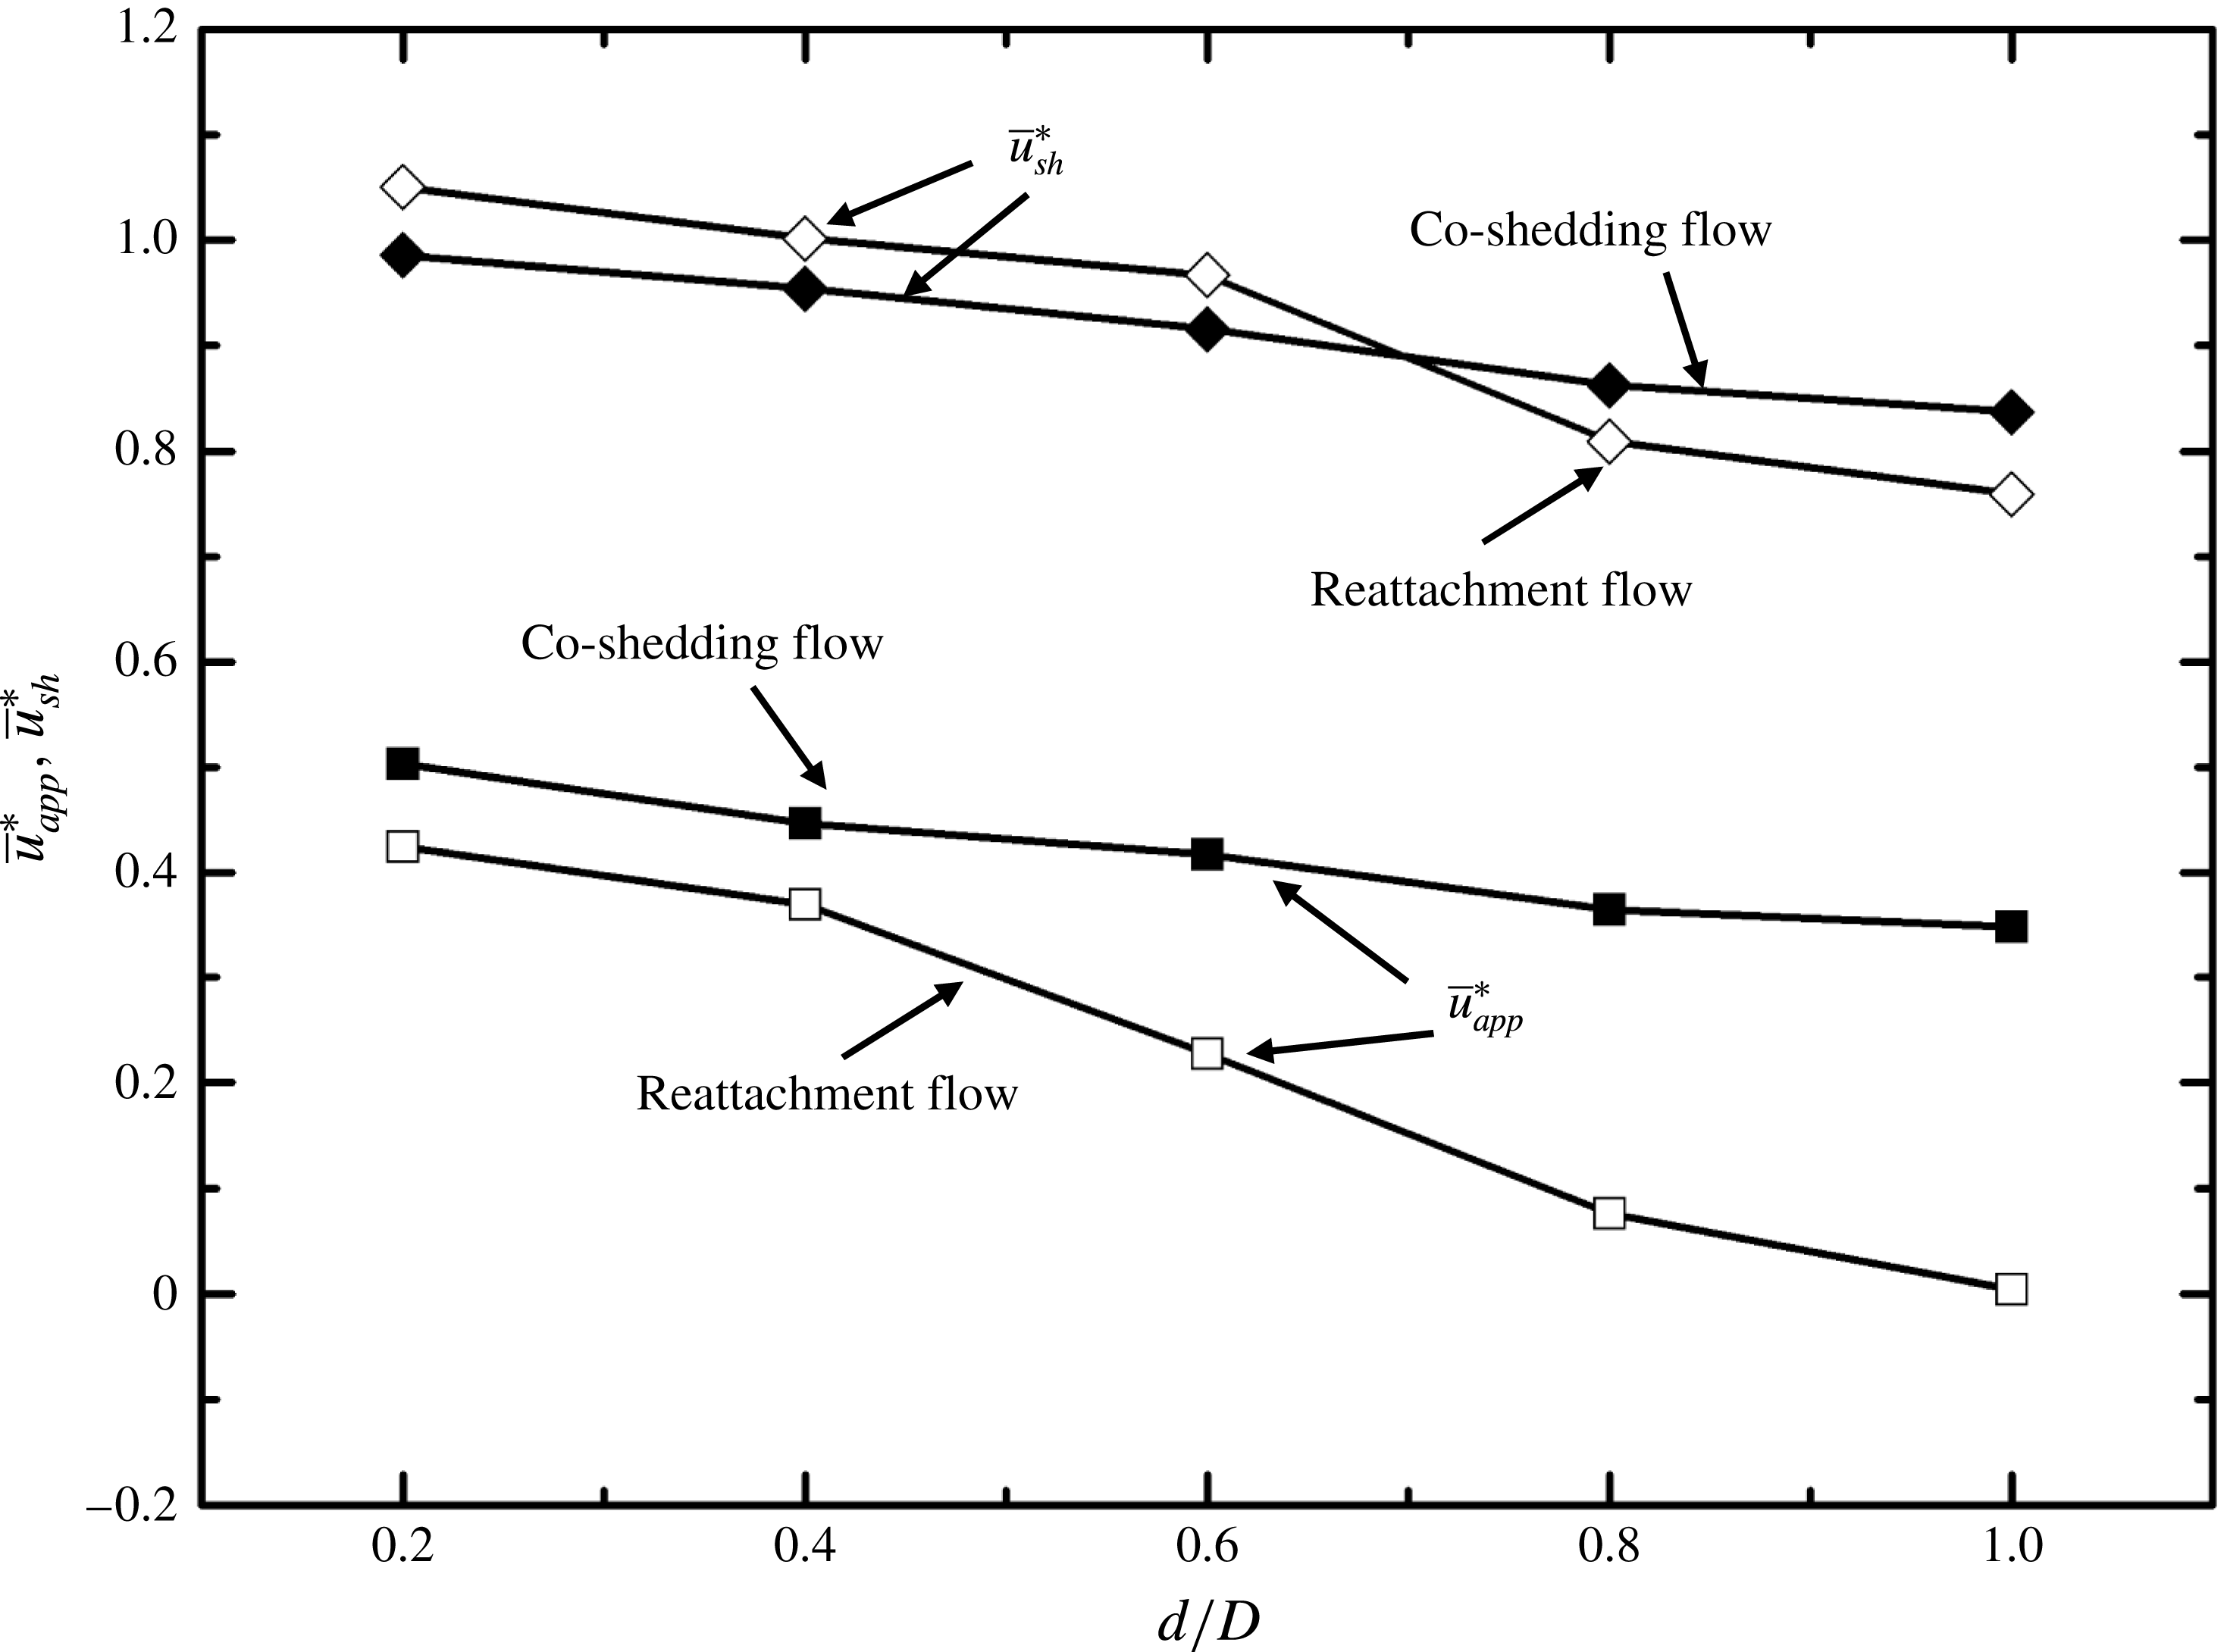
, the corresponding valley becomes narrow, resulting in an increase in the averaged approaching flow velocity, calculated by
 $\bar{u}_{app}^{\ast }$
(
 $=\int _{-0.5}^{0.5}\bar{u}^{\ast }\,\text{d}y^{\ast }$
) at
 $x^{\ast }=-0.6$
, which is presented in figure 12 as a function of
 $d/D$
for both reattachment and co-shedding flows. On the other hand,
 $\bar{u}^{\ast }$
at
 $x^{\ast }=0.6$
for
 $y^{\ast }=0.5{-}1.5$
may provide a measure for the averaged shear layer velocity
 $\bar{u}_{sh}^{\ast }$
(
 $=\int _{0.5}^{1.5}\bar{u}^{\ast }\,\text{d}y^{\ast }$
), which is strongly connected to
 $St$
, the base pressure
 $C_{Pb}$
and hence
 $C_{D}$
(Roshko Reference Roshko1955). The dependence of
 $\bar{u}_{sh}^{\ast }$
on
 $d/D$
is presented in figure 12 for both regimes. Interestingly,
 $\bar{u}_{sh}^{\ast }$
at
 $d/D=0.8{-}1.0$
is larger for the co-shedding flow than for the reattachment, opposite to the observation at
 $d/D=0.2{-}0.6$
. The result is fully consistent with the finding that
 $St$
behind the downstream cylinder jumps at
 $(L/d)_{c}$
for
 $d/D=1.0$
and 0.8 but drops for other
 $d/D$
values (figure 4
b). The value of
 $\bar{u}_{sh}^{\ast }$
grows with decreasing
 $d/D$
, irrespective of the flow regime.
The lateral distribution of the time-averaged streamwise velocity
 $\bar{u}^{\ast }$
at
 $x^{\ast }=-0.6$
and 0.6: (a)
 $d/D=1.0$
, (b) 0.8, (c) 0.6, (d) 0.4 and (e) 0.2. The open and solid symbols represent reattachment and co-shedding flows respectively.

The dependence on
 $d/D$
of the average approaching velocity
 $\bar{u}_{app}^{\ast }$
over
 $y^{\ast }=-0.5{-}0.5$
and of the average shear layer velocity
 $\bar{u}_{sh}^{\ast }$
over
 $y^{\ast }=-0.5{-}1.5$
. The open and solid symbols represent reattachment and co-shedding flows respectively.

In general, the
 $\bar{u}_{app}^{\ast }$
decreases with increasing
 $d/D$
and its value in the co-shedding case exceeds that in the reattachment case. Both
 $\bar{u}_{app}^{\ast }$
and
 $\bar{u}_{sh}^{\ast }$
play a role in determining
 $C_{D}$
, influencing the pressure on the front and rear surfaces respectively of the cylinder. The higher the
 $\bar{u}_{app}^{\ast }$
and/or
 $\bar{u}_{sh}^{\ast }$
is, the larger the
 $C_{D}$
is. Both
 $\bar{u}_{app}^{\ast }$
and
 $\bar{u}_{sh}^{\ast }$
are larger in the co-shedding flow than in the reattachment flow for
 $d/D=1.0$
and 0.8, contributing to the jump in
 $C_{D}$
. The
 $\bar{u}_{sh}^{\ast }$
at
 $d/D=0.2$
is smaller in the co-shedding flow than in the reattachment and overwhelms the influence of
 $\bar{u}_{app}^{\ast }$
, accounting for the drop in
 $C_{D}$
. For
 $d/D=0.6$
and 0.4,
 $\bar{u}_{app}^{\ast }$
and
 $\bar{u}_{sh}^{\ast }$
have the opposite influence on
 $C_{D}$
; the influence of
 $\bar{u}_{app}^{\ast }$
becomes predominant, causing the jump in
 $C_{D}$
. It is well known that the forces and
 $St$
always jump at
 $(L/d)_{c}$
(Zdravkovich Reference Zdravkovich1977; Igarashi Reference Igarashi1981; Alam et al.
Reference Alam, Moriya, Takai and Sakamoto2003; Sumner Reference Sumner2010; Alam Reference Alam2014), and the co-shedding flow has even been referred to as jump flow (Zdravkovich Reference Zdravkovich1977; Igarashi Reference Igarashi1981, Reference Igarashi1984), based on investigations at
 $d/D=1.0$
. The present investigation unveils for the first time that the forces and
 $St$
could not only jump but also drop at
 $(L/d)_{c}$
, depending on how
 $\bar{u}_{app}^{\ast }$
and
 $\bar{u}_{sh}^{\ast }$
are modified, i.e. depending on
 $d/D$
. In the reattachment case, the gap shear layers are narrow at small
 $d/D$
, e.g. 0.2 and 0.4 (figure 10
d2, e2), and reattach at smaller
 $\unicode[STIX]{x1D703}_{R}$
(figure 6) than those at large
 $d/D$
, e.g.
 $d/D=0.8$
and 1.0 (figure 10
a3, b3), thus enhancing
 $\bar{u}_{sh}^{\ast }$
. On the other hand, once co-shedding commences, the occurrence of unsteady gap vortices acts to enhance the lateral momentum transport of the gap flow and hence to reduce
 $\bar{u}_{sh}^{\ast }$
. As a result,
 $St$
and the forces drop for small
 $d/D$
.
5.3 Fluctuating streamwise velocities
In general, the maximum magnitude of
 $u_{rms}^{\ast }$
occurs at the shear layer roll-up position (Bloor Reference Bloor1964; Gerrard Reference Gerrard1966). The maximum
 $u_{rms}^{\ast }$
behind the cylinders is smaller for all values of
 $d/D$
and
 $L/d$
(figure 13) than that (
 $u_{rms}^{\ast }=0.44$
) in the wake of an isolated cylinder. Let us focus on the flow transition from reattachment to the co-shedding. Two phenomena are observed during the transition from reattachment to co-shedding flow. First, the maximum
 $u_{rms}^{\ast }$
behind the downstream cylinder drops except at
 $d/D=0.4$
, but its counterpart between the cylinders rises markedly. Second, the position where the maximum
 $u_{rms}^{\ast }$
occurs moves towards the cylinder except at
 $d/D=0.2$
.
Isocontours of the r.m.s. streamwise velocity
 $u_{rms}^{\ast }=u_{rms}/U_{\infty }$
. The contour increment is 0.02.

The transverse separation between the two maxima in the
 $u_{rms}^{\ast }$
-contours can be used to define the wake width
 $w$
(e.g. Griffin & Ramberg Reference Griffin and Ramberg1974; Roshko Reference Roshko1993). This width is closely connected to the fluid forces. Following Bloor (Reference Bloor1964) and Gerrard (Reference Gerrard1966), we define the vortex formation length
 $L_{f}$
as the streamwise distance of the maximum
 $u_{rms}^{\ast }$
from the cylinder centre. While a large
 $w$
corresponds to a large
 $C_{D}$
,
 $C_{D}^{\prime }$
and
 $C_{L}^{\prime }$
,
 $L_{f}$
is inversely linked to the quantities (Nakaguchi, Hashimoto & Muto Reference Nakaguchi, Hashimoto and Muto1968; Alam, Zhou & Wang Reference Alam, Zhou and Wang2011). Both
 $w$
and
 $L_{f}$
are estimated from the PIV-measured
 $u_{rms}^{\ast }$
-contours. The dependence on
 $L/d$
of
 $w^{\ast }$
(
 $=w/D$
),
 $L_{f}^{\ast }$
(
 $=L_{f}/D$
) and
 $h^{\ast }$
(
 $=h/D$
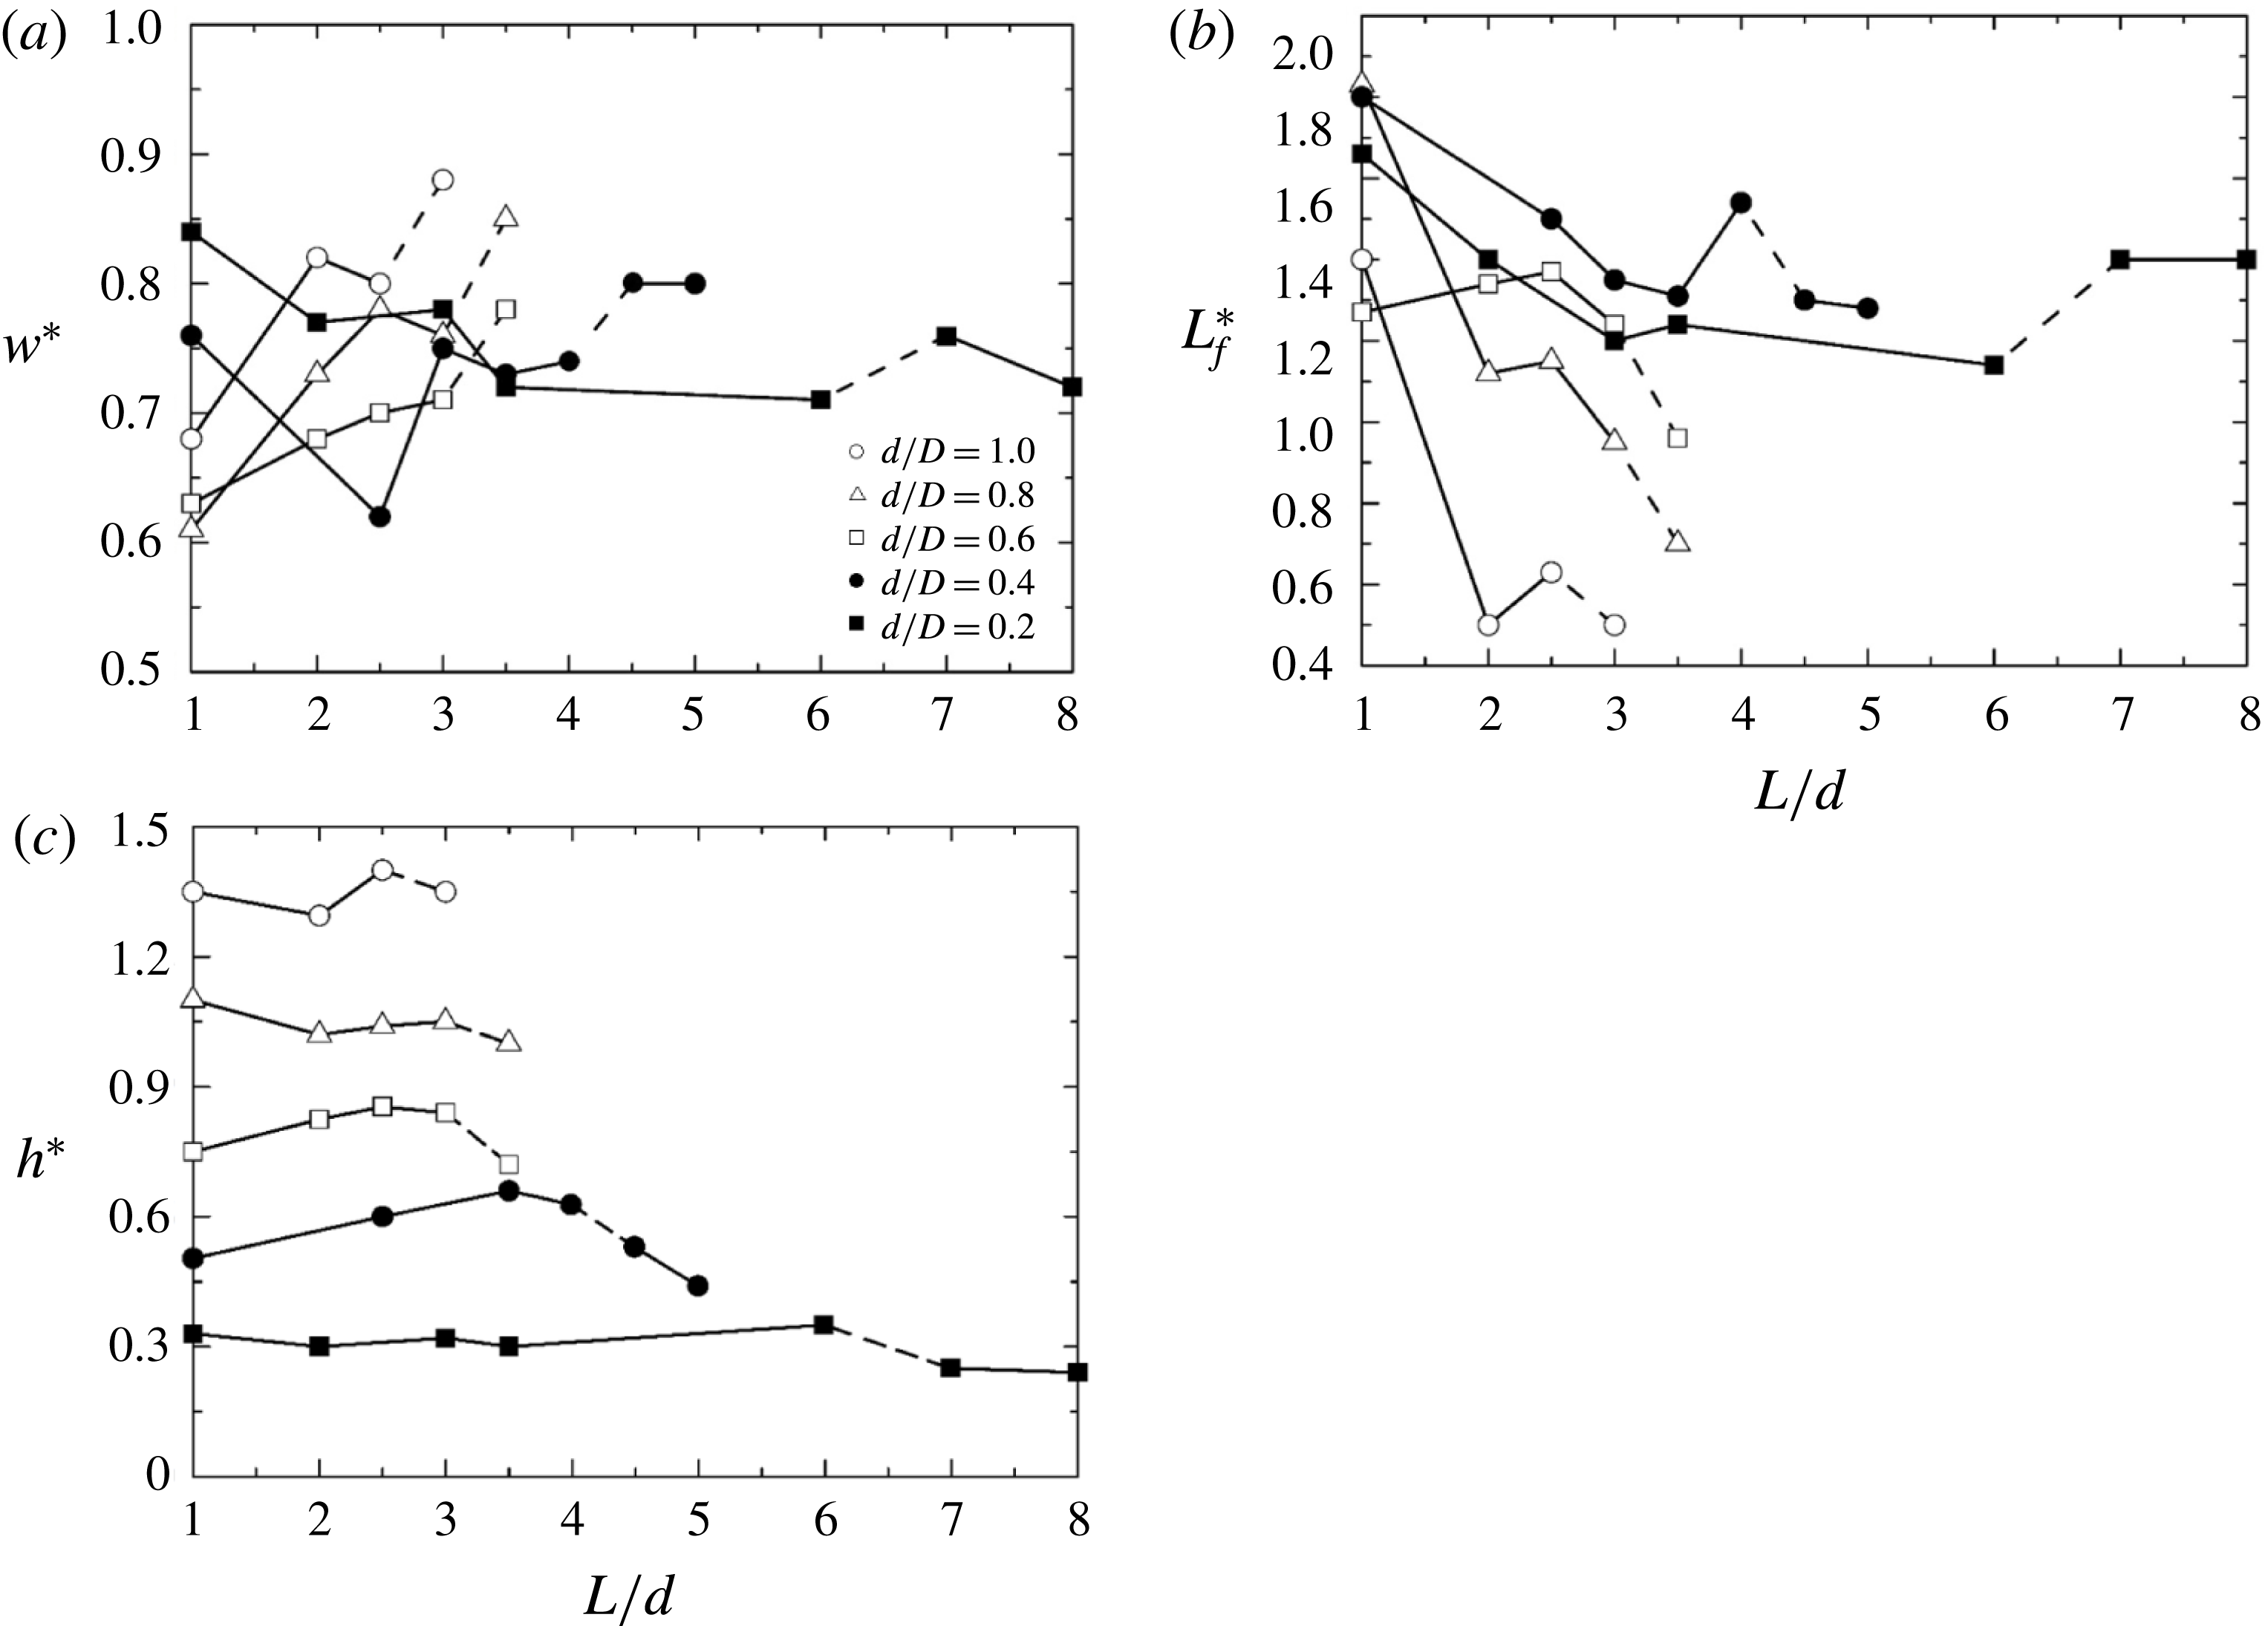
) is shown in figure 14. The lateral width
 $h^{\ast }$
between the two gap shear layers at
 $x^{\prime \ast }/d=0.55$
is an additional parameter that is connected to the pressure on the front surface of the cylinder and hence
 $C_{D}$
. As such,
 $h^{\ast }$
is estimated for different values of
 $L/d$
and
 $d/D$
. The dependence on
 $L/d$
of
 $w^{\ast }$
,
 $L_{f}^{\ast }$
and
 $h^{\ast }$
is shown in figure 14. The value of
 $h^{\ast }$
varies inversely with
 $C_{P}$
on the front surface of the downstream cylinder at least for the reattachment regime (figure 5). At
 $d/D=1.0$
and 0.8,
 $w^{\ast }$
grows and
 $L_{f}^{\ast }$
and
 $h^{\ast }$
retreat from
 $L/d=1.0$
to 2.0. The changes are consistent with the increase in
 $C_{D}$
,
 $C_{D}^{\prime }$
and
 $C_{L}^{\prime }$
(figure 7). The
 $w^{\ast }$
decreases, while
 $L_{f}^{\ast }$
and
 $h^{\ast }$
increase respectively from
 $L/d=2.0$
to 2.5 for
 $d/D=1.0$
, again consistent with the reduction in
 $C_{D}$
,
 $C_{D}^{\prime }$
and
 $C_{L}^{\prime }$
. From
 $L/d=2.0$
to 2.5, the change in
 $w^{\ast }$
at
 $d/D=0.8$
is opposite to that at
 $d/D=1.0$
; that is,
 $w^{\ast }$
grows. So do
 $L_{f}^{\ast }$
and
 $h^{\ast }$
. While the variation in
 $w^{\ast }$
corresponds to a reduction in the forces, the changes in
 $L_{f}^{\ast }$
and
 $h^{\ast }$
mean the opposite. The value of
 $L_{f}^{\ast }$
is expected to influence
 $C_{D}^{\prime }$
and
 $C_{L}^{\prime }$
more than
 $C_{D}$
. Thus,
 $C_{D}$
keeps growing from
 $L/d=2.0$
to 2.5, largely due to the increase of
 $w^{\ast }$
and
 $h^{\ast }$
, while
 $C_{D}^{\prime }$
and
 $C_{L}^{\prime }$
decline because of the growth of
 $L_{f}^{\ast }$
. As a result, the maximum
 $C_{D}^{\prime }$
and
 $C_{L}^{\prime }$
occur at
 $L/d=2.0$
.
The dependence on
 $L/d$
of (a) the wake width
 $w^{\ast }$
, (b) the vortex formation length
 $L_{f}^{\ast }$
behind the downstream cylinder and (c) the lateral width
 $h^{\ast }$
of the two gap shear layers. The dashed lines indicate the critical spacing
 $(L/d)_{c}$
that separates the reattachment and co-shedding regimes.

On the other hand, while
 $w^{\ast }$
grows from
 $L/d=1.0$
to 3.0 for
 $d/D=0.6$
,
 $L_{f}^{\ast }$
and
 $h^{\ast }$
rise only up to
 $L/d=2.5$
and then
 $L_{f}^{\ast }$
retreats and
 $h^{\ast }$
remains unchanged for a further increase in
 $L/d$
(figure 14). The
 $L_{f}^{\ast }$
influence for
 $L/d<2.0$
is largely responsible for
 $C_{D}$
,
 $C_{D}^{\prime }$
and
 $C_{L}^{\prime }$
retreating. For
 $L/d>2.0$
, increase in
 $w^{\ast }$
makes a major contribution to the rise in
 $C_{D}$
,
 $C_{D}^{\prime }$
and
 $C_{L}^{\prime }$
.
The forces
 $C_{D}$
,
 $C_{D}^{\prime }$
and
 $C_{L}^{\prime }$
are not well correlated with
 $w^{\ast }$
and
 $L_{f}^{\ast }$
at
 $d/D=0.4$
and 0.2, but
 $C_{D}$
appears to be connected to
 $h^{\ast }$
, increasing with decreasing
 $h^{\ast }$
as
 $d/D$
decreases from 0.4 to 0.2. That is,
 $w^{\ast }$
,
 $L_{f}^{\ast }$
and
 $h^{\ast }$
are all connected to the forces for large
 $d/D~(=1.0{-}0.6)$
. At small
 $d/D~(=0.4{-}0.2)$
, it is the shear layers between the cylinders that are closely linked to the forces, which will be discussed in detail later. During the transition from the reattachment to the co-shedding flow,
 $w^{\ast }$
grows but
 $L_{f}^{\ast }$
and
 $h^{\ast }$
contract at
 $d/D=1.0{-}0.4$
, which is internally consistent with the jump in
 $C_{D}$
,
 $C_{D}^{\prime }$
and
 $C_{L}^{\prime }$
. The behaviour of
 $w^{\ast }$
and
 $h^{\ast }$
is opposite to that of
 $L_{f}^{\ast }$
at
 $d/D=0.2$
, resulting in a drop in
 $C_{D}$
,
 $C_{D}^{\prime }$
and
 $C_{L}^{\prime }$
.
5.4 Time-averaged lateral velocities
Important insights may be gained into the entrainment of ambient fluid into the wakes as well as the vortex formation and forces on the cylinders by examining the
 $\bar{v}^{\ast }$
-contours presented in figure 15. In the single cylinder wake (figure 15
f), the positive and negative
 $\bar{v}^{\ast }$
-contours display the same maximum magnitude at
 $y^{\ast }=\pm 0.65$
and appear to be symmetrical about the centreline (
 $y^{\ast }=0$
). The data indicate that the velocity at which the ambient fluid on the upper side of the cylinder is entrained into the wake increases up to
 $y^{\ast }\approx 0.65$
and then decreases until
 $y^{\ast }=0$
. A similar remark can be made for the entrainment of the ambient fluid on the lower side (
 $y^{\ast }<0$
). The contour pattern behind the cylinders resembles, regardless of
 $d/D$
and
 $L/d$
, that behind the isolated cylinder, with two peaks appearing in the wake, negative on the upper side and positive on the lower side. The pattern between the cylinders is, however, different and depends on the flow regime. Four peaks (two negative and two positive) occur for the reattachment flow, displaying a pattern of
 $\bullet \frac{+,-}{-,+}\bullet$
, where the solid circles represent the cylinders and ‘
 $+$
’ and ‘
 $-$
’ indicate the positive and negative peaks respectively (figure 15
a1, b1, c1, d1, e1). The two peaks (negative and positive signs) closer to the downstream cylinder are due to the impingement and convergence of the shear layers upon the downstream cylinder. The other two result from the divergence of the shear layers after their separation from the upstream cylinder. The pattern of the four peaks in the co-shedding flow is, however, opposite, i.e.
 $\bullet \frac{-,+}{+,-}\bullet$
(figure 15
a2, b2, c2, d2, e2), due to the changed fluid dynamics. The two peaks closer to the downstream cylinder result from the impingement of the upstream-cylinder-generated vortices on the downstream cylinder, and the other two are attributed to vortex shedding from the upstream cylinder like that in a single cylinder wake.
Isocontours of the time-averaged lateral velocity
 $\bar{v}^{\ast }=\bar{v}/U_{\infty }$
. The solid and dotted lines represent positive (
 ${\geqslant}0$
) and negative
 $({<}0)~\bar{v}^{\ast }$
. The contour increment is 0.02.

In the co-shedding case, the maximum
 $\bar{v}^{\ast }$
upstream of the downstream cylinder grows with a decrease in
 $d/D$
due to an enlarged impingement of vortices. The strong impingement at small
 $d/D$
can impair the impinging vortices that fail to lock-in with vortex shedding from the downstream cylinder. On the other hand, the maximum
 $\bar{v}^{\ast }$
due to vortex shedding from the upstream cylinder rises as
 $d/D$
decreases from 1.0 to 0.6 and then declines for a further decrease in
 $d/D$
.
5.5 Fluctuating lateral velocities
The
 $v_{rms}^{\ast }$
-contours display one peak between the cylinders and another peak behind them (figure 16). During the flow transition from reattachment to co-shedding, the maximum
 $v_{rms}^{\ast }$
grows between the cylinders for all values of
 $d/D$
but varies differently behind the cylinders, dropping at
 $d/D=1.0$
and 0.8, being almost unchanged at
 $d/D=0.6$
and 0.4, and contracting again at
 $d/D=0.2$
. It is now clear that the rise in
 $C_{D}^{\prime }$
and
 $C_{L}^{\prime }$
at
 $d/D=1.0{-}0.4$
(figure 7
b,c) results from a large change in the velocity fluctuation between the cylinders. At
 $d/D=0.2$
, the influence on
 $C_{D}^{\prime }$
and
 $C_{L}^{\prime }$
of the contracting
 $v_{rms}^{\ast }$
behind the cylinders perhaps overwhelms that of the rising
 $v_{rms}^{\ast }$
between the cylinders, thus accounting for the plunge in
 $C_{D}^{\prime }$
and
 $C_{L}^{\prime }$
.
Isocontours of the r.m.s. lateral velocity
 $v_{rms}^{\ast }=v_{rms}/U_{\infty }$
. The contour increment is 0.02.

6 Discussion
It is of fundamental importance to gain an in-depth understanding on why
 $C_{D}$
,
 $C_{D}^{\prime }$
and
 $C_{L}^{\prime }$
all jump at
 $(L/d)_{c}$
at
 $d/D=1.0{-}0.4$
but drop at
 $d/D=0.2$
. The possible physical aspects of the flow behind the observation are listed in table 1 and the major flow features are schematically presented in figure 17, taking
 $d/D=0.8$
and 0.2 as examples that correspond to the lock-in and no lock-in cases respectively of the co-shedding flow (figure 8). Four combinations are possible given the two
 $d/D$
values and whether the flow is in the reattachment or co-shedding flow regime. As such, we use four levels of description to differentiate the characteristics, i.e. very large, large, small and very small. It is well established that
 $St$
and the forces are closely related to
 $L_{f}^{\ast }$
,
 $w^{\ast }$
,
 $h^{\ast }$
,
 $\bar{u}_{sh}^{\ast }$
,
 $\bar{u}_{app}^{\ast }$
, the recirculation bubble size and the vortex shedding strength. The maximum
 $\unicode[STIX]{x1D714}^{\ast }$
provides a measure for the vortex shedding strength (Saha Reference Saha2007). While
 $St$
is largely connected to
 $\bar{u}_{sh}^{\ast }$
, the
 $w^{\ast }$
,
 $L_{f}^{\ast }$
and
 $h^{\ast }$
are more linked to
 $C_{D}^{\prime }$
and
 $C_{L}^{\prime }$
.
Sketch of the flow characteristics around two cylinders for
 $d/D=0.8$
and
 $d/D=0.2$
. While the solid lines indicate the shear layers, the dashed lines represent the recirculation bubble. The circles filled with dots mark the location of the maximum
 $u_{rms}^{\ast }$
, indicating the vortex formation length and wake width. Flow is from left to right.

The characteristics of the flow for
 $d/D=0.8$
and 0.2.
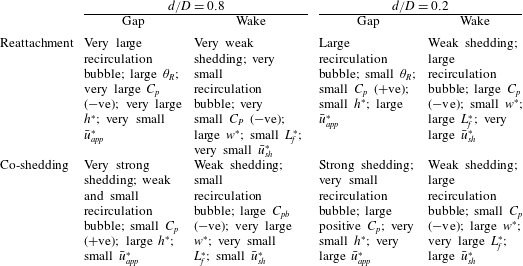
We consider first the reattachment case (e.g.
 $L/d=3.0$
) at
 $d/D=0.8$
. The flow between the cylinders is characterized by a very large recirculation bubble, with the shear layer impinging at a large
 $\unicode[STIX]{x1D703}_{R}$
. The
 $\bar{u}_{app}^{\ast }$
is very small,
 $C_{P}$
on the front surface is pronouncedly negative, and
 $h^{\ast }$
is very large. The flow behind the cylinders is associated with a small recirculation bubble and very weak vortex shedding, along with very small
 $\bar{u}_{sh}^{\ast }$
, large
 $w^{\ast }$
and small
 $L_{f}^{\ast }$
. The observations are coupled with very small
 $C_{P}$
(
 $-$
ve) in magnitude on the rear surface of the downstream cylinder, where the comparison in
 $C_{P}$
is made between the average pressures over
 $\unicode[STIX]{x1D703}=0^{\circ }{-}45^{\circ }$
of the front surface and over
 $\unicode[STIX]{x1D703}=135^{\circ }{-}180^{\circ }$
of the rear surface. Then, we look at the co-shedding flow (e.g.
 $L/d=3.5$
) at the same
 $d/D$
. The gap flow between the cylinders is associated with a small recirculation bubble but strong vortex shedding. Both
 $\bar{u}_{app}^{\ast }$
and
 $C_{P}$
(
 $+$
ve) on the front surface are small, while
 $h^{\ast }$
is large. On the other hand, the wake behind the cylinders is characterized by a small recirculation bubble and weak vortex shedding. Accordingly, the magnitude of
 $C_{P}$
(
 $-$
ve) is large and
 $\bar{u}_{sh}^{\ast }$
is small, while
 $w^{\ast }$
is very large and
 $L_{f}^{\ast }$
is very small. We are now ready to provide a picture behind the jump in
 $St$
,
 $C_{D}$
,
 $C_{D}^{\prime }$
and
 $C_{L}^{\prime }$
during the transition from the reattachment and co-shedding regimes. The
 $St$
jumps largely due to an increase in both
 $\bar{u}_{app}^{\ast }$
and
 $\bar{u}_{sh}^{\ast }$
in the co-shedding flow. The jump in
 $C_{D}$
results from a change in
 $C_{P}$
on the front surface of the cylinder from negative to positive and that on the rear surface from negative to pronouncedly negative. On the other hand, the rapid rise in
 $C_{D}^{\prime }$
and
 $C_{L}^{\prime }$
is produced by the impingement of the upstream-cylinder-generated strong vortices and the lock-in with each other of the vortex sheddings from both cylinders. The result is also accompanied by an increase in
 $w^{\ast }$
and a reduction in
 $L_{f}^{\ast }$
and
 $h^{\ast }$
.
At very small
 $d/D$
such as 0.2, the flow is distinct from that at large
 $d/D$
, i.e. 0.8. In the reattachment flow regime (
 $L/d=6.0$
), the gap flow between the cylinders is accompanied by a large recirculation bubble, small
 $\unicode[STIX]{x1D703}_{R}$
, large
 $\bar{u}_{app}^{\ast }$
, small
 $C_{P}$
(
 $+$
ve) at the forward stagnation point and small
 $h^{\ast }$
. The flow behind the cylinders is rather distinct. The magnitude of
 $C_{P}$
(
 $-$
ve) on the rear surface of the downstream cylinder is large. Naturally, vortex shedding is weak, with very large
 $\bar{u}_{sh}^{\ast }$
, and a large recirculation bubble occurs, associated with small
 $w^{\ast }$
and large
 $L_{f}^{\ast }$
. In the co-shedding regime (
 $L/d=7.0$
), the recirculation bubble between the cylinders is very small but vortex shedding from the upstream cylinder is strong. Thus,
 $\bar{u}_{app}^{\ast }$
is very large,
 $C_{P}$
at the forward stagnation point of the downstream cylinder is large (
 $+$
ve) and
 $h^{\ast }$
is very small. Different observations are made in the wake of the downstream cylinder. The value of
 $C_{P}$
on the rear surface of the cylinder is small (
 $-$
ve) and the vortex shedding is weak, corresponding to a large recirculation bubble,
 $\bar{u}_{sh}^{\ast }$
and
 $w^{\ast }$
. The value of
 $L_{f}^{\ast }$
is also very large. We compare the two regimes. The value of
 $\bar{u}_{sh}^{\ast }$
reduces in spite of an increased
 $\bar{u}_{app}^{\ast }$
, resulting in a mild drop in
 $St$
(figure 4). The value of
 $C_{P}$
increases on the front surface but decreases in magnitude on the rear surface; the latter change overwhelms the former, leading to a drop in
 $C_{D}$
. The
 $C_{D}^{\prime }$
and
 $C_{L}^{\prime }$
drop because of longer
 $L_{f}^{\ast }$
and the absence of the lock-in. The sketches presented in figure 17 show clearly how the different flow features change with
 $d/D$
decreasing in the reattachment and co-shedding regimes.
Our earlier observations from figures 4 and 8 indicate that the
 $(L/d)_{c}$
corresponding to the occurrence of the bistable flow is increased nonlinearly with decreasing
 $d/D$
. As such, the variation in
 $(L/d)_{c}$
with
 $d/D$
is characterized by a negative curvature at
 $d/D>0.6$
but positive at
 $d/D<0.6$
. A question may arise on whether we could find a scaling factor so that the rescaled
 $(L/d)_{c}$
is independent of
 $d/D$
. The occurrence of the bistable flow involves largely the shear layers separated from the upstream cylinder. Thus, the initial conditions (e.g.
 $Re$
,
 $d/D$
,
 $L/d$
,
 $T_{u}$
) of the upstream-cylinder wake are crucial to understand the nonlinear nature and variation in
 $(L/d)_{c}$
. Presently,
 $U_{\infty }$
and
 $T_{u}$
are constant. Although unchanged based on
 $D$
, the Reynolds number does change, if based on
 $d$
, from
 $4.27\times 10^{4}$
to
 $8.0\times 10^{3}$
as
 $d/D$
is decreased from 1.0 to 0.2. The occurrence of the bistable flow depends on the critical condition at which the shear layers are both able and unable to reattach on the downstream cylinder. The streamwise distance from the cylinder centre, i.e.
 $L_{f}^{\ast }$
, of the shear layer roll up should be the key parameter responsible for the occurrence of the bistable flow at
 $(L/d)_{c}$
for various values of
 $d/D$
. For the co-shedding flow that also occurs intermittently at
 $(L/d)_{c}$
, the effect of the downstream cylinder on the upstream-cylinder wake is small (Alam & Sakamoto Reference Alam and Sakamoto2005; Alam & Zhou Reference Alam and Zhou2007a
); that is, the upstream cylinder behaves almost like an isolated single cylinder. It has been well established that
 $L_{f}^{\ast }$
in a single cylinder wake is dependent on
 $Re$
(Gerrard Reference Gerrard1978; Ljungkrona & Sunden Reference Ljungkrona and Sunden1993). Figure 18(a) presents the variation in
 $L_{f}^{\ast }$
in the Reynolds number range of
 $4.27\times 10^{4}$
to
 $8.0\times 10^{3}$
, where the data collected from the literature were obtained under almost the same experimental conditions in terms of the Reynolds number, aspect ratio and turbulent intensity. Obviously,
 $L_{f}^{\ast }$
retreats from
 $Re_{d}=6.0\times 10^{3}$
to
 $5.0\times 10^{4}$
. Interestingly, the
 $L_{f}^{\ast }$
variation exhibits positive and negative curvatures at
 $Re_{d}>2.56\times 10^{4}$
(
 $d/D>0.6$
) and
 ${<}2.56\times 10^{4}$
(
 $d/D<0.6$
) respectively, opposite to those in the
 $(L/d)_{c}$
variation with
 $d/D$
(figure 18
b), reflecting that
 $(L/d)_{c}$
is inversely related to
 $d/D$
and directly correlated with
 $L_{f}^{\ast }$
. We rescale
 $L/d$
by
 $L_{f}^{\ast }$
, i.e.
 $(L/d)/L_{f}^{\ast }$
, where the choice of
 $L_{f}^{\ast }$
follows the mean trend (dashed line), given by 2.5, 1.8, 1.4, 1.3 and 1.1 for
 $Re_{d}=8.0\times 10^{3}$
,
 $1.71\times 10^{4}$
,
 $2.56\times 10^{4}$
,
 $3.41\times 10^{4}$
and
 $4.27\times 10^{4}$
respectively. The nonlinear variation in
 $L/d$
with
 $d/D$
(figure 18
b) now collapses on a horizontal line (figure 18
c); that is, the rescaled critical spacing
 $(L/d)_{c}/L_{f}^{\ast }$
is approximately a constant. The reattachment and co-shedding regimes appear at
 $(L/d)/L_{f}^{\ast }<2.26$
and
 $(L/d)/L_{f}^{\ast }>2.64$
respectively, while the bistable flow occurs over
 $(L/d)/L_{f}^{\ast }=2.26{-}2.64$
, irrespective of
 $d/D$
.
(a) Dependence of
 $L_{f}^{\ast }$
on
 $Re$
for a single cylinder. (b) Flow classification in the
 $d/D{-}L/d$
plane. (c) Flow classification in the
 $d/D{-}(L/d)/L_{f}^{\ast }$
plane. The dashed lines in (b,c) represent the boundaries between flow regimes.

It is well known that the upstream cylinder plays a main role in the control of the flow around two tandem cylinders. Igarashi (Reference Igarashi1982) experimentally investigated the flow over two tandem cylinders with
 $d/D=1.47$
(
 $L/d=0.9{-}4.0$
,
 $Re=1.9{-}5.8\times 10^{4}$
) and observed three distinct flow patterns (reattachment, bistable and co-shedding), similarly to the patterns classified by Igarashi (Reference Igarashi1981) for
 $d/D=1.0$
. However, a systematic study has so far not been reported. It is expected that the two tandem cylinder wake of
 $d/D>1.0$
will involve the flow physics in a way distinct in many aspects from that of
 $d/D\leqslant 1.0$
and will be a topic worth exploring.
7 Conclusions
The effect of an upstream cylinder on wake dynamics is systematically studied over
 $d/D=1.0{-}0.2$
and
 $L/d=1.0{-}8.0$
, including the flow structures in the gap and behind the cylinders, the Strouhal numbers, and the forces on and pressure distribution around the downstream cylinder. A number of conclusions can be drawn.
The flow is classified into the reattachment and co-shedding regimes based on whether the shear layer separated from the upstream cylinder reattaches on the downstream cylinder or not. In the reattachment regime,
 $St$
detected between the cylinders is the same as that behind them at given
 $d/D$
and
 $L/d$
. The
 $St$
rises with the decreasing
 $d/D$
, caused by a shift in the shear layer reattachment position towards the front stagnation point. The co-shedding flow regime is further divided into the lock-in, subharmonic lock-in and no lock-in regions based on the relationship between
 $St$
between the cylinders and that behind them. The lock-in occurs at
 $d/D=0.8{-}1.0$
, where vortex shedding from the downstream cylinder is triggered by the impingement of the upstream-cylinder-generated vortices, and
 $St$
between the cylinders is identical to that behind. The subharmonic lock-in takes place at
 $d/D=0.6$
, when
 $St$
behind the cylinders is one-half of that between them. There is no lock-in at all at
 $d/D=0.2{-}0.4$
, at which the upstream-cylinder-generated vortices are small in size and are so weak when impinging upon the downstream cylinder that they fail to trigger vortex shedding from the downstream cylinder. In this case,
 $St$
is larger between the cylinders than that behind them.
An in-depth understanding is gained of the inter-relationship between the forces on the downstream cylinder and the physical aspects of flow. The pressure coefficient
 $C_{P}$
around the cylinder and hence the forces depend strongly on
 $L/d$
and
 $d/D$
, as a variation in
 $L/d$
or
 $d/D$
may change the reattachment position
 $\unicode[STIX]{x1D703}_{R}$
, vortex generation and impingement, and other characteristic flow properties including the averaged approaching flow velocity
 $\bar{u}_{app}^{\ast }$
, averaged shear layer velocity
 $\bar{u}_{sh}^{\ast }$
, wake width
 $w^{\ast }$
, vortex formation length
 $L_{f}^{\ast }$
and lateral width
 $h^{\ast }$
between the two gap shear layers. Given
 $L/d$
,
 $C_{P}$
on the front surface and reattachment point increases with decreasing
 $d/D$
. So does
 $C_{D}$
. The results are linked to the fact that a decreasing
 $d/D$
produces a narrow wake and hence a small
 $\unicode[STIX]{x1D703}_{R}$
and
 $h^{\ast }$
and a large
 $\bar{u}_{app}^{\ast }$
and also
 $\bar{u}_{sh}^{\ast }$
. The forces
 $C_{D}^{\prime }$
and
 $C_{L}^{\prime }$
are even more sensitive to
 $d/D$
and
 $L/d$
, weakened from
 $d/D=1.0$
to 0.6 but enhanced from
 $d/D=0.4$
to 0.2, because of the direct impact by the shear layer or vortex impingement. While the weakened impingement is attributed to weak vortex shedding from the downstream cylinder, the enhancement is ascribed to increased impingement by the shear layer or vortices upon the front surface. It is found that the forces are largely correlated to the downstream-cylinder wake for
 $d/D=1.0{-}0.6$
but the shear layer or vortices between the cylinders for
 $d/D=0.4{-}0.2$
.
In the transition from reattachment to co-shedding,
 $C_{D}$
,
 $C_{D}^{\prime }$
and
 $C_{L}^{\prime }$
all jump for
 $d/D=1.0{-}0.4$
but drop for
 $d/D=0.2$
; yet,
 $St$
rises for
 $d/D=1.0{-}0.8$
and drops for
 $d/D=0.6{-}0.2$
. The difference arises because
 $St$
and the forces are not equally correlated with
 $\bar{u}_{app}^{\ast }$
and
 $\bar{u}_{sh}^{\ast }$
, both of which play an important role in influencing
 $St$
and the forces. The
 $\bar{u}_{sh}^{\ast }$
rises rapidly at
 $(L/d)_{c}$
for
 $d/D=1.0{-}0.8$
, resulting in the jump in
 $St$
, but declines for
 $d/D=0.4{-}0.2$
, causing the drop in
 $St$
. The
 $\bar{u}_{app}^{\ast }$
, partially included in
 $\bar{u}_{sh}^{\ast }$
, has a weak influence on
 $St$
by itself. The
 $\bar{u}_{sh}^{\ast }$
and
 $\bar{u}_{app}^{\ast }$
influence the pressures on the rear and front surfaces respectively and thus both are connected to the forces. The jump in the forces at
 $d/D=1.0{-}0.8$
occurs as both
 $\bar{u}_{app}^{\ast }$
and
 $\bar{u}_{sh}^{\ast }$
go up rapidly. At
 $d/D=0.6{-}0.4$
,
 $\bar{u}_{app}^{\ast }$
and
 $\bar{u}_{sh}^{\ast }$
impose opposite influences on the forces and their combined effect leads to a jump in the forces because of the dominant influence of
 $\bar{u}_{app}^{\ast }$
. At
 $d/D=0.2$
,
 $\bar{u}_{sh}^{\ast }$
outplays
 $\bar{u}_{app}^{\ast }$
in influencing the forces and thus its drop is responsible for the drop in the forces. It has been well documented in the literature that the forces and
 $St$
jump at
 $(L/d)_{c}$
for
 $d/D=1.0$
. It is the first time that a drop in the forces and/or
 $St$
has been observed at
 $(L/d)_{c}$
for small
 $d/D=0.2{-}0.6$
. At such small
 $d/D$
, the gap shear layers in the reattachment regime are narrow and reattach at small
 $\unicode[STIX]{x1D703}_{R}$
, giving rise to a large
 $\bar{u}_{sh}^{\ast }$
. However, unsteady gap vortices occur as a result of the change to the co-shedding mode, which act to enhance the lateral momentum transport of the gap flow and hence to reduce
 $\bar{u}_{sh}^{\ast }$
, resulting in a drop in
 $St$
and/or the forces.
The critical spacing
 $(L/d)_{c}$
is found to scale with the vortex formation length
 $L_{f}^{\ast }$
of the upstream-cylinder wake. The behaviour of the shear layers separated from the upstream cylinder dictates the occurrence of the bistable flow. From
 $d/D=1.0$
to 0.2, the initial condition or
 $Re_{d}$
of the upstream-cylinder wake varies from
 $4.27\times 10^{4}$
to
 $8.0\times 10^{3}$
, resulting in a significant variation in
 $L_{f}^{\ast }$
. The critical spacing
 $(L/d)_{c}$
is found to be inversely related to
 $d/D$
and directly correlated with
 $L_{f}^{\ast }$
, ranging from 2.75–3.00 to 6.0–7.0 for
 $d/D=1.0{-}0.2$
. The rescaled critical spacing
 $(L/d)_{c}/L_{f}^{\ast }$
is independent of
 $d/D$
over the range of
 $(L/d)_{c}/L_{f}^{\ast }=2.26{-}2.64$
.
Acknowledgements
The authors wish to acknowledge the support given to them by NSFC through grants 11672096 and 11632006 and by the Research Grant Council of the Shenzhen Government through grant JCYJ20160531191442288.