Introduction
Mild cognitive impairment (MCI) is a predementia syndrome characterized by cognitive decline greater than normal for age, but which does not significantly impair daily functioning (Winblad et al., Reference Winblad2004; Petersen et al., Reference Petersen2009). Individuals with MCI progress to dementia at a rate of about 6%–15% per year, compared to about 1%–2% per year in the general older population (DeCarli, Reference DeCarli2003; Petersen et al., Reference Petersen2009). A number of clinical subtypes have been proposed to further categorize MCI. Two main subtypes are amnestic MCI (aMCI), in which memory is impaired and is thought to represent early Alzheimer's disease (AD), and non-amnestic MCI (naMCI) in which one or more non-memory cognitive domains (e.g. frontal-executive function, language, visuospatial ability) are affected and which may be associated with an increased risk of progressing to non-Alzheimer's dementias (Petersen, Reference Petersen2004; Winblad et al., Reference Winblad2004; Yaffe et al., Reference Yaffe, Petersen, Lindquist, Kramer and Miller2006; Mariani et al., Reference Mariani, Monastero and Mecocci2007b). However, evidence for pathological differences between subtypes is lacking and the validity of these subtypes is uncertain.
Previous neuroimaging studies have examined the differences in brain volume and white matter lesion load between different MCI subtypes and healthy controls. Atrophy has been observed in parietal and temporal lobes, posterior cingulate, and hippocampus in aMCI (Whitwell et al., Reference Whitwell2007; He et al., Reference He, Farias, Martinez, Reed, Mungas and Decarli2009; van de Pol et al., Reference van de Pol2009). In naMCI, atrophy has been seen in the frontal, parietal, temporal, and occipital lobe, and basal forebrain (Whitwell et al., Reference Whitwell2007). Reports on associations between white matter hyperintensities (WMH) and subtypes have been conflicting. Higher WMH load has been more strongly associated with aMCI in one report (Luchsinger et al., Reference Luchsinger2009) and naMCI in another (Mariani et al., Reference Mariani2007a). Individuals with naMCI have been found to have greater levels of cortical infarction (Kantarci et al., Reference Kantarci2008; Luchsinger et al., Reference Luchsinger2009).
Diffusion tensor imaging (DTI) measures both the magnitude and direction of diffusion in tissue and can provide information about cerebral microstructural integrity. Two commonly used DTI parameters are: mean diffusivity (MD), a measure of the water motility in tissue, and fractional anisotropy (FA), an index of the restriction of diffusion to one direction. Damage to brain tissue is generally accompanied by increased MD and decreased FA. Many recent studies using DTI have found changes in a range of regions including the frontal, temporal, and parietal white matter, anterior and posterior cingulate, fornix, hippocampal formation, and splenium of the corpus callosum in MCI (Fellgiebel et al., Reference Fellgiebel2004; 2005; Medina et al., Reference Medina2006; Huang et al., Reference Huang, Friedland and Auchus2007; Zhang et al., Reference Zhang2007; Shim et al., Reference Shim, Yoon, Shon, Ahn and Yang2008; Lee et al., Reference Lee2009; Mielke et al., Reference Mielke2009). These studies have, however, used small sample sizes, ranging from 12 to 168 subjects, and have only compared aMCI patients with normal controls.
Our objectives were to examine the diffusion tensor imaging changes in MCI in a large community-based older aged cohort, and to investigate the characteristics of amnestic and non-amnestic MCI subtypes using DTI. Identifying changes in MCI subtypes is the first step to evaluating the predictive capacity of DTI, which, in turn, may assist in easy and early identification of those at risk of dementia and predict the progression to Alzheimer's disease and other dementias.
Methods
The study sample was drawn from the Sydney Memory and Ageing Study, a population-based longitudinal study investigating neurocognitive disorders in the older population (Sachdev et al., Reference Sachdev2010). The study was approved by the ethics committees of the University of New South Wales and the South-Eastern Sydney Illawarra Area Health Service – Northern Sector, Sydney, Australia.
Community-dwelling persons aged 70–90 years were randomly selected from the electoral roll from two local government areas in Eastern Sydney and sent a letter inviting them to participate in the study. Participants were recruited and examined between September 2005 and November 2007. Of the 8,914 invited, 1,772 people who accepted were screened via a telephone interview. Those people living in the community, with adequate knowledge of English to complete the neuropsychological assessment, were included in the study. Ideally, each participant would have an informant who had at least 1 hour contact per week and was capable of answering questions about the participant's memory and daily activities. Participants were excluded if they had a previous diagnosis of dementia, schizophrenia, or bipolar disorder, multiple sclerosis, motor neuron disease, developmental disability, progressive cancer, or other medical or psychological conditions preventing them from completing the assessment. After the telephone interview, 735 individuals were either ineligible or declined.
Participants then underwent a face-to-face interview, a detailed medical assessment, and neuropsychological testing. Participants were excluded if they scored less than 24 on the Mini-Mental State Examination (MMSE) or were diagnosed with dementia after the comprehensive assessment.
Each participant's informant completed a phone interview. The participant's level of functional impairment was assessed with the Bayer Activities of Daily Living (B-ADL) scale (Lawton and Brody, Reference Lawton and Brody1969; Hindmarch et al., Reference Hindmarch, Lehfeld, de Jongh and Erzigkeit1998).
Neuropsychological testing
The participants underwent a comprehensive battery of neuropsychological tests to examine attention/processing speed (WAIS-III Digit Symbol (Wechsler, Reference Wechsler1997a) and Trail Making Test Part A (Reitan and Wolfson, Reference Reitan and Wolfson1993)), memory (WMS-III Logical Memory Story A (Wechsler, Reference Wechsler1997b), Rey Auditory Verbal Learning Test (Rey, Reference Rey1964), Benton Visual Retention Test-recognition (Benton et al., Reference Benton, Sivan and Spreen1996)), language (30-item Boston Naming Test (Kaplan et al., Reference Kaplan, Goodglass and Weintraub2001) and Semantic Fluency (Spreen and Benton, Reference Spreen and Benton1969)), visuospatial ability (WAIS-R Block Design (Wechsler, Reference Wechsler1981)), and frontal-executive function (Controlled Oral Word Association Test (FAS) (Benton, Reference Benton1967) and Trail Making Test Part B (Reitan and Wolfson, Reference Reitan and Wolfson1993)).
Classification
Eight hundred and twenty-seven participants with a complete neuropsychological dataset, an informant interview, and who had English proficiency adequate for conversation acquired at less than nine years of age were then classified as MCI or normal based on international MCI consensus criteria (Winblad et al., Reference Winblad2004):
1. Complaint of cognitive decline from participant or informant.
2. Objective cognitive impairment – a score at least 1.5 SD below age- and education-corrected normative values for at least one test in the neuropsychological battery.
3. Without dementia.
4. Normal functioning in activities in daily living – an informant rating of less than 3.0 on Bayer ADL scale.
Those with MCI were then divided into two subtypes (Petersen, Reference Petersen2004):
1. Amnestic MCI – impairment in memory domain with or without impairment in other domains.
2. Nonamnestic MCI – impairment in one or more non-memory domains.
Neuroimaging
All 827 participants without contraindications (pacemaker, metallic implant or foreign bodies, cochlear implants, ferromagnetic homeostatic clips, claustrophobia) were invited to undergo MRI scans comprising of T1-weighted imaging, fluid-attenuated inversion recovery imaging (FLAIR), and DTI. The DTI data of 396 subjects who accepted this invitation and did not have any contraindication are used in this study.
Image acquisition
A change in scanner part way through the recruitment resulted in images being acquired on two scanners. The first 226 subjects were scanned using a Phillips 3T Intera Quasar scanner (Phillips Medical Systems, Best, The Netherlands). The remaining 170 subjects were scanned on a Phillips 3T Achieva Quasar Dual Scanner. Both scanners are located at the Prince of Wales Medical Research Institute, Sydney. The same acquisition parameters were used for both scanners. There were significant differences in some DTI variables between the two scanners. To correct for this, the scanner was included as a binary covariate in all analyses.
For the DTI imaging, sensitivity encoding (SENSE) echo planar imaging was used (in-plane resolution 1.953 × 1.953 mm, 38 slices; 3.5 mm thick; 0 gap; TR 6130.41ms; TE 68 ms; matrix 128 × 128; flip angle 90°; FOV 250 × 133 × 250 mm). Diffusion-weighted images (b = 1000 s/mm2) were obtained in six directions and one image without any diffusion weighting (b = 0 s/mm2).
Image processing
DTI data were processed using FSL 4.1.4 (FMRIB's Software Library, http://www.fmrib.ox.ac.uk/fsl) (Smith et al., Reference Smith2004). The images were corrected for eddy current and head motion effects using the linear image registration tool, and were skull-stripped using the brain extraction tool. The FSL diffusion toolbox was used to calculate the diffusion tensor eigenvalues, which were used to generate FA, MD, and color-coded DTI. All images were stripped of identifying data, so that the region of interest analysis was performed blinded to any details about the participants.
Region of interest analysis
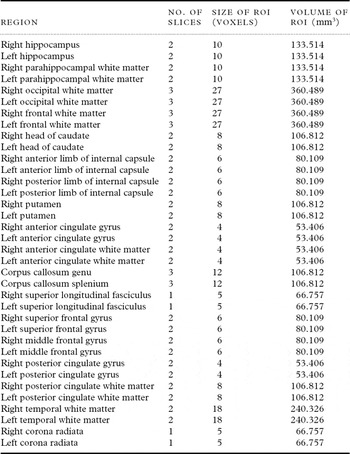
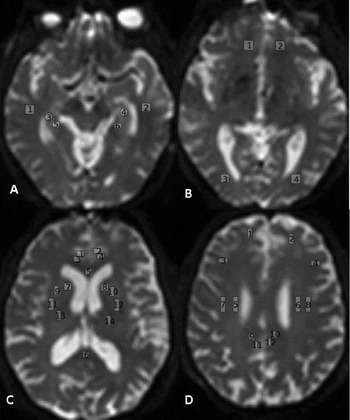
Regions of interest (ROIs) were traced using the ROI module in the Analyze 10.0 Software package (BIR, Mayo Clinic, Rochester, MN). A protocol for drawing ROIs was developed with reference to neuroanatomy atlases. To improve the accuracy of ROI placement, T1-weighted images of each subject were coregistered to the B0 image. The ROI were drawn on the B0 image with the T1 image viewed on a second screen to confirm the anatomy. The regions examined included the hippocampus, parahippocampal gyrus, frontal white matter, temporal white matter, occipital white matter, anterior and posterior limb of the internal capsule, caudate, putamen, anterior and posterior cingulate gyrus, genu and splenium of the corpus callosum, superior longitudinal fasciculus, and corona radiata. For all regions except the corpus callosum, pairs of ROIs were drawn for the left and right hemispheres. The ROIs are described in Table 1 and Figure 1.
List of regions

Exemplar scan illustrating locations of regions of interest A) 1,2 – Right and left temporal white matter, 3,4 – Right and left hippocampus, 5,6 – Right and left parahippocampal gyrus B) 1,2 – Right and left frontal white matter, 3,4 – Right and left occipital white matter C) 1, 2 – Right and left anterior cingulate gyrus, 3, 4 – Right and left anterior cingulate white matter, 5, 6 – Genu and splenium of the corpus callosum, 7, 8 – Right and left caudate, 9, 10 – Right and left anterior limb of the internal capsule, 11, 12 – Right and left putamen, 13, 14 – Right and left posterior limb of the internal capsule, D) 1,2 – Right and left superior frontal gyrus, 3,4 – Right and left middle frontal gyrus, 5,6 – Right and left corona radiata, 7, 8 – Right and left superior longitudinal fasciculus, 9, 10 – Right and left posterior cingulate white matter, 11, 12 – Right and left posterior cingulate gyrus.

Inter-rater and intra-rater reliability
Inter-rater reliability was assessed on two occasions; first, when commencing the ROI analysis and then after analyzing 200 images. On both occasions, ROIs were drawn on five randomly selected images by two independent raters. The intra-class correlation (ICC) was calculated based on the FA measurements of both raters. The ICC was above 0.8 for all regions except the bilateral putamen and posterior limb of the internal capsule.
Intra-rater reliability was assessed by repeating ROI drawings on five images. The ICC was calculated based on the FA measurements on both occasions. This procedure was repeated after analyzing 200 images and after all images were analyzed. The ICC was above 0.8 for all regions.
Statistical analysis
Statistical analysis was performed using PASW version 18.0 (SPSS Inc., Chicago, IL, USA). The baseline characteristics were compared using analysis of variance (ANOVA) and χ2 tests. The outliers (values more than three standard deviations from the group mean) in the DTI data were deleted as these values were probably caused by noise. Mean MD and FA values between MCI and normal were compared using ANCOVA analysis, with age, sex, education, and scanner as covariates. Normal, aMCI, and naMCI group FA and MD values were also compared using ANCOVA, with age, sex, education, and scanner as covariates. In each set of ANCOVA analyses, false discovery rate (FDR) adjustment for multiple testing was applied for the 36 regions.
The regions with significant mean differences in the ANCOVA analysis were then selected for multivariable logistic regression analyses, with age, sex, education, and scanner included in the model as control variables. Stepwise regression was used to determine the best combination of predictors of MCI and its subtypes.
Results
The demographic characteristics, MMSE scores, and cardiovascular risk factors of the groups are shown in Table 2. The MCI group was significantly older, had significantly lower MMSE scores, and were more likely to be smokers than controls. The aMCI group was older and more likely to be male, had more years of education, and less likely to have hypertension than the naMCI groups.
Demographics, MMSE scores, and vascular risk factors for the different groups

ap-value from ANOVA; bp-value from χ2 tests; p-values for pairwise comparisons were adjusted using Bonferroni correction.
MCI = mild cognitive impairment; aMCI = amnestic mild cognitive impairment; naMCI = non-amnestic mild cognitive impairment; BMI = body mass index; MMSE = Mini-Mental State Examination.
Comparisons of FA and MD between controls and MCI groups
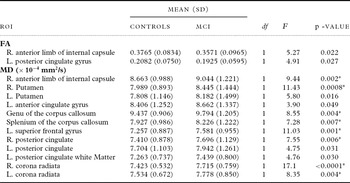
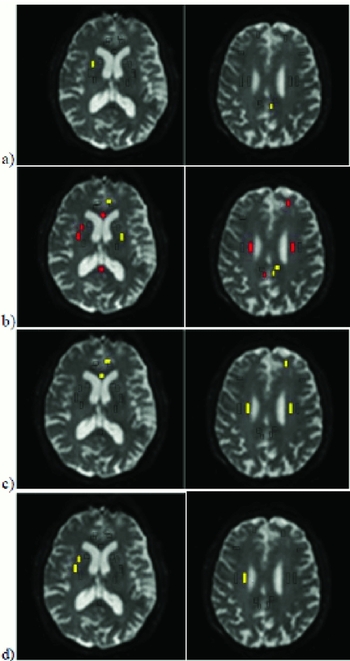
Regions with significant FA or MD differences between controls and MCI groups are shown in Table 3, and Figure 2. There were no significant FA differences between the controls and MCI group after FDR correction for multiple testing.
Regions with significant differences in FA and MD between control and MCI groups

*Results significant after FDR adjustment for multiple testing; covariates were scanner effect, age, sex, and years of education.
ROI = Regions of interest; MCI = mild cognitive impairment.
Regions with significantly a) decreased FA and b) increased MD in MCI and regions with significantly increased MD in c) aMCI and d) naMCI relative to healthy controls. Yellow – p < 0.05 (uncorrected), Red – significant after FDR adjustment.

After FDR correction for multiple testing, the MCI group had significantly higher MD in the right anterior limb of the internal capsule, right putamen, genu and splenium of the corpus callosum, left superior frontal gyrus, and bilateral corona radiata compared to the controls. Because there were significant differences in smoking and hypertension between MCI groups and controls, the ANCOVA analyses were repeated for significant regions using smoking and hypertension as additional covariates. After controlling for these vascular risk factors, the MD differences between MCI and controls in the left corona radiata were no longer significant.
Comparisons of FA and MD between controls, aMCI, and naMCI groups
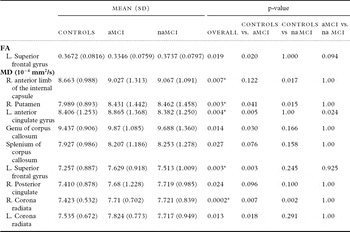
In the ANCOVA analysis, the only significant group difference in FA was found in the left superior frontal gyrus (see Table 4), but this was not significant after FDR correction for multiple testing. On post-hoc pairwise comparisons, the aMCI group had significantly lower FA in the left superior frontal gyrus compared with controls. Group MD differences were found in nine regions, and in five of these after correction for multiple testing (Table 4 and Figure 2). In post-hoc comparisons, the aMCI group had significantly increased MD in the right putamen, left anterior cingulate gyrus, genu of the corpus callosum, left superior frontal gyrus, and bilateral corona radiata compared with controls. The aMCI group also had higher MD in the left anterior cingulate gyrus compared to the naMCI group. After controlling for smoking and hypertension, the changes in the left anterior cingulate and genu of the corpus callosum were not significant. The naMCI group had significantly elevated MD in the right anterior limb of the internal capsule, right putamen, and right corona radiata compared with normal controls. The changes in the right corona radiata were no longer significant after controlling for smoking and hypertension.
Regions with significant FA and MD differences between controls, aMCI, and naMCI

*Results significant after FDR adjustment for multiple testing; p-values for pairwise comparisons were adjusted using Bonferroni correction; covariates were scanner effect, age, sex, and years of education.
aMCI = amnestic mild cognitive impairment; naMCI = non-amnestic mild cognitive impairment.
Binary logistic regression analyses to predict MCI and its subtypes
Regions for which significant differences were demonstrated in the ANCOVA analyses were entered together into a regression model, along with scanner, age, sex, and education as covariates. As multiple regions were not significant, final models were obtained using stepwise regression analysis (Table 5).
Results of stepwise binary logistic regressiona to predict MCI from controls

aAge, sex, education, and scanner included in the model as control variables.
OR = odds ratio; MCI = mild cognitive impairment; MD = mean diffusivity; aMCI = amnestic mild cognitive impairment; naMCI = non-amnestic mild cognitive impairment; FA = fractional anisotropy.
MD in the genu of the corpus callosum, left superior frontal gyrus, and right corona radiata emerged as the best combination of predictors for MCI (Cox and Snell R 2 = 0.102). FA in the left frontal superior gyrus and MD in the genu of the corpus callosum, left anterior cingulate gyrus, and right corona radiata emerged as the best combination for predicting aMCI (Cox and Snell R 2 = 0.160). MD in the right putamen, right corona radiata, and genu of the corpus callosum formed the best combination for predicting naMCI (Cox and Snell R 2 = 0.112). In the analysis to distinguish between aMCI and naMCI, FA in the left superior frontal gyrus and MD in the left anterior cingulate gyrus emerged as the best predictors. Lower FA in the left superior gyrus and higher MD in the left anterior cingulate gyrus were associated with an increased likelihood of having aMCI rather than naMCI.
Discussion
The present study provides further evidence that microstructural cerebral abnormalities occur in mild cognitive impairment and sheds some light on the differences between the two main MCI subtypes. The key finding was that individuals with MCI have decreased MD in the right putamen, right anterior limb of the internal capsule, genu and splenium of the corpus callosum, left anterior cingulate gyrus, right posterior cingulate gyrus, left superior frontal gyrus, and right corona radiata.
Our findings are largely in agreement with previous studies which have reported changes in anterior and posterior cingulate, corpus callosum, and frontal white matter on DTI (Fellgiebel et al., Reference Fellgiebel2005; Medina et al., Reference Medina2006; Zhang et al., Reference Zhang2007; Shim et al., Reference Shim, Yoon, Shon, Ahn and Yang2008; Mielke et al., Reference Mielke2009). Additionally, we observed increased MD in subcortical regions such as the putamen and internal capsule.
Previous studies using automated voxel-wise analysis have found decreased FA in the internal capsule of MCI and AD patients (Medina et al., Reference Medina2006; Xie et al., Reference Xie2006). The present study found elevated MD in the internal capsule and right corona radiata in MCI. The internal capsule and corona radiata contain projection fibers travelling from the cortex to the brainstem and from the thalamus to the cortex. The detection of abnormalities in these fibers in MCI is surprising given that motor signs occur late in the case of AD. These regions are supplied by penetrating arteries and thus are susceptible to ischemic damage. Thus, the results may reflect the early changes of non-Alzheimer's dementia such as vascular dementia.
In our study, after controlling for vascular risk factors, the changes seen in the corona radiata on DTI were no longer significant. However, it is unclear whether this is due to a mediation effect or due to vascular risk factors causing changes and cognitive decline via independent mechanisms. In a previous study, MCI patients with signs of subcortical vascular disease have been found to have higher MD and lower FA in the centrum semiovale, which is the rostral continuation of the corona radiata (Shim et al., Reference Shim, Yoon, Shon, Ahn and Yang2008). This finding, together with our present findings, suggests that vascular pathology may contribute to the microstructural cerebral changes in MCI. Further studies are needed to determine the contribution of vascular disease and risk factors to changes in the basal ganglia and corona radiata seen using DTI.
MD in the genu of the corpus callosum, left superior frontal gyrus, and right corona radiata was the best combination of predictors for MCI in stepwise logistic regression analysis. However, this only accounted for 10% of the variance. This is understandable considering that the relationship between brain morphology and cognition is an imperfect one, and most measures of morphology do not predict cognitive function. Moreover, cognition is affected by multiple pathologies, not all of which are reflected in MD changes.
Although it has been suggested that MCI subtypes represent different etiologies, there are still limited data to support this assumption. Longitudinal studies suggest that although aMCI is more likely to progress to AD, naMCI also frequently progresses to AD (Busse et al., Reference Busse, Hensel, Guhne, Angermeyer and Riedel-Heller2006; Fischer et al., Reference Fischer2007). In the binary logistic regression analyses, MD in the left anterior cingulate gyrus, left superior frontal gyrus, genu of the corpus callosum, and right corona radiata emerged as significant independent predictors of aMCI. Previous studies of aMCI have also found decreased FA in the anterior cingulate and frontal white matter (Medina et al., Reference Medina2006; Mielke et al., Reference Mielke2009). Decreased FA in the corpus callosum has been seen in AD (Xie et al., Reference Xie2006). Our finding of abnormalities in the genu of the corpus callosum has been supported by a recent study that found atrophy in the anterior corpus callosum in aMCI (Di Paola et al., Reference Di Paola2010). Overall, these findings suggest that damage to anterior brain structures may be a significant feature of aMCI. While the present study and one previous study have found changes in the anterior cingulate in aMCI but not in the posterior cingulate on DTI (Mielke et al., Reference Mielke2009), other studies of aMCI have found changes in the posterior cingulate on DTI (Fellgiebel et al., Reference Fellgiebel2005; Zhang et al., Reference Zhang2007). This variation may be due to differences in the study population and method of DTI analysis. Future tractography studies may be able to determine the extent of changes more reliably in both the anterior and posterior cingulate.
In our study, the subtype analysis did not find major differences between the aMCI group and naMCI group. Comparison of the subtypes with control group did suggest that abnormalities in subcortical regions such as the putamen and internal capsule were more prominent in naMCI and changes in the anterior brain such as prefrontal cortex and anterior cingulate in aMCI. A logistic regression showed increased MD in the left anterior cingulate gyrus and reduced FA in the left frontal gyrus as distinguishing aMCI from naMCI. These differences must be interpreted cautiously, and may suggest that cortical changes, especially on the left side may be more characteristic of the aMCI syndrome, while naMCI, which is possibly a more heterogeneous entity, may have more subcortical abnormalities.
A major limitation of this study was the suboptimal acquisition strategy for the FA measure. This may explain why no significant FA differences were observed in this study. Due to scanner software limitations at the time of acquisition, only six-directional imaging with a single average was available. FA has been shown to vary significantly depending on the number of diffusion-weighted directions used; in contrast, MD has been found to be unaffected by the number of diffusion directions used (Giannelli et al., Reference Giannelli2009). The low number of diffusion directions used in this study is expected to have limited the accuracy of FA measurements, thus reducing the sensitivity of this study to FA changes. However, we were able to detect multiple areas with MD changes. The cross-sectional design of the study limits our ability to draw conclusions about the causal relationship between cerebral microstructural changes and MCI and its subtypes. The cohort will be followed longitudinally to evaluate whether the observed patterns of changes using DTI are predictive of cognitive decline and progression to different types of dementia.
In conclusion, our study shows changes on DTI in a large sample of participants with MCI. There were few differences between the amnestic and non-amnestic subtypes of MCI with FA of the left superior temporal gyrus and MD of the left anterior cingulate distinguishing aMCI from naMCI.
Conflict of interest
None.
Description of authors' roles
Senthil Thillainadesan analyzed the data and wrote the first draft; Wei Wen, Nicole Kochan, Simone Reppermund, Melissa Slavin, Julian Trollor, and Henry Brodaty assisted with designing the study, acquiring the data, and revising the paper; Lin Zhuang assisted with designing the study and analyzing the data; John Crawford assisted with the statistical analysis; Perminder Sachdev conceptualized and designed the study, obtained funding, and helped in interpreting the data and drafting the paper.
Acknowledgments
Many research and administrative assistants contributed to data gathering. Scans were reviewed clinically by Dr R. Shnier and his colleagues. Angie Russell assisted in paper preparation. We thank the participants for their enthusiastic support. Financial support for the collection of data used in this study was provided by the National Health and Medical Research Council of Australia Program Grant (ID 350833).