

INTRODUCTION
Astrocytes are glial cells that are thought to tile the central nervous system and to provide essential supportive functions for neurons (Fields, Reference Fields2004; Kofuji and Newman, Reference Kofuji and Newman2004; Magistretti, Reference Magistretti2006). There is also increasing evidence to suggest that astrocytes participate in synaptic function (Araque et al., Reference Araque, Parpura, Sanzgiri and Haydon1999) and regulate blood flow to meet demands set by neuronal activity (Gordon et al., Reference Gordon, Mulligan and MacVicar2007; Iadecola and Nedergaard, Reference Iadecola and Nedergaard2007).
Unlike neurons, astrocytes are not electrically excitable and do not fire or propagate action potentials (APs) along their processes (Smith, Reference Smith1992). However, astrocytes are thought to display excitability in the form of intracellular calcium concentration increases that have been postulated to have a responsive, instructive and/or regulatory role within neuronal networks (Smith, Reference Smith1992; Fields, Reference Fields2004). Indeed, astrocyte calcium elevations are known to occur in vivo (Hirase et al., Reference Hirase, Qian, Bartho and Buzsaki2004; Wang et al., Reference Wang, Lou, Xu, Tian, Peng and Han2006; Dombeck et al., Reference Dombeck, Khabbaz, Collman, Adelman and Tank2007; Göbel et al., Reference Göbel, Kampa and Helmchen2007; Bekar et al., Reference Bekar, He and Nedergaard2008; Schummers et al., Reference Schummers, Yu and Sur2008) and in astrocytes from human brain slices (Oberheim et al., Reference Oberheim, Takano, Han, He, Lin and Wang2009). It is also now well established that astrocyte calcium transients occur spontaneously and can be increased by neuronal AP firing and neurotransmitter release (Fiacco et al., Reference Fiacco, Agulhon and McCarthy2009). Since calcium is a ubiquitous second messenger (Clapham, Reference Clapham2007), the existence of astrocyte calcium excitability is increasingly considered a means to trigger their communication with other cells (e.g. glia, neurons and/or blood vessels). However, brain calcium-dependent astrocyte-to-neuron signalling is still debated with evidence for and against it (Parpura et al., Reference Parpura, Basarsky, Liu, Jeftinija, Jeftinija and Haydon1994; Pasti et al., Reference Pasti, Volterra, Pozzan and Carmignoto1997; Fellin et al., Reference Fellin, Pascual, Gobbo, Pozzan, Haydon and Carmignoto2004; Fiacco et al., Reference Fiacco, Agulhon, Taves, Petravicz, Casper and Dong2007; Lee et al., Reference Lee, Mannaioni, Yuan, Woo, Gingrich and Traynelis2007; Petravicz et al., Reference Petravicz, Fiacco and McCarthy2008; Gordon et al., Reference Gordon, Iremonger, Kantevari, Ellis-Davies, MacVicar and Bains2009; Agulhon et al., Reference Agulhon, Fiacco and McCarthy2010; Gourine et al., Reference Gourine, Kasymov, Marina, Tang, Figueiredo and Lane2010; Henneberger et al., Reference Henneberger, Papouin, Oliet and Rusakov2010). Moreover, past work has suggested that the relationship between astrocyte calcium transients and their ability to trigger exocytosis (Bowser and Khakh, Reference Bowser and Khakh2007) and to signal to neurons (Shigetomi et al., Reference Shigetomi, Bowser, Sofroniew and Khakh2008) is not binary and likely affected by the type, location and duration of calcium signals. Similarly, it has been shown that calcium signalling in astrocyte processes is not correlated with that measured in the soma (Nett et al., Reference Nett, Oloff and McCarthy2002; Shigetomi et al., Reference Shigetomi, Kracun, Sofroniew and Khakh2010) and another study has provided strong evidence for calcium signalling via astrocyte processes in the control of synaptic function (Gordon et al., Reference Gordon, Iremonger, Kantevari, Ellis-Davies, MacVicar and Bains2009). Thus there is an increasing awareness that astrocyte calcium signals may be diverse and more heterogeneous than hitherto recognised. These issues have been discussed extensively (Lee and Haydon, Reference Lee and Haydon2007; Tritsch and Bergles, Reference Tritsch and Bergles2007; Agulhon et al., Reference Agulhon, Petravicz, McMullen, Sweger, Minton and Taves2008; Barres, Reference Barres2008; Fiacco et al., Reference Fiacco, Agulhon and McCarthy2009; Halassa and Haydon, Reference Halassa and Haydon2010; Hamilton and Attwell, Reference Hamilton and Attwell2010), raising awareness of the need for improved methods to non-invasively monitor the diversity of astrocyte calcium signals.
The family of genetically encoded calcium indicator (GECI) proteins produce optical signals when they bind calcium (Kotlikoff, Reference Kotlikoff2007; Hires et al., Reference Hires, Tian and Looger2008). Extending the previous work with fluorescence resonance energy transfer (FRET)-based GECIs expressed in astrocytes (Atkin et al., Reference Atkin, Patel, Kocharyan, Holtzclaw, Weerth and Schram2009), and in order to measure calcium signals in astrocyte processes and near-membrane regions, we recently reported a refined genetic approach employing a membrane tethered GECI called Lck-GCaMP2 (Shigetomi et al., Reference Shigetomi, Kracun, Sofroniew and Khakh2010). This reporter combined a well-characterised EGFP-based calcium indicator (GCaMP2) (Nakai et al., Reference Nakai, Ohkura and Imoto2001; Lee et al., Reference Lee, Song, Nakai, Ohkura, Kotlikoff and Kinsey2006; Tallini et al., Reference Tallini, Ohkura, Choi, Ji, Imoto and Doran2006) with a strong membrane targeting dual acylation motif (Lck) from Lck protein tyrosine kinase (Zlatkine et al., Reference Zlatkine, Mehul and Magee1997; Benediktsson et al., Reference Benediktsson, Schachtele, Green and Dailey2005). Using conventional wide-field epifluorescence microscopy, the use of Lck-GCaMP2 allowed us to monitor astrocyte calcium signals in processes and thus identify frequent and highly localised near-membrane calcium microdomains that were completely missed with cytosolic calcium indicators such as GCaMP2 (Shigetomi et al., Reference Shigetomi, Kracun, Sofroniew and Khakh2010).
The random, seconds timescale, miniature, ‘spotty’ and transmembrane nature of astrocyte calcium microdomains makes these novel events more challenging to detect in relation to much larger and well-documented ‘global’ astrocyte calcium signals such as those triggered by G-protein-coupled receptor activation (Fiacco et al., Reference Fiacco, Agulhon and McCarthy2009), thus frustrating attempts to determine their molecular identity and physiological roles. In the present study, we explored ways to further improve Lck-GCaMP2 and thus its ability to monitor near-membrane astrocyte calcium microdomains. We achieved this by exploring recent advances with cytosolic GCaMP3 (Tian et al., Reference Tian, Hires, Mao, Huber, Chiappe and Chalasani2009; Seelig et al., Reference Seelig, Chiappe, Lott, Dutta, Osborne and Reiser2010) in conjunction with the demonstrated utility of the Lck domain tag (Benediktsson et al., Reference Benediktsson, Schachtele, Green and Dailey2005; Shigetomi et al., Reference Shigetomi, Kracun, Sofroniew and Khakh2010).
OBJECTIVE
The goal of this study was to determine whether Lck-GCaMP2 could be improved in its ability to monitor astrocyte calcium signals by the introduction of three-point mutations that were recently reported in cytosolic GCaMP2 to improve its ability to track APs in neurons (Tian et al., Reference Tian, Hires, Mao, Huber, Chiappe and Chalasani2009).
METHODS
Molecular biology
Lck-GCaMP2 was available from previous work and was generated from GCaMP2 as recently described (Shigetomi et al., Reference Shigetomi, Kracun, Sofroniew and Khakh2010). Lck-GCaMP3 was generated by three rounds of site-directed mutagenesis (Quick Change, Stratagene) of Lck-GCaMP2 to sequentially introduce the following single-site mutations: M153K, T203V (in EGFP) and N60D (in CaM) (Tian et al., Reference Tian, Hires, Mao, Huber, Chiappe and Chalasani2009). The following primers were used:
M153K: (+) CGAGAACGTCTATATCAAGGCCGACAAGCAGAAG,
(−) CTTCTGCTTGTCGGCCTTGATATAGACGTTCTCG;
T203V: (+) CAACCACTACCTGAGCGTCCAGTCCAAACTTTCG,
(−) CGAAAGTTTGGACTGGACGCTCAGGTAGTGGTTG;
N60D: (+) GTAGATGCCGACGGTGATGGCACAATCGACTTC,
(−) GAAGTCGATTGTGCCATCACCGTCGGCATCTAC
All intervening and final constructs were verified by DNA sequencing. Lck-GCaMP2 has been deposited at Addgene (www.addgene.org) for distribution; Lck-GCaMP3 will be similarly made available.
HEK-293 cell culture
HEK-293 cells (obtained from ATCC) were maintained in 75 cm2 cell culture flasks in DMEM/F12 media with Glutamax (Invitrogen) supplemented with 10% foetal bovine serum and penicillin/streptomycin. Cells were grown in a humidified atmosphere of 95% air/5% CO2 at 37°C in a cell culture incubator. The cells were split 1 in 10 when confluence reached 60–90%, which was generally every 3–4 days. Cells were prepared for transfection by plating onto six-well plates at the time of splitting 3–4 days before transfection. They were transfected at 60–90% confluence. For transient expression in HEK-293 we used 0.5–1 µg plasmid cDNA and the Effectene transfection reagent (Qiagen) for each well of a six-well plate. The manufacturer's instructions were followed with 4 µl of enhancer and 10 µl of Effectene used for each transfection. Buffered calcium solutions used for determining the calcium Kd of Lck-GCaMP2 were made in HEK cell buffer (in mM: 150 NaCl, 1 MgCl2, 10 d-glucose, 10 HEPES, 1 EGTA at pH7.5 (adjusted with NaOH)) with the aid of the MaxChelator Program (Bers et al., Reference Bers, Patton and Nuccitelli1994) to calculate the amount of CaCl2 added to achieve a particular final concentration. To achieve permeabilisation, cells were treated with 0.1% TritonX-100 (without calcium) for 15–30 s. The cells were then washed three times with zero calcium buffer and imaged as described below.
Epifluorescence microscopy
Briefly, we used an Olympus IX71 microscope equipped with an IXON DV887DCS EMCCD camera (Andor), epifluorescence condenser, control unit and Polychrome V monochromator (TILL Photonics). The control of excitation and image acquisition was achieved using TILLVision software. We used an Olympus 60X 1.45 NA objective lens. Images were typically taken every one second. Exposure time and pixel binning were optimised to visualise fluorescence signals for each experiment (maximum binning was 4 × 4). Cultures were perfused with recording buffer (110 mM NaCl, 5.4 mM KCl, 1.8 mM CaCl2, 0.8 mM MgCl2, 10 mM d-glucose, 10 mM HEPES at pH 7.4 (adjusted with NaOH)).
Hippocampal astrocyte–neuron cultures
Hippocampal cultures were prepared as described (Shigetomi and Khakh, Reference Shigetomi and Khakh2009). Briefly, two rat pups at P1–2 (Charles River) were used each week for hippocampal cultures for each dissection. For the experiments reported in this study, we used 105 coverslips from 42 rat pups over the course of one year's experiments. Hippocampi were dissected in Petri dishes filled with ice-cold medium. The dissected hippocampi (in medium, on ice) were cut and then digested with 20 U/ml papain for 11–13 min at 37°C (Worthington PAPAIN-022). After the incubation, the pieces were washed with pre-warmed media and triturated with flame-polished pipettes of progressively smaller bores; 120,000 cells (for 22 mm coverslips, VWR) or 20,000 cells (for 12 mm coverslips, VWR) were used for plating onto each coverslip. The coverslips were previously coated with poly-d-lysine (50 µg/ml; Sigma) and then overnight with 400 µl (for 22 mm coverslips) or 100 µl (for 12 mm coverslips) of 20 µg/ml laminin (Sigma) in sterile dissection medium. One hour after plating the cells were fed with 2 ml of pre-warmed culture medium.
Astrocyte transfection
Before transfection, half of the media was removed and the astrocytes fed with fresh media that had been pre-warmed to 37°C for more than 30 min. The removed media was supplemented with an equal volume of new media and stored in the cell culture incubator (this is the ‘fed and conditioned medium’). For EFS experiments, we used neurobasal-based media to keep neurons healthy. We transfected astrocytes at 4–6 days in culture with the Effectene transfection reagent (Qiagen) or Lipofectamine 2000 (Invitrogen). Experiments were carried out within 3 days of transfection.
Agonist applications and electrical field stimulation
Drugs were applied to single cells using a Warner Instrument VC–8 valve controller or to all cells on the glass coverslip in the bathing medium (at 2–3 ml/min). We used a microscope stage-mounted glass bottom chamber with built-in platinum electrodes (Warner Instruments) connected to a Grass S88 stimulator for field stimulation as previously described (Richler et al., Reference Richler, Chaumont, Shigetomi, Sagasti and Khakh2008). We used a pulse width of 100 µs and a stimulation frequency of 30 Hz (stimulus intensity was 85–90 V). For EFS experiments we used a static bath.
Data analysis
Image analysis was performed with ImageJ (NIH) and Clampfit 10.2 (Molecular Devices Inc.). Calcium signals above two standard deviations of the mean of a baseline region were collected for analysis. All statistical tests were run in GraphPad Instat 3.06 (GraphPad Software Inc.) and OriginPro 8 (OriginLab Corp.), which was also used for creating graphs. Statistical significance was declared at a P value of <0.05. The calcium concentration–effect curve for calcium dependency of fluorescence increases at Lck-GCaMP3 was analysed in Origin Pro 8 with the use of the Hill equation. The figures were assembled in CorelDraw 12. Data are shown as mean ± s.e.m. from n experiments as indicated in the text.
RESULTS
Lck-GCaMP3 and its relation to Lck-GCaMP2
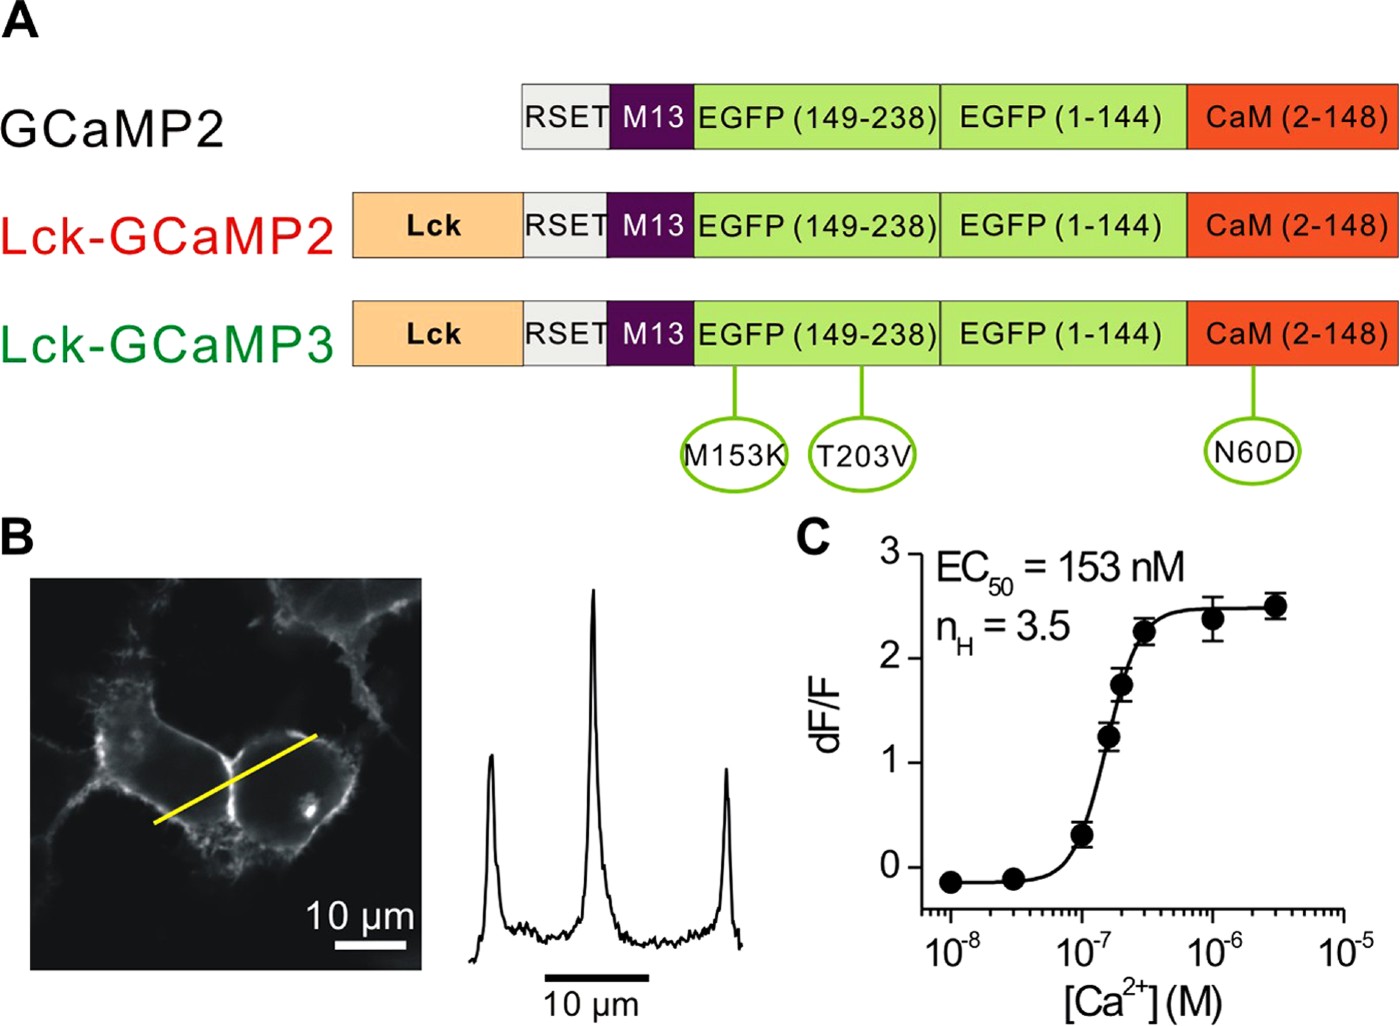
GCaMP is a genetically encoded circularly permuted GFP-based calcium sensor that increases its fluorescence yield when calcium ions bind (Nakai et al., Reference Nakai, Ohkura and Imoto2001; Kotlikoff, Reference Kotlikoff2007). Following its initial report, GCaMP was later optimised for stability at body temperature and greater signal-to-noise to generate GCaMP2 (Tallini et al., Reference Tallini, Ohkura, Choi, Ji, Imoto and Doran2006). In turn cytosolic GCaMP2 (Fig. 1A) has been the starting point for three recent studies aimed at improving its performance as a GECI for specific applications (Dreosti et al., Reference Dreosti, Odermatt, Dorostkar and Lagnado2009; Tian et al., Reference Tian, Hires, Mao, Huber, Chiappe and Chalasani2009; Shigetomi et al., Reference Shigetomi, Kracun, Sofroniew and Khakh2010). One study used GCaMP2 as a target for mutagenesis and by introducing four point mutations generated GCaMP3, which in relation to GCaMP2 displayed improvements in tracking neuronal APs (Tian et al., Reference Tian, Hires, Mao, Huber, Chiappe and Chalasani2009). One of these mutations deletes an N-terminal arginine at position 2 of GCaMP2, two mutations (M153K, T203V) map to the fluorophore EGFP domain and one mutation (N60D) was located in the C-terminal CaM domain (Tian et al., Reference Tian, Hires, Mao, Huber, Chiappe and Chalasani2009). A second study fused GCaMP2 to synaptophysin to generate SyGCaMP2, which was tethered to neuronal synaptic vesicles and exploited to monitor activity across groups of synapses (Dreosti et al., Reference Dreosti, Odermatt, Dorostkar and Lagnado2009). In our recent study, we fused the 26 residue Lck domain to the N-terminus of cytosolic GCaMP2 to generate membrane targeted Lck-GCaMP2, which we characterised in HEK-293 cells and exploited to monitor near-membrane calcium dynamics in astrocyte somata and processes (Shigetomi et al., Reference Shigetomi, Kracun, Sofroniew and Khakh2010).
We sought to capitalise on advances with GCaMP3 to determine if Lck-GCaMP2 could be improved as a membrane tethered probe to monitor microdomain astrocyte calcium signals (Shigetomi et al., Reference Shigetomi, Kracun, Sofroniew and Khakh2010). Of the four mutations used to generate GCaMP3 from GCaMP2, we introduced three into Lck-GCaMP2 (M153K and T203V in EGFP and N60D in CaM; Fig. 1A). We did not remove the N-terminal arginine at position 2 of GCaMP2 because in the context of the Lck domain this residue is no longer N-terminal, and therefore unlikely to lead to protein destabilisation (Tian et al., Reference Tian, Hires, Mao, Huber, Chiappe and Chalasani2009). In accord with past nomenclature, we called our modified GECI Lck-GCaMP3 (Fig. 1A). However, we emphasise that the GCaMP moiety in Lck-GCaMP3 differs from cytosolic GCaMP3 by one arginine residue after the initiating methionine in the RSET domain (Tian et al., Reference Tian, Hires, Mao, Huber, Chiappe and Chalasani2009).
For initial evaluation we expressed Lck-GCaMP3 in HEK-293 cells, which we imaged with confocal microscopy (Fig. 1B). We found that Lck-GCaMP3 was robustly expressed at the edges of HEK-293 cells, with line profiles showing that the intensity of fluorescence at the junction of two cells was twice that expected from the edge of single HEK-293 cells (Fig. 1B; n = 9). Using permeabilised HEK-293 cells, we also found that Lck-GCaMP3 functioned as a calcium sensor with an apparent calcium EC50 of 153 nM and a cooperativity of ~4 (Fig. 1C; n = 11–30 for each point). Both these values are close to previous estimates by us and others for Lck-GCaMP2 and GCaMP2, respectively (Tallini et al., Reference Tallini, Ohkura, Choi, Ji, Imoto and Doran2006; Shigetomi et al., Reference Shigetomi, Kracun, Sofroniew and Khakh2010). Thus, Lck-GCaMP3 displayed somewhat higher apparent calcium sensitivity than that reported for cytosolic GCaMP3 (Tian et al., Reference Tian, Hires, Mao, Huber, Chiappe and Chalasani2009).
Design and characterisation of Lck-GCAMP3. (A) Schematic representation of cytosolic GCaMP2, Lck-GCaMP2 and Lck-GCaMP3. Lck-GCaMP3 was made by introduction of three point mutations into Lck-GCaMP2 as indicated by green circles. The numbering system used here for the mutations is not based on the location of the residue in the linear sequence, but based on the position of the mutation in each of the modular components of GCaMP2 (Tian et al., Reference Tian, Hires, Mao, Huber, Chiappe and Chalasani2009). The sizes of the domains within the Lck-GCaMP constructs are not shown on a linear scale of amino acid length. (B) Representative image and line profile of two HEK-293 cells expressing Lck-GCaMP3 (representative of nine fields of view). Note the fluorescence is strongly located at the edges of the cells near the membrane. (C) Calcium sensitivity of Lck-GCaMP3 using permeabilised HEK-293 cells (n = 11–30 cells, 15 coverslips). The error bars represent s.e.m. The apparent affinity (K d) and Hill coefficient (nH) of Ca2+ at Lck-GCaMP3 is similar to that of Lck-GCaMP2 (see the text).

Global astrocyte calcium signals measured with Lck-GCaMP3
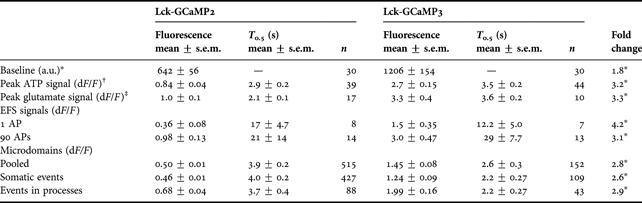
We expressed Lck-GCaMP3 in cultured astrocytes and compared it with Lck-GCaMP2 (Fig. 2). Consistent with the previous work with Lck-GCaMP2, both GECIs were robustly and equally uniformly expressed in astrocytes (Fig. 2A) with no obvious expression in spots, intracellular vesicles or high-density clusters (Shigetomi et al., Reference Shigetomi, Kracun, Sofroniew and Khakh2010). As expected, the two-dimensional areas of astrocytes revealed by analysis of epifluorescence images, such as those shown in Fig. 2A, were no different between cells expressing Lck-GCaMP2 and Lck-GCaMP3 at 7510 ± 1910 µm2 (n = 8) and 5240 ± 688 µm2 (n = 25), respectively, implying that astrocyte shapes and sizes were normal (Shigetomi et al., Reference Shigetomi, Kracun, Sofroniew and Khakh2010). However, the images of astrocytes expressing Lck-GCaMP3 were significantly two-fold brighter than those expressing Lck-GCaMP2 as assessed by examining the distribution of per pixel intensities of fluorescence across astrocytes (P = 0.024; Fig. 2A; Table 1). We interpret this to indicate that the basal fluorescence of Lck-GCaMP3 is higher than that of Lck-GCaMP2 (Table 1), likely because arginine at position 2 is distanced from the N-terminus (Tian et al., Reference Tian, Hires, Mao, Huber, Chiappe and Chalasani2009).
Comparison between Lck-GCaMP3 and Lck-GCaMP2 in basal fluorescence and ATP-evoked calcium signals in astrocytes. (A) Representative images of Lck-GCaMP2 (n = 30 cells, five coverslips) and Lck-GCaMP3 expressing astrocytes (n = 30 cells, six coverslips). Lck-GCaMP3 was brighter than Lck-GCaMP2. The histogram shows fluorescence intensity of astrocytes expressing Lck-GCaMP2 and 3 (see Table 1 for average data). (B) Representative images of astrocytes expressing Lck-GCaMP2 and 3 before (control) and during ATP (30 µM) applications. Note Lck-GCaMP3 shows brighter fluorescence than Lck-GCaMP2 before and during application of ATP. (C) The traces show the intensity versus time profile of Lck-GCaMP2 (n = 10–12 cells, four coverslips) and Lck-GCaMP3 (n = 10–11 cells, 3–4 coverslips) expressing astrocytes before, during and after exposure to ATP and glutamate.

Summary of data gathered with Lck-GCaMP2 and Lck-GCaMP3 in astrocytes.

— Means that this parameter could not be measured. a.u. means arbitary units of fluorescence on a 12 bit scale.
*Indicates significant differences between Lck-GCaMP3 and Lck-GCaMP2 in terms of fluorescence signal (P < 0.05). Background fluorescence was subtracted from these values to give the Lck-GCaMP2 and Lck-GCaMP3 signals alone on a 12-bit scale.
†Response evoked by 30 µM ATP.
‡Response evoked by 300 µM glutamate.
We next determined how Lck-GCaMP3 compared to Lck-GCaMP2 in monitoring well-characterised global intracellular calcium elevations that have previously been measured with cytosolic calcium indicator dyes (Fiacco et al., Reference Fiacco, Agulhon and McCarthy2009). We thus employed GPCR activation by using 30 µM ATP as a P2Y1 agonist and 300 µM glutamate as an agonist of metabotropic glutamate receptors in astrocytes (Fields and Burnstock, Reference Fields and Burnstock2006; Fiacco et al., Reference Fiacco, Agulhon and McCarthy2009; Shigetomi et al., Reference Shigetomi, Kracun, Sofroniew and Khakh2010) (Fig. 2B). We plotted Lck-GCaMP2 and Lck-GCaMP3 fluorescence intensity for entire astrocytes over time before, during and after ATP and glutamate applications and measured the peak dF/F (Fig. 2C,D). The ATP and glutamate-evoked calcium transients measured with Lck-GCaMP2 and Lck-GCaMP3 were qualitatively similar in terms of rise-time, shape and decay, but differed significantly between these GECIs in terms of peak dF/F (Fig. 2; Table 1). Blockade of neuronal AP firing by TTX (1 µM) did not significantly change the responses measured in astrocytes to applications of ATP or glutamate as the peak response amplitudes were 105 ± 4% (n = 8 cells) and 93 ± 5% (n = 12 cells) of those measured in the absence of TTX. This is consistent with previous work showing that both ATP and glutamate activate receptors on astrocytes (Shigetomi et al., Reference Shigetomi, Kracun, Sofroniew and Khakh2010). Thus ATP- and glutamate-evoked responses measured with Lck-GCaMP3 were three-fold larger than those measured with Lck-GCaMP2, implying that Lck-GCaMP3 displays a more favourable signal-to-noise ratio (Table 1).
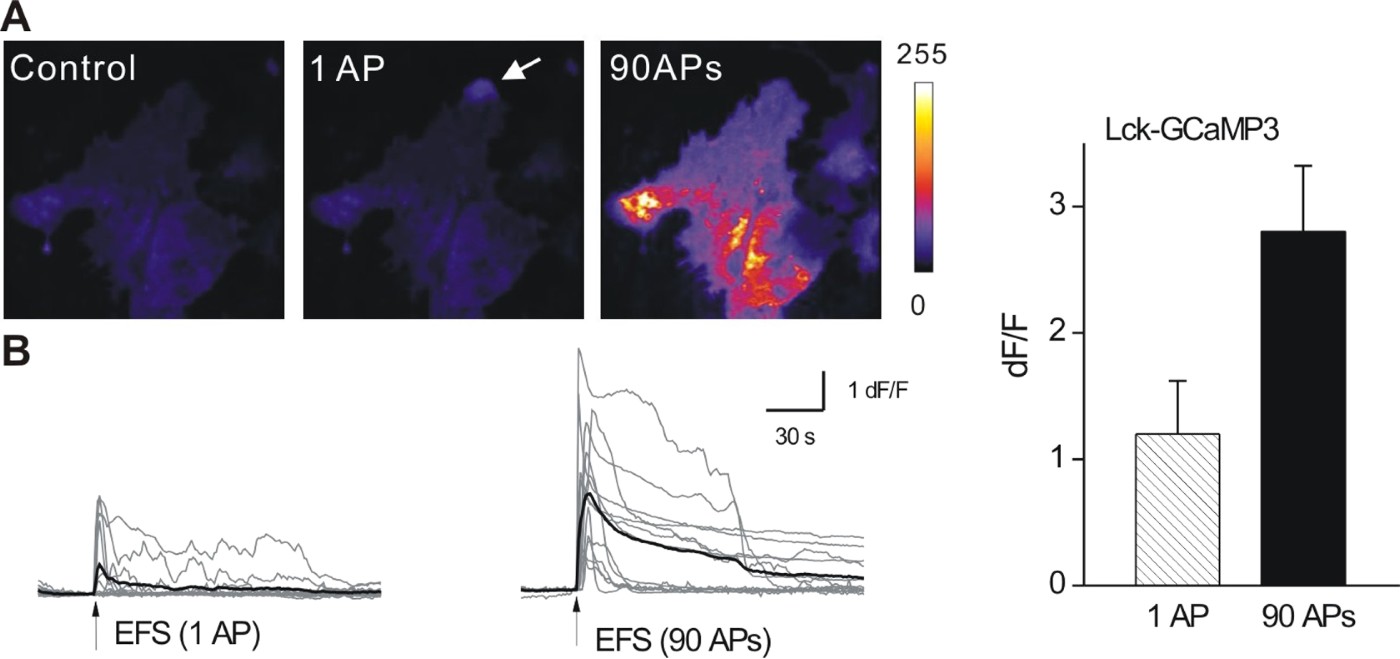
Using described conditions we employed hippocampal neuron and astrocyte co-cultures and determined if Lck-GCaMP3 could monitor the signalling mediated by the release of neurotransmitters from neurons onto astrocytes (Richler et al., Reference Richler, Chaumont, Shigetomi, Sagasti and Khakh2008; Shigetomi et al., Reference Shigetomi, Kracun, Sofroniew and Khakh2010). Based on the past work, we used electrical field stimulation (EFS) to evoke ATP release from hippocampal neurons in culture and measured astrocyte responses when 1 and 90 APs were evoked at 30 Hz in 3 s (Fig. 3). The peak dF/F was higher for 30 APs versus 1 AP, but was also consistently greater for Lck-GCaMP3 as opposed to Lck-GCaMP2 in both conditions (Fig. 3; Table 1). Taken together, these experiments show that Lck-GCaMP3 displays higher basal fluorescence than Lck-GCaMP2 and displays larger signals for global elevations in calcium as a result of GPCR activation and AP-mediated neurotransmitter release onto astrocytes.
Responses of astrocytes expressing Lck-GCaMP3 during EFS (EFS) of neurons. (A) Representative images of an astrocyte expressing Lck-GCaMP3 before and during EFS. (B) Traces from 13 astrocytes from four coverslips (grey) along with their averages superimposed (black) showing the Lck-GCaMP3 response during EFS. Bar graph summarises average data (see Table 1).

Lck-GCaMP3 monitors localised spotty calcium signals in astrocytes
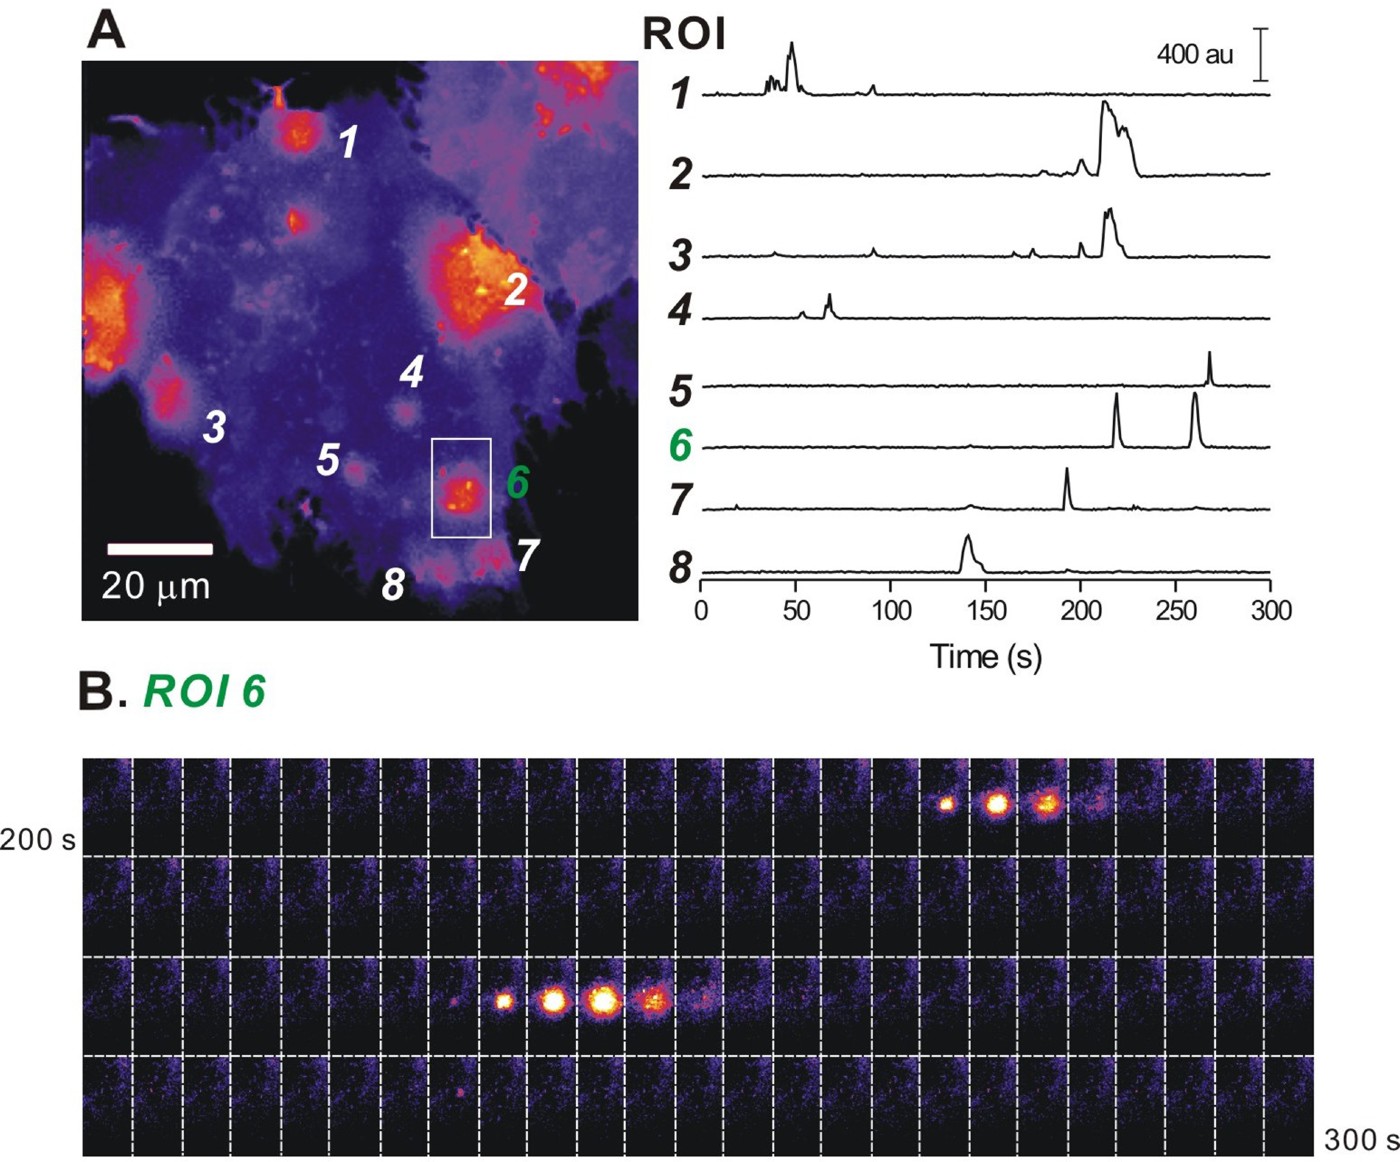
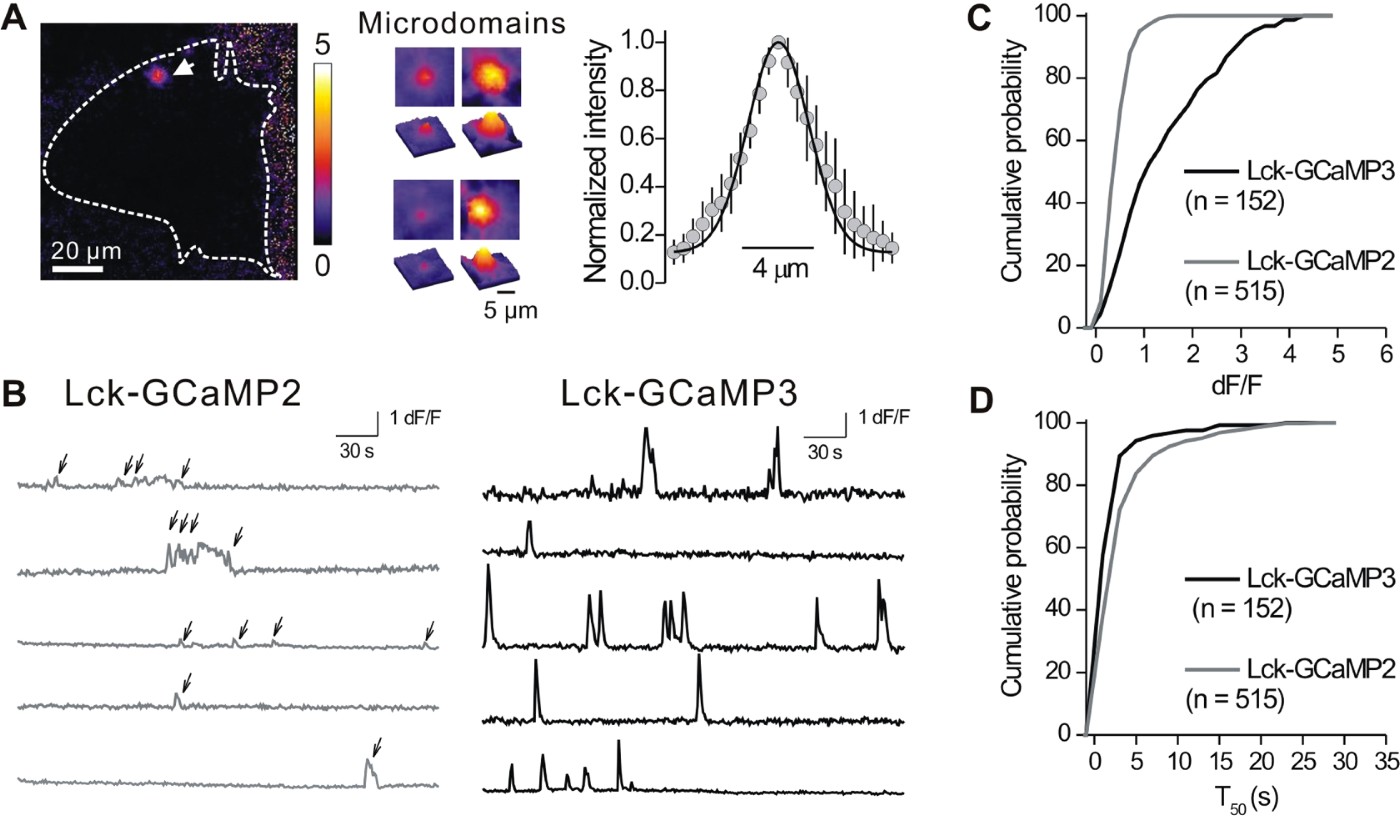
Using Lck-GCaMP2 in conjunction with EPI microscopy, we recently reported and characterised the properties of spontaneous near-membrane astrocyte calcium microdomains (Shigetomi et al., Reference Shigetomi, Kracun, Sofroniew and Khakh2010). For several reasons, these events are interesting, but challenging to detect. First, microdomain calcium signals were not detected with cytosolic GCaMP2 using epifluorescence microscopy, most likely because they represent calcium fluxes near the plane of the membrane (Shigetomi et al., Reference Shigetomi, Kracun, Sofroniew and Khakh2010). Also, the microdomains were localised (width of ~5 µm) and brief (~1.5 s duration) in relation to global signals that typically encompass the entire cell and last up to tens of seconds (Fiacco et al., Reference Fiacco, Agulhon and McCarthy2009). Given these features of microdomains, we were interested to determine if Lck-GCaMP3 could report microdomain calcium signals and if this GECI improved the signal-to-noise ratio for these unitary-like events. Using Lck-GCaMP3, we easily observed numerous, brief and spotty calcium signals in astrocytes (see supplementary movie 1 online and Fig. 4). The microdomains displayed full-width half-maximum of 4.8 ± 0.6 µm (n = 7; Fig. 5A), significantly greater than the point-spread-function of our microscope at ~0.4 µm (Shigetomi et al., Reference Shigetomi, Kracun, Sofroniew and Khakh2010). Fig. 4A shows representative traces for microdomains measured with Lck-GCaMP3 and Fig. 5B compares recordings for Lck-GCaMP2 and Lck-GCaMP3: the improvement with Lck-GCaMP3 was readily apparent from the raw data and from the traces of analysed microdomains (Fig. 5B). The cumulative probability plots in Fig. 5C and the average data in Table 1 showing the peak dF/F values for microdomains measured with Lck-GCaMP2 (n = 515) and Lck-GCaMP3 (n = 152) show that the signal-to-noise was significantly improved with Lck-GCaMP3 (P < 0.001 when the two distributions were compared with the Kolmogorov–Smirnoff statistic or with an unpaired Student's t-test; Table 1). The kinetics of microdomains measured with Lck-GCaMP2 and Lck-GCaMP3 were not significantly different (P = 0.781; Fig. 5D; Table 1). Moreover, a larger proportion of cells exhibited spotty calcium signals with Lck-GCaMP3 (43%) than with Lck-GCaMP2 (21%), suggesting that the improved signal-to-noise ratio (Fig. 5B,C) resulted in a two-fold improvement in detection ability. Consistent with this, Lck-GCaMP3 reported more microdomain signals per cell (2.1 ± 0.4 events per cell; n = 19) than Lck-GCaMP2 (1.3 ± 0.3 events per cell; n = 8), although this did not reach statistical significance. As in our past study, microdomains (76%) were observed in astrocyte cell bodies and in processes (24%) that extended >20 µm from the astrocyte soma (Shigetomi et al., Reference Shigetomi, Kracun, Sofroniew and Khakh2010). These latter microdomains occurred independently of the transients measured in astrocyte cell bodies, were ~60% larger in amplitude but displayed no other substantial differences in their basic properties (Table 1). Overall, these data suggest that Lck-GCaMP3 is better suited to detect and quantify astrocyte calcium microdomains as compared to Lck-GCaMP2, and does not detectably alter their kinetics (Fig. 4).
Microdomain signals measured with Lck-GCaMP3 in astrocytes. (A) A maximum projection image of a 300-frame movie acquired at 1 Hz (see supplementary movie 1 online). Six regions of interest are shown (as 1–6). The intensity profiles of these six ROIs are shown in the graph on the right. (B) Still frames between 200 and 300 s of the graph in panel A for ROI 6. The microdomain calcium signals can easily be seen by eye. The time between images is 1 s.

Comparing Lck-GCaMP3 and Lck-GCaMP2 in their ability to monitor microdomain calcium signals in astrocytes. (A) A dF/F image of spontaneous calcium signals in an astrocyte with Lck-GCaMP3. Dashed line shows the outline of the imaged astrocyte and white arrow points to a microdomain. Note that the high signal-to-noise ratio makes visual detection of microdomains possible. Images in the middle are four more examples of spontaneous calcium signals (F images). Right graph shows the full-width of half-maxima of the events (n = 7 sites). (B) Intensity versus time profile of 5 ROIs of Lck-GCaMP2 (grey) and Lck-GCaMP3 (black). Note that signal-to-noise ratio is improved in Lck-GCaMP3. (C) Cumulative probability plots of calcium microdomain peak dF/F values measured using Lck-GCaMP2 and Lck-GCaMP3. (D) As in C, but for microdomain T 0.5 values (see Table 1 for averages and the text for statistics).

CONCLUSIONS
• Lck-GCaMP3 displays two-fold higher basal fluorescence than Lck-GCaMP2.
• Lck-GCaMP3 displays a 3–4-fold greater signal-to-noise ratio than Lck-GCaMP2 for a variety of astrocyte calcium signals.
• Lck-GCaMP3 significantly improves on Lck-GCaMP2 in its ability to detect and accurately monitor microdomain calcium signals in astrocytes.
DISCUSSION
The main finding of the present study is that Lck-GCaMP3, a refined genetically targeted calcium sensor that is tethered to the plasma membrane, can be used to monitor several distinct types of astrocyte calcium signals and is particularly useful for monitoring astrocyte spotty microdomains that are due to transmembrane calcium fluxes.
The introduction of three point mutations into Lck-GCaMP2 to generate Lck-GCaMP3 significantly improved basal fluorescence (~2-fold increase) and dynamic range (~3–4-fold increase) of the GECI without altering membrane targeting or overtly altering calcium sensitivity (Fig. 1). We do not know why the apparent calcium sensitivity of Lck-GCaMP3 (153 nM) is higher than the previously reported value for cytosolic GCaMP3 (660 nM) (Tian et al., Reference Tian, Hires, Mao, Huber, Chiappe and Chalasani2009), but one possibility is experimental differences between measuring calcium dependency in permeabilised cells (as reported here) compared to measurements on purified GCaMP3 proteins in detergent (Tian et al., Reference Tian, Hires, Mao, Huber, Chiappe and Chalasani2009). These issues have been previously discussed (Hires et al., Reference Hires, Tian and Looger2008). Our value for apparent calcium sensitivity of 153 nM for Lck-GCaMP3 is consistent with the past work with GCaMP2 by us (168 nM) and others (146 nM) (Tallini et al., Reference Tallini, Ohkura, Choi, Ji, Imoto and Doran2006; Shigetomi et al., Reference Shigetomi, Kracun, Sofroniew and Khakh2010). Irrespectively, the calcium sensitivities in the hundreds of nanomolar range of Lck-GCaMP3 and GCaMP3 are both suitable to detect physiological calcium increases in astrocyte somata and in small volumes such as their fine processes. Although currently available GECIs suffer from suboptimal response kinetics (Hires et al., Reference Hires, Tian and Looger2008), this is less of a problem for their use to study astrocytes which do not display millisecond time scale transients but display calcium signals that last seconds (Fiacco et al., Reference Fiacco, Agulhon and McCarthy2009). Overall, the improvements between Lck-GCaMP2 and Lck-GCaMP3 reported here (Table 1) are consistent with those reported for cytosolic GCaMP3 over GCaMP2 by the Looger laboratory (Tian et al., Reference Tian, Hires, Mao, Huber, Chiappe and Chalasani2009), adding further credence to the view that the Lck domain is functionally innocuous as a strong membrane tether for GECIs (Shigetomi et al., Reference Shigetomi, Kracun, Sofroniew and Khakh2010).
Our experiments indicate that Lck-GCaMP3 provides more precise readouts of astrocyte calcium microdomains than Lck-GCaMP2. First, the dF/F of Lck-GCaMP3 microdomain signals were three times larger than those measured with Lck-GCaMP2. Second, the proportion of cells showing microdomain signals with Lck-GCaMP3 was twice as high as those imaged with Lck-GCaMP2. Third, there was a trend for more microdomain signals per cell with Lck-GCaMP3. In the simplest interpretation, these results suggest that the use of Lck-GCaMP2 misses some calcium microdomain events and that Lck-GCaMP3 provide better means to detect microdomain calcium signals in astrocytes in terms of dynamic range and the number of events.
The present findings with Lck-GCaMP3 complement and extend recent studies with Lck-GCaMP2 (Shigetomi et al., Reference Shigetomi, Kracun, Sofroniew and Khakh2010) and a cytosolic FRET-based GECI expressed in astrocytes (Atkin et al., Reference Atkin, Patel, Kocharyan, Holtzclaw, Weerth and Schram2009). Our past work showed that Lck-GCaMP2 was ~14 times better than cytosolic GCaMP2 at reporting astrocyte calcium microdomains, whereas the present experiments show that Lck-GCaMP3 is a further ~3 times better than Lck-GCaMP2. From the perspective of astrocyte calcium signals, both cytosolic GECIs and Lck-GCaMP2 are adequate and provide a readily measurable dynamic range to detect global signals evoked pharmacologically or by AP firing in neurons. However, we suggest that Lck-GCaMP3 is the GECI of choice (of the GECIs available to date) to measure random, seconds time scale, miniature, spotty and transmembrane microdomain calcium signals in astrocytes, especially in fine processes. This feature can now be exploited to explore the molecular identities and physiological significance of astrocyte calcium microdomains in vivo via viral transduction and mouse genetics. The combination of in vivo expression of Lck-GCaMP3 with two-photon microscopy should provide a more precise view and better understanding of calcium signals in astrocyte processes that emanate from the soma and also in fine processes near synapses and in astrocyte end-feet near blood vessels. Thus, by allowing calcium signals to be measured in astrocytes processes the use of Lck-GCaMP3 should reveal the details and physiological roles of glia–neuron and glia–vascular interactions.
Fluorescent proteins and GECIs are continually being improved by redesign and/or mutagenesis. It is likely that in the near future newer generations of GECIs will become available. The high-resolution structures of GCaMP2 (Rodríguez Guilbe et al., Reference Rodríguez Guilbe, Alfaro Malavé, Akerboom, Marvin, Looger and Schreiter2008; Wang et al., Reference Wang, Shui, Kotlikoff and Sondermann2008; Akerboom et al., Reference Akerboom, Rivera, Guilbe, Malavé, Hernandez and Tian2009) make it a particularly useful candidate for designer engineering, as illustrated by recent advances employing distinct membrane targeting strategies and structure-driven optimisation (Lee et al., Reference Lee, Song, Nakai, Ohkura, Kotlikoff and Kinsey2006; Dreosti et al., Reference Dreosti, Odermatt, Dorostkar and Lagnado2009; Tian et al., Reference Tian, Hires, Mao, Huber, Chiappe and Chalasani2009; Seelig et al., Reference Seelig, Chiappe, Lott, Dutta, Osborne and Reiser2010; Shigetomi et al., Reference Shigetomi, Kracun, Sofroniew and Khakh2010; Willoughby et al., Reference Willoughby, Wachten, Masada and Cooper2010). From this perspective, the average dF/F (~150%; Table 1) for a calcium microdomain in astrocytes measured with Lck-GCaMP3 is intermediate between the dF/F values measured with GCaMP3 in response to the firing of one and two APs in hippocampal pyramidal neurons at ~40 and ~185%, respectively (Tian et al., Reference Tian, Hires, Mao, Huber, Chiappe and Chalasani2009). Thus, astrocytes may offer a useful cell type with which to screen GCaMP3 mutant libraries in a high throughput format because cultured astrocytes present a relatively flat uniform surface for optical microscopy and have non-overlapping territories (Halassa et al., Reference Halassa, Fellin, Takano, Dong and Haydon2007), allowing unambiguous assignment of optical signals to single cells. Additionally, astrocytes can be easily maintained in cell culture (Shigetomi and Khakh, Reference Shigetomi and Khakh2009), undergo cell division, are easily transfected and readily targeted with cell-specific promoters such as GFAP and S100β (Brenner et al., Reference Brenner, Kisseberth, Su, Besnard and Messing1994; Atkin et al., Reference Atkin, Patel, Kocharyan, Holtzclaw, Weerth and Schram2009). Finally, the data presented here and in past work (Shigetomi et al., Reference Shigetomi, Kracun, Sofroniew and Khakh2010) show that astrocytes have spontaneous spotty calcium microdomains that do not require chemical or electrical intervention to actuate, thus minimising experimental intervention during screening. The combination of these properties may be useful in designing primary screening assays for rapidly testing mutant libraries of GECIs.
ACKNOWLEDGEMENTS
Thanks to Dr. MV Sofroniew and members of Astrocyte Biology and Biophysics Affinity Group at UCLA for discussions. Thanks to Dr. Loren Looger (Janelia Farm Research Campus) for a preprint of their work on GCaMP3. Our work was supported by the National Institutes of Health (NS071292, NS063186, NS060677) the Whitehall Foundation and a Stein-Oppenheimer Endowment Award (to B.S.K.).
Statement of interest
The authors have no conflicts of interest in relation to this work.
Supplementary material
The supplementary material referred to in this article can be found online at journals.cambridge.org/ngb.