1 Introduction
Approximately 5.25 million state and local workers in the U.S. do not pay Social Security taxes on the earnings from their government job (U.S. GAO, 2007).Footnote 1 Many of these public employees still qualify for Social Security benefits, either as a result of switching between covered and uncovered employment at some point in their career or because they simultaneously work in two or more jobs that span both covered and uncovered employment. For example, a teacher in the State of Illinois (one of the states whose public workers are not covered under Social Security) may spend his summers working in covered employment. Alternatively, a professor may spend part of her career working at a private university covered by Social Security, and part of her career working for a state university that is not covered.
If Social Security benefits were calculated as a simple linear function of lifetime earnings, it would be possible to calculate the retirement benefit for a worker with partial coverage by simply applying the standard benefit formula only to those earnings covered by Social Security. However, the Social Security benefit formula was explicitly designed to be nonlinear in order to offer a higher replacement rate (i.e., a higher ratio of Social Security benefits to average indexed monthly earnings over one's lifetime) for individuals with lower earnings. For workers with earnings that are not covered by the Social Security system, using only covered earnings in the standard benefit formula would result in a higher replacement rate on these covered earnings than they would receive if all of their earnings were covered. In order to adjust for this, the Windfall Elimination Provision (WEP) was enacted as part of the 1983 Social Security Amendments. This provision is meant to downward-adjust the Social Security benefits of affected workers in order to eliminate the ‘windfall’ that arises when, for example, an individual with high lifetime earnings (based on both covered and uncovered earnings) would appear as if he or she were a low earner when evaluated solely based on covered earnings. As stated by Social Security Administration (SSA), an individual is subject to the WEP if ‘you earned a pension in any job where you did not pay Social Security taxes and you also worked in other jobs long enough to qualify for a Social Security retirement or disability benefit’ (Social Security Administration, 2013). As of December 2012, about 1.5 million Social Security beneficiaries (3.3% of all individuals in receipt of Social Security benefit payments) were affected by the WEP (Scott, Reference Scott2013).
As the WEP is extremely unpopular among those affected by it, bills to eliminate or alter it are regularly proposed in Congress.Footnote 2 One reason for the intense opposition to the WEP is that it is generally viewed as a benefit cut rather than as a method of trying to provide a similar return on contributions for individuals with similar total lifetime earnings. Another reason for the opposition is that it is perceived as being particularly unfair to lower income individuals. The primary contribution of this paper is to investigate the distributional implications of the WEP in comparison with several alternative methods of calculating this adjustment.
We find it because the WEP changes the marginal Social Security benefit only on the first $711 (in 2008Footnote 3) of average indexed monthly earnings, the WEP reduces benefits by a larger percentage for individuals with lower covered earnings. As the WEP provision is phased out for individuals with 20–30 years of sufficient covered earnings (to be explained in more detail below), the WEP provision can also, in some cases, lead to large changes in Social Security replacement rates based on small changes in covered earnings. We show that there is an alternative way of calculating a WEP that comes closer to preserving the intended distributional effects of the Social Security system, but this approach is not administratively feasible due to historical limitations on SSA's record-keeping of non-covered earnings. We then analyze two alternative ways of calculating a WEP that use the information currently available to SSA, are budget neutral, and come closer to approximating the individual-level redistributive effects of the broader system.
In Section 2, we describe in more detail why an adjustment for uncovered earnings is appropriate. In Section 3, we discuss the details of the current WEP calculation. In Section 4, we discuss the individual-level distributional implications of the current WEP. In Section 5, we present two alternative methods for calculating the WEP that are administratively feasible and that come closer to preserving the intended (individual level) income progressivity inherent in the Social Security system. Section 6 draws conclusions and provides further commentary on the WEP, including a brief discussion of how the framing of the existing WEP adjustment likely exacerbates the political unpopularity of this provision.
2 Why is a benefit adjustment necessary for government employees?
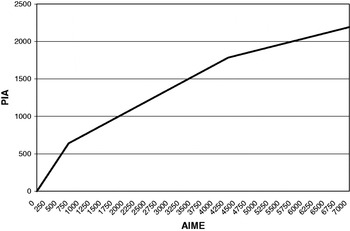
A brief review of how Social Security benefits are calculated provides a useful background for understanding the need for a benefit adjustment for workers with both covered and uncovered earnings. Let us begin with an individual born in 1946, who will turn 62 years in the year 2008, and whose earnings are 100% covered. This individual's earnings in each year are first indexed to the average wage index to bring nominal earnings up to near-current wage levels.Footnote 4 Social Security then averages the highest 35 years of indexed earnings and divides by 12 to compute the Average Indexed Monthly Earnings (AIME). The next step is to compute the Primary Insurance Amount (PIA), which is the basis for all benefit calculations. For the 1946 birth cohort, this PIA formula credits 90% of the first $711 of AIME, 32% of the next $3,577 of AIME, and 15% of any AIME above this amount, as indicated in Equation (1).
 $$\eqalign{{\rm PIA}_{{\rm No}\,\,{\rm WEP}} = 0.9\min ({\rm AIME}\comma 711) + 0.32\max (0\comma \min ({\rm AIME}\comma 4288) - 711) \cr + 0.15\max (0\comma {\rm AIME} - 4288) . \cr} $$
The simple graph of this benefit formula can be seen in Figure 1. If an individual retires at his or her normal retirement age (NRA), which is 66 years for the 1946 birth cohort, the individual's monthly benefit would be equal to the PIA as calculated above. For individuals retiring earlier (or later than this age), the benefit is decreased (or increased) by an actuarial adjustment that is meant to be roughly actuarially fair for the population as a whole.Footnote 5 This nonlinear benefit formula is meant to be redistributive, in that the PIA/AIME ratio is flat or falling as AIME rises.Footnote 6 In other words, individuals with lower average lifetime earnings tend to get a higher fraction of their average earnings replaced by Social Security each month in retirement than do individuals with higher average lifetime earnings.
Now, consider an individual who has high lifetime earnings, but for whom most of those earnings were from a state or local employer that is not covered by Social Security. This means that when one looks only at the earnings of the individual that are covered by Social Security, the individual appears as if they are a low-earner when in fact they are a high-earner. Applying the benefit formula in Equation (1) only to covered earnings would place this person on the high replacement rate portion of the benefit formula, in essence giving this individual too large of a benefit relative to their total (covered plus uncovered) lifetime earnings.
The Social Security benefit formula (1946 birth cohort).

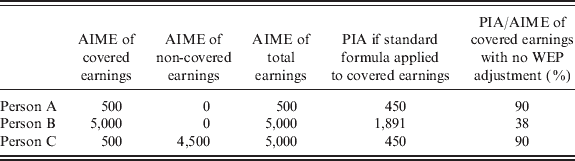
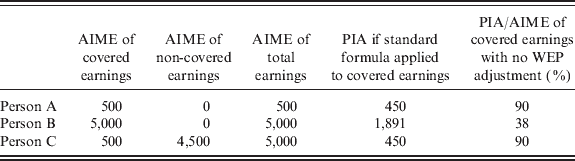
It is easy to see the problem that would be created if there were no WEP provision in place through an example. Consider the three individuals shown in Table 1. Person A is a very low income worker who works her entire life under Social Security, with an AIME of only $500 per month. Using the 2008 PIA formula (applicable to the 1946 birth cohort, as it appears in Equation (1) above), person A would have a PIA of $450, or a replacement rate of 90%. Person B is a higher income worker with all of her earnings covered under Social Security, thus having an AIME of $5,000. Applying Equation (1) indicates that Person B would have a PIA of $1891.34, or a replacement rate at the NRA of 38%. Thus far, this example simply illustrates the nonlinearity of the benefit formula, as person A receives a higher replacement rate than does person B, owing to the fact that person A has lower lifetime earnings.
Social Security primary insurance amount if no WEP adjustment applied
Source: Authors' calculations using 2008 Social Security benefit formula parameters.
Now consider person C, a public employee. Person C's total lifetime earnings (which on an indexed average monthly basis is $5,000) are identical to B's. Had all of person C's earnings been covered by Social Security, person C would have the same 38% replacement rate as B. However, only 1/10th of person C's earnings were in employment covered by Social Security – the rest were in non-covered public employment. If Social Security applied the standard benefit formula to person C's covered earnings without any WEP adjustment, person C would receive a monthly benefit of $450, equivalent to person A. This provides person C with a ratio of PIA to (covered) AIME of 90%, which is substantially more generous than the 38% ratio provided to person B, even though B and C have identical lifetime earnings. To use the language of the provision designed to address this issue, person C would receive a ‘windfall’.
3 How does the WEP work?
In 1983, Congress acted to correct this potential ‘windfall’ to public employees. A natural approach to adjusting for public employment, which we will call the ‘proportional WEP’ to distinguish it from the actual WEP, would entail calculating a participant's ‘total PIA’ based on total (covered and non-covered earnings) – $1891.34 in the case of person C – and then multiplying by the ratio of covered-to-total earnings – 0.1 for person C. This would result in a ‘covered PIA’ of $189.13. Note that the resulting replacement rate of covered earnings under the ‘proportional WEP’ is, by construction, 38%, identical to the replacement rate provided to an individual with identical total lifetime earnings. In addition to preserving the distributional aspect of the benefit formula, this approach would also be relatively simple to explain to affected participants in a manner that would likely be viewed as ‘fair’.Footnote 7
Implementation of a proportional WEP, however, would require that SSA keep track of total earnings, including non-covered earnings. Unfortunately, this could not be operationalized by the SSA in 1983 due to the fact that the SSA had not historically collected information on non-covered earnings. Specifically, according to 2005 Congressional testimony by an SSA official, ‘SSA only has records of non-covered earnings beginning in 1978, when it began receiving Form W-2 information from employers, and some of these records are incomplete – particularly for the years soon after SSA began collecting this earnings information’ (Social Security Administration, 2005). Even if one assumes that the SSA started to keep more complete records in 1983, it will be at least 2018 before they have 35 years of both covered and uncovered earnings for new retirees. It will be nearly a decade beyond that before SSA will have records sufficient to ensure that they have a 62-year-old's uncovered earnings going back to age 18. Diamond and Orszag (Reference Diamond and Orszag2003) have suggested that this approach could be implemented now by requiring that this alternative calculation ‘be available only to workers who provide the Social Security Administration with a complete history of earnings in non-covered work.’ Such an approach would increase benefit expenditures, however, as only those workers who would see their benefit rise as a result of the alternative calculation would have the incentive to provide such records.
In recognition of these operational constraints, Congress created a modified benefit formula that is based only on covered earnings. The key difference between the ordinary benefit formula and the one used for individuals subject to the WEP is that under the WEP, the covered earnings up to the first PIA bend point (e.g., the first $711 of AIME in the year 2008) are converted to PIA at a rate of 0.4 rather than 0.9. Note that the WEP adjustment is applied to the PIA before benefits are adjusted for early claiming, delayed claiming or cost of living adjustments. As this applies only on the first $711 of AIME, the maximum benefit reduction under the WEP is $355.50 per month, or $4,266 per year, in 2008.
This formula is then further altered for individuals who have more than 20 years of ‘years of coverage’ (YOC), defined as any year in which an individual has covered earnings that meet a minimum amount. For 2008, a YOC is defined as earnings in excess of $18,975.Footnote 8 For individuals with 20 or fewer YOCs, earnings to the first PIA formula bend point are credited at 0.4. For each year over 20, the first PIA factor is increased by 0.05, up to the maximum of 0.9. Thus, for individuals with 30 or more years of YOCs, the benefit formula is identical to the standard, non-WEP benefit formula. Equation (2) presents the benefit formula for individuals affected by the WEP:
 $$\eqalign{{\rm PIA}_{{\rm WEP}} = (0.4 + 0.05\min (10\comma \max (0\comma {\rm YOC} - 20))) \min ({\rm AIME}\comma 711) \cr + 0.32\max (0\comma \min ({\rm AIME}\comma 4288) - 711)\cr + 0.15\max (0\comma {\rm AIME} - 4288). \cr}$$
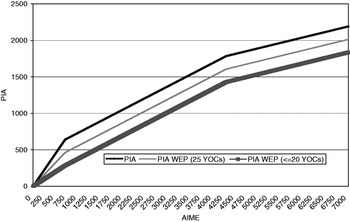
Thus, for person C in the example above who had a covered AIME of $500, the PIA after the WEP adjustment (assuming fewer than 20 YOCs) would be $200, for a PIA/AIME ‘replacement rate’ on covered earnings of 40%. The fact that the benefit calculated under the actual WEP formula differs from the proportional WEP described above is typically the rule rather than the exception. These adjustments can be seen in Figure 2, which shows the benefit formula for an individual with 30+ YOCs (or, identically, someone not subject to the WEP), an individual with 25 YOCs, and an individual with 20 or fewer YOCs.
4 Distributional implications of the current WEP
In this paper, we analyze the distributional implications of the WEP on an individual basis using the income replacement rate concept as our key measure. The use of individual replacement rates is commonly used in policy circles to measure the degree of redistribution in the Social Security system as a whole, although the limitations of this measure have been documented in a number of influential academic papers.Footnote 9 These academic studies have suggested that one might wish to analyze Social Security redistribution on a household, rather than an individual, basis, in order to account for the fact that a low earner might be part of a high earning household. They have also suggested that one might want to account for differential life expectancy in light of the well-known fact that higher income individuals tend to live longer than lower income individuals. Another possible refinement is the idea of taking into account ‘potential’ income, i.e., the idea that some people have high earnings potential but choose to voluntarily remain out of the labor force. In general, these studies have found that when analyzed using these alternative metrics, the overall degree of redistribution is much lower than when analyzed on an individual basis. These factors could interact with the WEP to the extent that workers in non-covered employment tend to differ from covered workers along the relevant dimensions. Given the severe data constraints on the ability to observe both covered and uncovered earnings on a lifetime basis, however, we leave such analysis to future work.
The PIA formula with WEP adjustments.

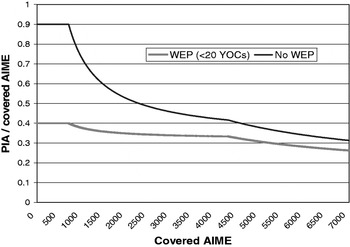
On an individual basis, there are two aspects of the WEP adjustment that cause it to affect low earners proportionately more than higher earners. First, the maximum WEP adjustment is reached at a low level of earnings: specifically, the WEP reduction applies only to covered earnings up to the first PIA bend-point ($711 in 2008). For all individuals with covered AIME above this, the maximum reduction of $355.50 represents a smaller fraction of earnings as earnings rise. This simple point is illustrated in Figure 3, which charts the replacement rate (the ratio of PIA at the NRA relative to covered AIME) for different income levels for individuals with no WEP (or individuals with 30+YOCs) and for individuals with 20 or fewer YOCs who are subject to the WEP. The difference between the two lines is the result of the WEP, and not surprisingly, this adjustment is larger (relative to covered AIME) for those with a lower AIME. Thus, holding constant the fraction of total earnings that are covered, the WEP hits lower earners proportionally harder.
Covered earnings replacement rates with and without WEP.

A second way in which the WEP can have a distributional impact can be seen when one holds constant the fraction of earnings covered, and instead varies total (covered plus uncovered) earnings. Recall that a YOC is granted for a given year on an all-or-nothing basis, depending on whether one's covered earnings exceed the threshold. Thus, if we hold constant the fraction of total income that is covered versus uncovered, a higher income individual is more likely to cross the YOC threshold. For example, if two individuals each have 50% of their earnings covered, the person who earns $40,000 per year has covered earnings ($20,000) that exceed the YOC threshold in 2008, while an individual earning $35,000 per year has covered earnings ($17,500) that are below the threshold.
For individuals close to the YOC in a given year who expect to have between 20 and 30 YOCs in their lifetime, crossing the YOC threshold can boost lifetime benefits substantially. For example, an individual claiming in 2008 with an AIME exceeding $711 (so that the full WEP offset applies), increasing one's YOCs by one year (between 20 and 30) would boost initial individual benefits at the NRA by $35.55 per month. Given that these benefits are inflation indexed and last for life, the increment to the expected present value of lifetime benefits (calculated as of the NRA) is over $5,000 for each additional YOC between 20 and 30.Footnote 10 Indeed, the increment to lifetime income would be even higher for those receiving spousal, survivor, and other family benefits that are calculated based on this PIA.
Another way to view the magnitude of this change is as follows. For someone whose AIME is between the two bend points (i.e., between $711 and $4,288), raising one's PIA by $35.50 per month would normally require raising one's lifetime earnings (on a wage indexed basis) by $46,593.75.Footnote 11 For an individual with an AIME beyond the 2nd bend point, the increment to lifetime earnings required to boost monthly income by $35.50 is $99,400. Yet for those in the affected range of the WEP, this incremental benefit can be earned by having only $18,975 in covered earnings during the year. Thus, in addition to distributional effects being explored here, these provisions could have large effects on labor supply incentives for individuals in the affected range.
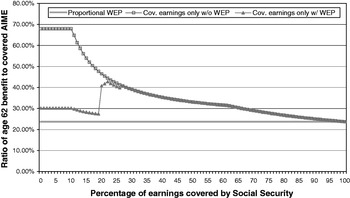
The full WEP formula, including the YOC adjustment, can lead to some highly nonlinear movements in the benefit-to-AIME ratio as the fraction of covered earnings rises. For example, in Figure 4, we use an individual classified by the SSA actuaries in 2008 as a ‘maximum earner’, i.e., an individual whose earnings in every year were precisely equal to the maximum earnings that were subject to the payroll tax in that year. We assume this individual enters the workforce at age 21 in 1967, and retires and claims on his 62nd birthday (assumed to be 1 January 2008). As the individual is claiming before his normal retirement age, the benefit that he receives by claiming on 1 January 2008 is approximately 75% of his PIA.Footnote 12
Ratio of benefit at age 62 to covered AIME for ‘Max Earner’.

In Figure 4, we vary the fraction of total earnings that are covered by Social Security from 0 to 100%, in each case assuming that this percentage applies to earnings in every individual year. There are three lines presented in Figure 4. For comparison, the horizontal line at just under 24% is the replacement rate that a max earner would receive at age 62 under the ‘proportional WEP’ baseline. Recall that this proportional WEP is a useful baseline because it replicates the replacement rate that the person would receive if 100% of their earnings were fully covered by Social Security.
The second line, which begins at just under 68% (which corresponds to the 90% PIA factor, adjusted by the age 62 actuarial reduction) and then gradually declines to the 24% rate when all earnings are covered, is the replacement rate that the max earner would receive if there were no WEP adjustment. The difference between these first two lines is a measure of the ‘windfall’ that the WEP was meant to address. The third line shows the replacement rate provided under the actual WEP formula.
There are three noteworthy points about the actual WEP benefit pattern relative to the ‘Without WEP’ and ‘Proportional WEP’ benefits. The first and most obvious point is that all the replacement rates with the WEP are lower than or equal to those resulting from the application of the standard PIA formula to covered earnings without regard for the windfall. A second point to note is that, for this maximum earner, the replacement rates are all higher than the 24% that the individual would have received under a proportional WEP. In other words, maximum earners are getting a better return on their Social Security dollars – even with the WEP adjustment – than they would receive had their earnings been fully covered by Social Security. Thus, it is somewhat ironic that these individuals would find the WEP so objectionable, given that the current design of the WEP still provides them with a higher replacement rate on their covered earnings than otherwise similar lifetime earners are receiving.
A third point to note about this line is that the pattern of replacement rates is highly non-monotonic. It begins at approximately 30% (which corresponds to the 40% PIA factor under the WEP, adjusted by the age 62 actuarial reduction) when 10% or less of earnings each year are in covered employment, and then gradually drops to 27.4% before jumping up to over 40%, and then declining gradually. The discrete jumps occur at places where a small change in the fraction of covered earnings each year causes the individual's covered earnings in some years to qualify as YOCs. For example, the move from 19 to 20% of earnings causes a jump from 2 to 27 in the number of years of this particular earnings profile where the YOC threshold is met, thus increasing the first PIA factor from 0.4 to 0.75 (such a disproportionate jump is admittedly an artifact of how these particular earnings profiles are constructed, but it illustrates the important role that the YOC thresholds play). Subsequent small increases in the proportion of earnings covered by Social Security further increases the number of YOCs to 29 at 22% of earnings, where the number of YOCs stays until 27% of earnings are covered, at which time there is a jump to 41 YOCs, reverting the individual back to the ordinary benefit formula applied only to covered earnings. Recall that once the individual reaches 30 or more YOCs (which occurs for the maximum earner once 27% of earnings are covered), the WEP formula reverts to the non-WEP formula.
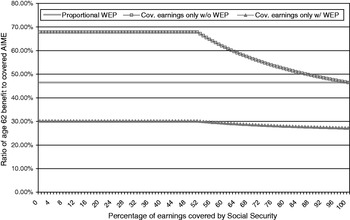
The finding that a ‘max earner’ individuals receive a higher replacement rate – even with the WEP in place – than other individuals whose identical level of income is fully covered by Social Security is not a finding that holds true for lower income workers. As seen in Figure 5, an individual with a ‘scaled low earner’ profile (defined by SSA as an individual with earnings equal to 45% of average wages) would have a replacement rate of 46.5% under the proportional WEP (which is also the replacement rate if all earnings were covered by Social Security). Regardless of the fraction of earnings covered by Social Security, these low earners receive a replacement rate of less than or equal to 30.2%, more than a 1/3 reduction. Notably, even when 100% of the low earner's earnings are covered by Social Security, this individual has fewer than 20 years that classify as a YOC, and therefore the individual never experiences the benefit of a YOC adjustment to the benefit.
Ratio of benefit at age 62 to covered AIME for ‘Low Earner’.

We have constructed similar graphs for medium and high earners, but omit them for the sake of space. Qualitatively, however, the benefits under the WEP are lower than the benefits under the proportional WEP for ‘medium earners’ who have less than 45% of their earnings covered each year by Social Security.Footnote 13 As the fraction of annual earnings covered by Social Security rises from 45 to 50%, medium earners see a large step-up due to the rise in the number of YOCs, so that above 50% of earnings covered, the individual receives a higher benefit under the WEP than they would receive under a proportional WEP. For ‘high earners,’ the WEP formula lies above the fully covered replacement rate in most ranges (the exception being from approximately 18 to 28% of earnings covered, in which case the benefit ratio is slightly lower than that received under the proportional WEP).
Naturally, the use of these stylized workers exaggerates the concentration of the YOCs by percent of earnings covered, due to the fact that the definition of low, medium, high, and max earner are tied to the average wage index, as is the YOC itself. Further, it is unlikely that any given individual would split their earnings over their entire career by a fixed percentage of covered and uncovered employment, although having many years of mixed employment is not uncommon (e.g., public school teachers who work in private sector jobs during the summer). Individuals may also spend some of their years in fully covered employment, and others outside. The fully covered years would likely qualify for YOCs, while the non-covered years would not.
Nonetheless, these graphs, and others like them, illustrate two key patterns. First, they illustrate the regressive nature of the WEP by showing that low earning individuals are more likely to receive a lower benefit under the WEP than individuals with otherwise similar lifetime earnings, while high earners are likely to receive a higher benefit-to-AIME ratio than fully covered high earners. Second, these graphs illustrate that the WEP formula generates non-monotonic patterns of benefit–AIME ratios, a fact that creates issues of ‘fairness’ when evaluated on a distributional basis.
A key insight emerging from these analyses is that the distributional effects of the WEP vary depending on whether one is a lifetime low earner (based on total income) or whether one is actually a higher earner that simply has a small part of one's career in covered employment. Unfortunately, the same lack of data on non-covered earnings that lead to the adoption of the current WEP also makes it difficult to conduct a comprehensive analysis of how total earnings are divided among covered and uncovered work. There are two publicly available analyses by the SSA, however, that provide some insight.
Lingg (Reference Lingg2008) provides summary statistics from the Master Beneficiary File as of December 2006. According to these tabulations, about one-quarter of all beneficiaries affected by the WEP in December 2006 had 21 or more years of covered earnings under Social Security (and were thus affected by a partial WEP adjustment), whereas the remaining three-quarters had 20 or fewer years (and were thus subject to the full WEP adjustment). This does not tell us anything about the proportion of their total earnings in covered versus uncovered employment, but it does tell us that about a quarter of those affected by the WEP are in the 21–30 year phase-out range where sharp nonlinearities in benefit accruals can occur.
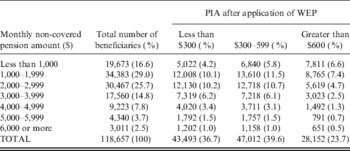
In Table 2, we reproduce some of the most relevant data for this paper provided by Lingg (Reference Lingg2008). The population included in this table is the 118,667 retired workers affected by the WEP who became entitled to benefits in 2004–2006 and for whom SSA has information about their non-covered pension amounts (i.e., the amount of their pension from their state or local government employer). The rows show the amount of the non-covered monthly pension income in $1,000 categories, and the columns show the number of individuals (and the percent of the 1,18,657 total) who have a PIA (after application of the WEP) that is less than $300, from $300 to $599, and over $600.
Distribution of retired workers affected by the WEP who became entitled to benefits in 2004–2006, by non-covered pension amount and PIA, December 2006. Number of beneficiaries (% of sample)

Source: Modified from Table 8 in Lingg (Reference Lingg2008). Sample restricted to those beneficiaries for whom SSA has a measure of their non-covered pension amount.
First, note that about one of every six (16.6%) WEP-affected beneficiaries had a non-covered monthly pension amount of less than $1,000 per month. Another 29% had non-covered pension amounts totalling between $1,000 and $2,000. Thus, just under half of those affected by the WEP have a monthly income from their non-covered pension that was below $24,000 per year. We are severely limited as to how much we can infer about their lifetime earnings from this non-covered pension data, as there is significant variability in the benefit calculations across hundreds of state and local pension plans covering these participants. However, qualitatively, it would seem that most of those with pensions of greater than $2,000 per month had long careers outside of Social Security and are unlikely to be lifetime low earners.
If we look across the columns in Table 2, we see the fraction of workers with PIAs (after application of the WEP) that fall in various intervals. For example, 4.2% of the population subject to the WEP has a monthly non-covered pension benefit that is less than $1,000, and also ends up with a post-WEP PIA of less than $300. In total, 31.6% of the WEP-affected population falls into the upper left 2 × 2 set of cells, meaning they have under $2,000 of pension earnings and less than $600 of PIA. This group is more likely to have total lifetime earnings at the lower end of the distribution.
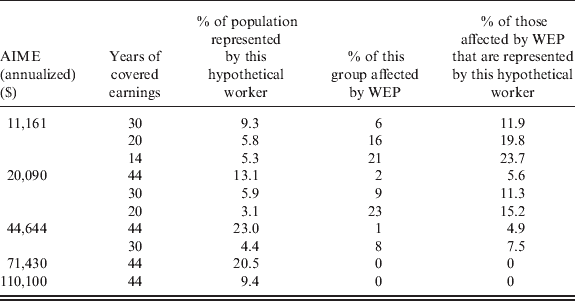
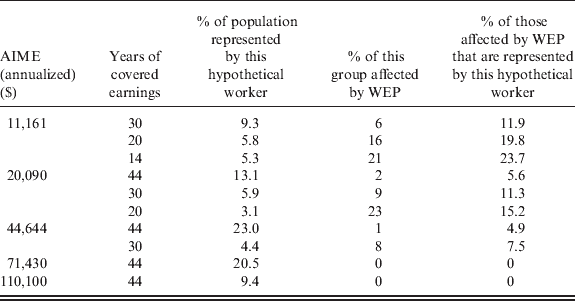
A second data source is the table that the Social Security actuaries have recently started reporting as part of their solvency analyses of reform proposals, which we have partially reproduced in Table 3.Footnote 14 This table shows ten hypothetical workers, differentiated by AIME and years of covered service that the SSA actuaries now use to evaluate solvency proposals. The first column is the AIME of the hypothetical worker, the second column shows the number of years of covered service that led to this AIME, and the third column shows the fraction of the U.S. population that is closest to this hypothetical worker based on 2007 SSA data. Column 4 shows what fraction of individuals closest to this hypothetical worker group is estimated to be subject to the WEP. In column 5, we compute the fraction of the WEP-affected population that is represented by this hypothetical worker.Footnote 15 As one can see, more than half (55.4%) of the WEP affected population has an AIME that is most closely represented by the ‘very low AIME’ group (i.e., annualized AIME of $11,161 or less), with an additional one-third of the population represented by the ‘low AIME’ group, based on covered earnings (i.e., annualized AIME of $20,090 or less). This table reinforces the notion that most of the individuals with low AIME did not spend many years in covered employment. As with the Lingg data, however, we do not observe uncovered earnings and are therefore limited in our ability to make broader inferences about the total lifetime earnings of these individuals.
Approximate distribution of workers represented by Social Security ‘Hypothetical Workers,’ by AIME, number of years of earnings, and fraction affected by the WEP, 2007
Source: Modified from Table B3 in ‘Estimated Financial Effects of a Proposal to Restore 75-Year Solvency for the Social Security Program. Requested by Senator Kay Bailey Hutchison.’ http://www.ssa.gov/oact/solvency/index.html. Plus authors' calculations.
5 Alternative approaches to computing the WEP
SSA is not currently able to use uncovered earnings to calculate the ‘proportional WEP’ due to the lack of comprehensive administrative records on non-covered earnings. Nonetheless, the fact that the existing WEP reduces benefits by a larger fraction for lower earning individuals may be viewed by some as an undesirable feature of the existing policy. In this section, we consider two alternative approaches to calculating the WEP that meet three constraints: (1) the adjustment is approximately cost-neutral to the OASDI trust funds; (2) the adjustment does not rely on SSA having information on uncovered earnings; and (3) the adjustment does not rely on changes in the underlying PIA formula and would therefore not change benefits for individuals not currently affected by the WEP.Footnote 16 Loosening any one of these constraints opens up a wider range of alternative approaches, including ones that simultaneously handle other populations with only limited covered labor force participation, such as immigrants or individuals that voluntarily spend time out of the labor force.
In order to approximate the first constraint, the SSA Office of the Actuary graciously provided us with a cross-tabulation of covered AIME and YOCs from the 2007 Master Beneficiary Survey. This cross-tab was for the 1937 birth cohort, and includes all primary beneficiaries in current pay status to whom the WEP applies.Footnote 17 In total, this includes 66,352 individuals. Using this information, we calculate that the total value of the benefit adjustment applied to the PIA for this cohort, using the PIA factors in place in 1999, the year in which this cohort turned 62. We estimate that the WEP adjustment reduced aggregate PIA for this group by $13.7 million dollars, relative to a pre-WEP aggregate PIA of $38.3 million.
As a first alternative WEP, we simply take the ratio of post-WEP PIA ($24.6 million) to pre-WEP PIA ($38.3 million), and apply this adjustment to the full non-WEP PIA for individuals. Under this approach, the formula adjustment for a YOC would be eliminated. The PIA formula for individuals affected by the WEP would be represented by Equation (3):
 $${\rm PIA}_{{\rm WEP}}^{{\rm Alternative}\,{\rm 1}} {\rm = 0}{\rm .642PIA}_{{\rm No\ WEP}}.$$
Under this alternative policy, individuals who have both covered and uncovered earnings under Social Security would simply receive a benefit that is 64.2% of the benefit that results from the application of the standard formula to covered earnings. This is mathematically equivalent to reducing the PIA factors from (90, 32, 15) to (57.8, 20.5, 9.6).
If policy-makers wished to maintain the YOC concept, this approach could be adapted to gradually revert to the non-WEP formula based on YOCs. Of course, allowing the YOC credits to reduce the WEP adjustment for individuals with more YOCs requires a larger adjustment to the base formula in order to keep it cost neutral. By using the AIME × YOC tabs provided by SSA, we approximate that the modified formula would reduce the multiplication factor to 0.58, and then increase the benefits by 0.042 for each YOC between 20 and 30, as in Equation (4).
 $${\rm PIA}_{{\rm WEP}}^{{\rm Alternative}\,{\rm 2}} = (0.58 + 0.042\min (10\comma \max (0\comma {\rm YOC} - 20))) {\rm PIA}_{{\rm No}\ {\rm WEP}} .$$
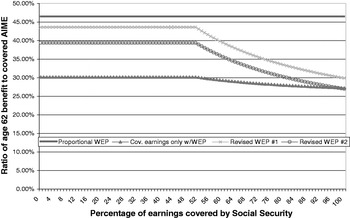
As we have constrained the WEP adjustments to be (to a close approximation) cost neutral, there will of course be both winners and losers from any such reform relative to the status quo. The adjusted WEP approaches increase benefits for individuals with lower covered AIMEs and reduce them for individuals with higher covered AIMEs. Of course, the ‘winners’ include both genuine low earners and high earners with a small fraction of earnings covered by Social Security. Without access to uncovered earnings data, it is difficult to avoid this outcome. Importantly, these ‘winners’ may still end up with a lower ratio of benefits to covered AIME than fully covered individuals with the same lifetime earnings level. For example, the ‘low earner’ receives a benefit under either adjusted WEP formula that is higher than the existing benefit, but still lower than the 46% rate that they would have received were all earnings covered (i.e., under the proportional WEP). This can be seen in Figure 6.
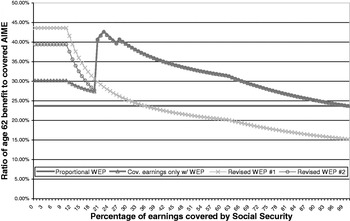
The ‘losers’ relative to the status quo are high earners who have substantial covered earnings. Whether or not these ‘losers’ end up with a higher or lower replacement rate than they would under the proportional WEP depends in part on whether the YOC adjustment is used or not. As indicated in Figure 7, the alternative WEP that ignores the YOC adjustment provides a lower benefit than the proportional WEP baseline for maximum earners with more than 35% of earnings covered. If the alternative WEP with a YOC adjustment is used, this alternative remains everywhere higher than the proportional WEP baseline. Stated differently, with the alternative WEP that includes the YOC adjustment, even the ‘losers’ still receive a windfall, albeit a smaller one than under the status quo for those high earners with a low share of their income covered by Social Security.
Ratio of age 62 benefit to covered AIME under alternative WEP rules for ‘Low Earner’.

Ratio of age 62 benefit to covered AIME under alternative WEP rules for ‘Max Earner’.

6 Discussion and conclusions
The Social Security benefit formula was designed to be nonlinear in an attempt to redistribute benefits from higher earning workers to lower earning workers. It was not designed this way in order to transfer resources from workers who are full participants in the system to workers who are only partially covered. Yet the simple application of the standard benefit formula to partially uncovered workers would have exactly this effect. As such, some form of benefit adjustment for workers with uncovered earnings can be justified as being consistent with the goals of the benefit formula.
Nonetheless, the WEP is controversial. While many of the objections to the WEP appear to be uninformed about the rationale for a benefit adjustment in the presence of a nonlinear benefit formula, one objection that has support in the data is that the WEP hits lower earners disproportionately hard. Our research suggests that, among individuals subject to the WEP, those individuals with low lifetime earnings receive a lower ratio of benefits to covered earnings – and thus receive a lower ‘return’ on their OASDI contributions – than do individuals with higher lifetime earnings.
If SSA had access to a complete set of uncovered earnings records, the conceptually simple way to make such an adjustment would be to calculate an individual's benefit using total (covered plus uncovered) earnings, and then multiply this by the ratio of covered-to-total lifetime earnings. The SSA, however, does not have access to reliable earnings histories prior to the early 1980s. In the absence of these data, it is quite difficult to construct an alternative WEP that maintains the intended degree of redistribution in Social Security.
Nonetheless, it is possible to construct alternative approaches to the WEP that come closer to preserving the degree of progressivity in the benefit formula, rely only on covered earnings data, are budget neutral, and leave benefits unaffected for those not subject to the WEP.
Short of changing the primary Social Security benefit formula, SSA may be able to reduce some of the public dissatisfaction with the existing WEP if it were framed differently. Both the online retirement planner on the SSA website and the print publications on the WEP specifically state that benefits will be ‘reduced’ by the WEP.Footnote 18 Although we are not aware of any direct research on the framing of the WEP, we suspect that the current framing triggers feelings of ‘loss’ and leads to a perception of an unfair benefit cut. Alternative framing of the same information might be able to mitigate some of the anger that the WEP generates. For instance, the information could discuss ‘getting your benefit right’ instead of ‘your benefit may be reduced.’ Changes in how information is framed have been shown in a variety of contexts, including Social Security claiming (e.g., Brown et al., Reference Brown, Kapteyn and Mitchell2011), to influence both attitudes and behaviors.
Although this paper was focused on distributional aspects of the WEP, we note that the non-monotonic pattern of benefits that are introduced by the YOC adjustment provide interesting labor supply incentives to those who expect to find themselves in the 20–30 YOC range near retirement. As these marginal incentives are quite large, future research may be able to use them as a source of variation for studying how labor supply is affected by Social Security accruals, holding constant total lifetime earnings.