I. INTRODUCTION
CaF2 films with vertically aligned nanorods have been recently observed by Li et al.Reference Li, Parker, Tang, Wang, Lu and Lee1 These CaF2 nanorods have been grown by using the oblique angle deposition technique.Reference Zhao, Ye, Wang and Lu2 The deposited nanorods present a unique microstructure due to shadowing and surface diffusion effects during the deposition process. Arrays of these CaF2 nanorods, which possess a biaxial crystal orientation, can be grown on amorphous substrates, such as glass. Therefore, CaF2 nanorod arrays can be potentially useful as buffer layers for production of high-quality semiconductor films.Reference Findikoglu, Choi, Matias, Holesinger, Jia and Peterson3, Reference Teplin, Ginley and Branz4 Similarly to other nanorods, such as carbon nanotubesReference Liu, Li, Zhai, Li, Zheng, Jiang and Zhu5–Reference Journet, Moulinet, Ybert, Purcell and Bocquet7 and Si nanorods,Reference Fan and Zhao8–Reference Fan and Zhao11 CaF2 nanorods are also very susceptible to capillary pressure caused by liquid contact. We have investigated the effect of capillary pressure on the CaF2 nanorods and, surprisingly, found that the CaF2 nanorods array can be transformed into a uniaxially aligned microstrip structure by capillary pressure.
The effect of capillary pressure on vertically aligned nanorods has been intensively studied because it causes significant deformation of nanorod arrays due to their extremely high aspect ratio and surface-to-volume ratio. When a liquid droplet is placed on the nanorod array, nanorods are easily bundled or damaged. The bundling effect caused by liquid contact is normally an important issue in various applications, especially for sensors and superhydrophobic surfaces. Therefore, this effect, also known as the “nanocarpet effect,”Reference Fan, Dyer, Zhang and Zhao9 has been intensively studied to understand its underlying mechanism so that one can either eliminate or use the bundling of nanorod arrays.Reference Fan and Zhao11–Reference Fan, Fu, Collins and Zhao13 Recently, some groups have reported periodic structures, such as cellular structureReference Chakrapani, Wei, Carrillo, Ajayan and Kane14, Reference Huang, Zhou, Sansom, Gharib and Haur15 and hierarchical helical structures,Reference Pokroy, Kang, Mahadevan and Aizenberg16 resulting from capillary pressure. In this report, we demonstrate for the first time uniaxially self-aligned micropatterns induced by capillary pressure using CaF2 nanorod arrays.
II. EXPERIMENTAL SECTION
A. Growth conditions of CaF2 nanorods
The CaF2 nanorods are grown by the oblique angle deposition technique in a vacuum chamber with a base pressure of 10−7 Torr. Glass slides or Si wafers are placed ~25 cm away from the CaF2 source during deposition. The CaF2 flux incident angle on the substrates was ~65° with respect to substrate normal. A quartz-microbalance device was used to monitor the growth rate and film thickness. Detailed growth conditions for CaF2 nanorods can also be found elsewhere.Reference Li, Parker, Tang, Wang, Lu and Lee1
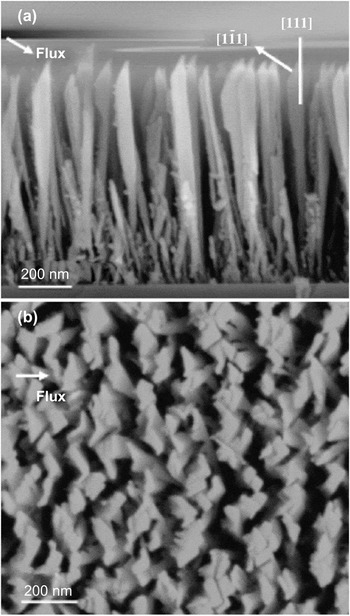
The as-deposited nanorods are nearly perpendicular to the substrate surface. The diameter of the nanorods is ~100 nm. The nanorod tip is sharp, with the slanted top surface nearly perpendicular to the incidence flux. Its four sidewalls are nearly parallel to the substrate normal. Overall, the film contains higher density (less porous) of nanorods perpendicular to the flux incident direction than that along the flux. On the basis of previous x-ray diffraction (XRD) analysis,Reference Li, Parker, Tang, Wang, Lu and Lee1 the films are known to be biaxially textured, denoted by {111} 〈121〉. Transmission electron microscopy (TEM) observationsReference Li, Parker, Tang, Wang, Lu and Lee1 performed in tandem with the XRD analysis revealed that taller nanorods have stronger biaxial orientation. The structure of individual nanorods and the overall morphology of a 1-μm-thick film are seen in Fig. 1. The biaxial structure at the tips of the nanorods is illustrated in Fig. 1(a). The nanorod density in the film is also dependent on the deposition flux direction. As seen in Fig. 1(b), there appears to be a greater number of channels free of nanorods in the direction perpendicular to the flux than in the direction parallel to the flux. The dark areas between high-density regions in Fig. 1(b) are caused by gaps between the tops of “tall” nanorods. As seen in Fig. 1(a), near the Si substrate these dark regions are populated with “short” nanorods that do not extend to the top because of shadowing effects during growth.
SEM images of CaF2 biaxial nanorods: (a) side view; (b) top view.

B. Contact angle measurement and SEM observation
A computer-interfaced VCA Optima XE goniometer (Advanced Surface Technology, Billerica, MA) was used for contact angle measurement. To measure water contact angles (WCA), a 2-μL water droplet was carefully placed onto the nanorod film. Because the water droplet spreads in an oval shape, WCAs are measured for both the short and long droplet dimensions. For scanning electron microscopy (SEM) observation, to minimize sample charging during electron microscopy all samples were coated with gold for 1 min at a pressure of 50 mTorr using a Desk II mini sputter machine (Denton Vacuum, Moorestown, NJ). SEM images were obtained using an SX-40A SEM system (ISI, Paramus, NJ).
C. Poly(dimethylsiloxane) (PDMS) casting
To replicate the aligned CaF2 micropatterns, PDMS, Sylgard 184 (Dow Corning, Midland, MI), has been used for the casting process.Reference Sun, Luo, Xu, Ji, Ouyang, Yu and Chen17 Because of its viscoelastic liquidlike behavior, PDMS has to be mixed with its catalyst for solidification. After mixing PDMS and its catalyst at 10:1 volume ratio for 15 min, the mixed PDMS sol is placed into a vacuum oven for ~30 min to remove air bubbles. Before casting PDMS sol onto the master that has the aligned CaF2 micropatterns, an antisticking monolayer is deposited onto the master surface by evaporating trimethylchlorosilane (TMCS) (Acros Organics, Geel, Belgium) for 10 min at room temperature. Next, PDMS sol is cast onto the master coated with the hydrophobic monolayer. After baking at 85 °C for 2 h in a conventional oven, PDMS sol is cured and solidified. Finally, the PDMS replica is peeled off from the master along the parallel direction to the aligned micropatterns.
III. RESULTS AND DISCUSSION
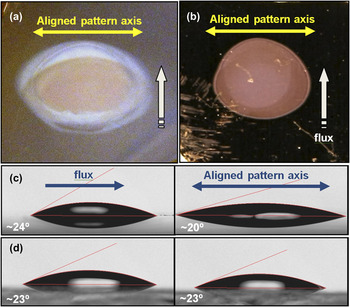
A water droplet placed on the biaxial CaF2 nanorod array film spreads quickly and forms a directional (oval) shape. A watermark is observed after evaporation of the water droplet. This watermark exhibits diffracted light scattering similar to that observed with compact disks, indicating that a periodic micro/nanostructure has been formed. Figure 2 shows photos of the watermark and WCAs on a CaF2 nanorod film. As shown in Figs. 2(a) and 2(b), the water droplet spreads directionally and the watermark remains in oval shape. The shadowing effect of oblique angle deposition results in higher nanorod density in the direction perpendicular to the flux than in the direction parallel to the flux, as seen in Fig. 1(b). Although the nanorods are not aligned at the microscopic level, the density difference provides a certain degree of aligned texture effect at the macroscopic level and results in anisotropic wetting caused by energy barrier difference to the movement of the water contact line.Reference Chung, Youngblood and Stafford18, Reference Khare, Zhou and Yang19 The directional spreading is proportionally related to the height of CaF2 nanorods. Taller nanorods produce more directional spreading of the water droplet. The film of 1-μm-tall CaF2 nanorods gives a very obvious oval shape of a watermark [Fig. 2(a)], whereas the film of 200-nm-tall CaF2 nanorods gives an almost circular watermark [Fig. 2(b)]. The ratio between long and short axes in the two films is ~1.45:1 and 1.16:1, respectively. We have found that the long axis of the watermark is perpendicular to the flux incident direction for CaF2 deposition. Because of this asymmetry distribution of water droplets, WCAs depend on the location of the measurement. For the film with nanorods of 1 μm in height [Fig. 2(c)], the WCA is ~24° on the location parallel to the flux direction and ~20° on the location perpendicular to the flux direction. In contrast, the WCA for the normally deposited CaF2 film without the nanorods [Fig. 2(d)] is ~23° in all directions due to its circular spreading. From the watermark shape and its color based on the diffraction grating effect, we conclude that periodically aligned micro/nanopatterns must be formed after water treatment.
Effect of water droplet: water mark photos on CaF2 nanorod layers of (a) 1 μm and (b) 200 nm thickness; and WCA on (c) 1-μm-thick CaF2 nanorod layer and on (d) CaF2 film with no nanorods.

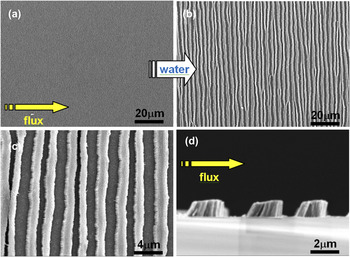
To confirm the formation of periodically aligned patterns after water treatment, we have investigated the watermark using electron microscopy. The original surface of the CaF2 film with nanorod array has a relatively uniform morphology, as shown in Fig. 3(a). However, after the effect of capillary pressure exerted by a water droplet the original uniform surface has been transformed into a patterned surface that consists of well-aligned microstrips [Fig. 3(b)] consisting of bundles of CaF2 nanorods. Interestingly, the left edge of the strips [Fig. 3(c)] presents a different shape than the right edge. The SEM image of the cross section [Fig. 3(d)] reveals that the left edges are inclined while the right edges are nearly vertical. This difference has been observed in all microstrip patterns regardless of the direction of water intrusion and evaporation. It appears that the unique structure of CaF2 nanorods results in the difference of edge morphology and pattern alignment.
SEM observation: (a) original surface of 1 μm tall CaF2 nanorods (1 k× magnification); self-aligned microstrip patterns formed by water at (b) 1 k× and (c) 5 k× magnification; (d) cross-section view of microstrip patterns at 10 k×.

On the rough surfaces of the nanorod array films, liquids are spread by capillary pressureReference Washburn20 described by

where γ is the surface tension of the liquid, r e is the effective radius of the interface, and θ is the contact angle between the solid and the liquid. Because the capillary pressure is closely related to the surface tension as described in Eq. (1), we have also investigated the effect of ethanol on the CaF2 films with nanorod arrays. Ethanol has a much lower surface tension (22 mN/m) than water (72 mN/m). After ethanol evaporation, a pattern with aligned microstrips has also been observed, but their widths and alignment [Fig. 4(a)] are very different from that produced by water [Fig. 3(c)]. When the ethanol droplet is placed on the CaF2 films with nanorod array, it wets a much larger area with a WCA ~0° because of its low surface tension and the high surface roughness. The microstrip width is thinner than that caused by water and the patterns are not aligned very well. Similarly, for shorter nanorods of 200 nm, much less well-aligned microstrips are formed [Fig. 4(b)].
SEM observation of (a) self-aligned microstrip patterns formed by ethanol; (b) self-aligned microstrip patterns of 200 nm tall CaF2 nanorods formed by water.

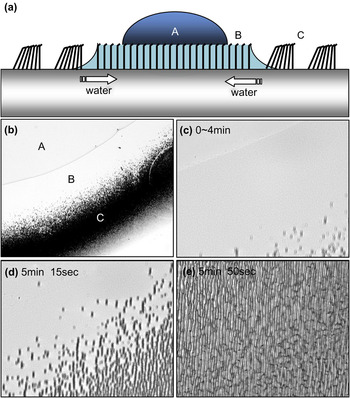
Optical microscope observation has been performed to investigate the transition of CaF2 nanorod array into aligned microstrips. As shown schematically in Figs. 5(a) and 5(b), three different regions have been identified after placing a water droplet onto the film with nanorod arrays. Regions A and B are wetted by the initial water droplet and the capillary-driven water intrusion, respectively. Region C is the dried area where aligned microstrips are formed. Figures 5(c)–5(e) show the real-time transition of CaF2 nanorod film into an aligned microstrip pattern. When the water droplet is placed onto the CaF2 films with nanorod arrays, the area wetted by the water droplet is constant for an initial period of time and then becomes smaller as the water evaporates. The area wetted by capillary pressure also becomes smaller as its boundary area is drying and transitions to self-assembled microstrips. Interestingly, no transition has been observed in any region while it is wet, whereas it suddenly occurs when the wet surface is drying out. A video clip taken at 200× of the microstrip formation process is included as Supplementary Information. In this video, initially a portion of the water droplet is seen retreating in the left side at some distance from the microstrips. Microstrip formation follows the retreating water droplet, but only in the region where the below-surface water is evaporating.
Optical microscope observation: (a) schematic diagram for self-aligned pattern formation. (b) A and B regions wet by water droplet and capillary-driven water, respectively, and the dried C region has self-aligned microstrip patterns (100× magnification); (c) maintaining initial status from water droplet displacement (400× magnification); (d) self-assembling microstrip patterns in drying area (400× magnification); (e) dry surface that has microstrip patterns (400× magnification).

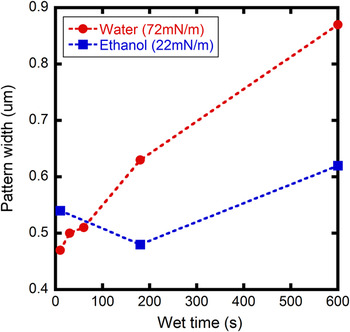
The difference in the micropattern resulting from the use of ethanol [Fig. 4(a)] may be due not only to the low surface tension of ethanol but also because the ethanol droplet evaporates very quickly due to its higher vapor pressure and larger wetted surface area. Even for the water droplet case, the width of the microstrips in the center region of the watermark is wider than that in the boundary area, which may be caused by differences in wetting time. To control the effect of wetting time, instead of using evaporating liquid droplets the CaF2 nanorod films have been dipped into the solution for certain times ranging from 10 s to 10 min and then dried with weak nitrogen blow. Both water and ethanol were used to examine the surface tension effect. The resulting width of the microstrips is plotted in Fig. 6 as a function of wetting time. For ethanol wetting, the microstrip width did not change significantly with wetting time. On the other hand, for water the width increased considerably with wetting time. The difference in microstrip width between water and ethanol is not significant at a short wetting time (1 min). However, it becomes obvious at longer time periods. Higher surface tension and longer wetting time provide wider microstrip widths and better alignment. As demonstrated, the ability to control aligning behavior and microstrip width can be accomplished by changing wetting time and by selecting liquids with different surface tension. Simple and cost-effective self-aligned micro/nanopatterns can potentially be used as templates for superhydrophobic surfaces, tissue scaffolds, microchannels, optical polarizers, etc.
Capillary pressure effect: microstrip width versus wetting time of water/ethanol.

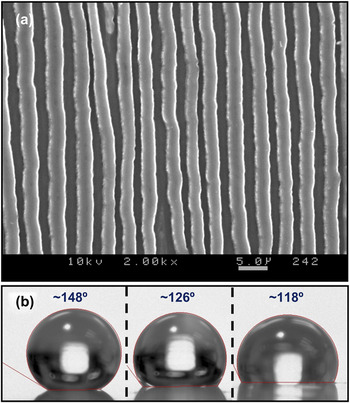
Using this simple and cost-effective self-aligned microstructure as a template, PDMS replicas have been successfully produced by PDMS casting as shown in Fig. 7(a). Because PDMS is a hydrophobic material that has low surface tension ~20 mN/m and high WCA ~118° [right side droplet in Fig. 7(b)], patterned PDMS replicas provide improved hydrophobicity induced by the surface roughness. As shown in Fig. 7(b), two different WCAs have been measured on locations either parallel or perpendicular to the axis of pattern alignment. WCA of the left side droplet ~148° in Fig. 7(b) has been measured from the viewpoint of the parallel axis [i.e., upper/lower side on Fig. 5(a)], whereas the WCA of the center droplet of ~126° has been measured from the viewpoint of the perpendicular axis [i.e., left/right side on Fig. 5(a)]. By simple geometric calculation based on the approximated value of 2-μm microstrip width, 1-μm gap width, and 1-μm nanorod height, its roughness factor on the parallel axis is ~1.7. Using the Wenzel equation, the calculated contact angle is ~143°, which is close to the measured contact angle ~148°. Because the surface roughness can be increased by using a thinner pattern width and the taller nanorods, a superhydrophobic surface with aligned texture can be accomplished.
PDMS cast on CaF2 film: (a) SEM of patterned CaF2 film and PDMS template. (b) Contact angles on different axis of negative PDMS duplicate: parallel view to alignment axis (left), perpendicular view to alignment axis (middle), and on smooth PDMS film (right).

The formation of the microstrips may be related to the interaction of the capillary force with the biaxial structure and placement of the nanorods. However, identifying the specific process by which nanorods are selectively moved to form microstrips perpendicular to the deposition flux direction has been difficult to pinpoint. Interestingly, the geometric relationship between the microstrips and the flux direction is found at all positions of the periphery of the droplet. Therefore, the withdrawal direction of the water as it evaporates does not play a determining role. Finally, the microstrips themselves exhibit an asymmetry in cross section, with only nanorods at the “windward” side of the microstrip are tilted away from the deposition flux. This must be related to the biaxial structure of the nanorods, as the nanorod tip contains a tilted {111} surface.
IV. CONCLUSION
Using capillary pressure of liquids, uniaxially self-aligned microstrip patterns of CaF2 films with nanorod arrays have been demonstrated. This is a simple and cost-effective method to produce aligned micropatterns. Further research will focus on producing improved alignment for use in microfluidic applications and the fabrication of superhydrophobic surfaces by controlling pattern dimensions. The underlying transition mechanism of nanorod-induced microstrips will also be investigated further.
ACKNOWLEDGMENTS
The work is supported in part at Rensselaer by National Science Foundation (NSF) Grant No. 0506738 and at Cincinnati by a Dayton Area Graduate Studies Institute (DAGSI) grant.