1. Motivation and Introduction
Risk aggregation is a popular method used to estimate the sum of a collection of financial assets or events, where each asset or event is modelled as a random variable. Existing techniques make a number of assumptions about these random variables. First, they are almost always continuous. Second, if they are independent then they are identically distributed. Third, should they be dependent, these dependencies are best represented by correlation functions, such as copulas (Nelsen, Reference Nelsen2007; Embrechts, Reference Embrechts2009), where marginal distribution functions are linked by some dependence structure. These statistical methods have tended to model associations between variables as a purely phenomenological artefact extant in historical statistical data. Recent experience, at least since the beginning of the financial crisis in 2007, has amply demonstrated the inability of these assumptions to handle non-linear effects or “shocks” on financial assets and events, resulting in models that are inadequate for prediction, stress testing and model comprehension (Laeven & Valencia, Reference Laeven and Valencia2008; IMF, 2009).
It has been extensively argued that modelling dependence as correlation is insufficient, as it ignores any views that the analyst may, quite properly, hold about those causal influences that help generate and explain the statistical data observed (Meucci, Reference Meucci2008; Rebonato, Reference Rebonato2010). Such causal influences are commonplace and permeate all levels of economic and financial discourse. For example, does a dramatic fall in equity prices cause an increase in equity implied volatilities or is it an increase in implied volatility that causes a fall in equity prices? The answer is trivial in this case, since a fall in equity prices is well known to affect implied volatility, but correlation alone contains no information about the direction of causation. To incorporate causation we need to involve the analyst or expert and “fold into” the model views of how discrete events interact and the effects of this interaction on the aggregation of risk. This approach extends the methodological boundaries last pushed back by the celebrated Black–Litterman model (Black & Litterman, Reference Black and Litterman1991). In that approach a risk manager’s role is as an active participant in the risk modelling, and the role of the model is to accommodate their subjective “views”, expressed as Bayesian priors of expectations and variances of asset returns. In this paper we aim to represent these Bayesian “views” in an explicit causal structure, whilst providing the computational framework for solutions. Such causal models would involve discrete explanatory (regime switching) variables and hybrid mixtures of inter-dependent discrete and continuous variables. A causal risk aggregation model might incorporate expert derived views about macro-economic, behavioural, operational or strategic factors that might influence the assets or events under “normal” or “abnormal” conditions. Applications of the approach include insurance, stress testing, operational risk and sensitivity analysis.
At its heart risk aggregation requires the sum of n random variables. In practice, this involves the use of two well-known mathematical operations: n-fold convolution (for a fixed value of n) and N-fold convolution (Heckman & Meyers, Reference Heckman and Meyers1983), defined as the compound sum of a frequency distribution N, and a severity distribution S, where the number of constant n-fold convolutions is determined by N, stochastically. Currently, popular methods such as Panjer’s recursion (Panjer, Reference Panjer1981), fast Fourier transforms (FFT, Heckman & Meyers, Reference Heckman and Meyers1983) and Monte Carlo (MC) simulation (Fishman, 1996) perform risk aggregation numerically using parameters derived from historical data to estimate the distributions for both S and N. Where S and N are independent and continuous, these approaches produce acceptable results. However, they have not been designed to cope with the new modelling challenges outlined above. In the context of modelling general dependencies among severity variables, a popular approach is to use copulas, both to model the dependent variables and to perform risk aggregation.
Our aim then is to show how we can carry out a stochastic risk aggregation (N-fold convolution) in a causal Bayesian framework, in such a way that subjective views about inter-dependencies can be explicitly modelled and numerically evaluated, i.e., where discrete and continuous variables are inter-dependent and may influence N and S in complex, non-linear ways. We see this as the first of many financial modelling problems that are amenable to this new approach.
This paper describes a Bayesian Factorisation and Elimination (BFE) algorithm that performs convolution on the hybrid models required to aggregate risk in the presence of causal dependencies. This algorithm exploits a number of advances from the field of Bayesian Networks (BNs), covering methods to approximate statistical and conditionally deterministic functions and to factorise multivariate distributions for efficient computation.
Section 2 provides an overview of popular methods for risk aggregation. Section 3 describes BN technology with a view to explaining some of the core foundational algorithms used in this paper. The BFE convolution algorithm is described in section 4, showing how it builds and extends on the standard BN algorithms presented in section 3. Section 5 presents a version of BFE that performs deconvolution and section 6 presents experimental results showing the performance of BFE. Section 7 concludes the paper.
2. Risk Aggregation
An encyclopaedic overview of the current state of the art in risk aggregation is presented in McNeil et al. (Reference McNeil, Frey and Embrechts2010). The general aggregation formula for fixed, n, assets, is:
 $$T=S_{0} {\plus}S_{1} {\plus}\ldots{\plus}S_{n} $$
where T is the sum of n asset valuations and each S i is from the same common continuous distribution f x, which can be thought of as a return (severity) distribution S. This is called an n-fold convolution. If S∼f x and if we have a variable number of assets, N, then equation (1) can be rewritten as an N-fold convolution:
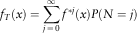 $$f_{T} (x)=\mathop{\sum}\limits_{j\,=\,0}^\infty {f^{{{\asterisk}j}} } (x)P(N=j)$$
where  $$f^{{{\asterisk}j}} \left( x \right)=\mathop{\int}\limits_0^\infty {f^{{{\asterisk}(j{\rm {\minus}1})}} (x{\rm {\minus}}y)f\left( {dy} \right)} $$
is a recursive n-fold convolution on S. We can therefore rewrite equation (2) in a discrete form: P(N=j)=a j, for j=0, 1, …, L, where L is the length of discretised frequency N. The following expressions hold:
 $$P(T)=a_{0} P(T_{0} ){\plus}a_{1} P(T_{1} ){\plus}\ldots{\plus}a_{L} P(T_{L} )$$
 $$T_{0} =S_{0} ,\;T_{1} =S_{0} {\plus}S_{1} \;,\ldots,\;T_{L} =S_{0} {\plus}S_{1} {\plus}\ldots{\plus}S_{L} $$
where each T j is a constant n-fold convolution. The equation (3) represents a mixture distribution where the mixture components consist of mutually exclusive variables, themselves composed using the conditionally deterministic functions stated in equation (4).
For the sake of clarity in insurance, and similar, applications N is interpreted as a frequency distribution and S is defined as a severity (loss) distribution.
General numerical solutions to computing the aggregate distribution include Panjer’s recursion (Panjer, Reference Panjer1981), fast Fourier transform (Heckman & Meyers, Reference Heckman and Meyers1983) and MC simulation (Fishman, 1996).
In this paper severity variables can depend on discrete explanatory variables with dependencies expressed via conditioning in BN. This contrasts with the classic approach for dependency modelling among severity variables using copulas. Rather than use dependency and conditioning the copula approach models the dependency structure independently with marginal functions, which supports the construction of high-dimensional models.
In the context of copula-based risk aggregation Bruneton (Reference Bruneton2011) proposes the use of hierarchical aggregation using copulas. Also, Arbenz & Canestraro (Reference Arbenz and Canestraro2012) proposes hierarchical risk aggregation based on tree dependence modelling using step-wise low-dimensional copulas, and also gives a sample reordering algorithm for numerical approximation. Brechmann (Reference Brechmann2014) suggests hierarchical Kendall copulas to achieve flexible building blocks, where risk aggregation is supported by the Kendall function. These approaches capture the joint dependencies from a hierarchical structure and exploit use of small building blocks. In contrast to correlation modelling, our work assumes causality and dependency, where joint dependency is decomposed by conditional dependencies using the BN framework.
3. BN
3.1. Background
A BN (Pearl, Reference Pearl1993; Lauritzen, 1996; Jensen & Nielsen, Reference Jensen and Nielsen2009) consists of two main elements:
1. Qualitative: This is given by a directed acyclic graph with nodes representing random variables, which can be discrete or continuous, and may or may not be observable, and directed arcs (from parent to child) representing causal or influential relationships between variables.
2. Quantitative: A probability distribution associated with each node X. For a node with parents this is a conditional probability distribution (CPD), P(X | pa(X)) that defines the probabilistic relationship of node given its respective parents pa(X). For each node X without parents, called root nodes, this is their marginal probability distribution P(X). If X is discrete, the CPD can be represented as a node probability table (NPT), P(X | pa(X)), which lists the probability that X takes, on each of its different values, for each combination of values of its parents pa(X). For continuous variables, the CPDs represent conditional probability density functions.
Together, the qualitative and quantitative parts of the BN encode all relevant information contained in a full joint probability model. The conditional independence assertions about the variables, represented by the absence of arcs, allow decomposition of the underlying joint probability distribution as a product of CPDs. Specifically:
 $$P(X_{1} ,\ldots,X_{n} )=\prod {P(} X_{i} \!\mid\!{\rm pa}(X_{i} )$$
This significantly reduces the complexity of inference tasks on the BN (Spiegelhalter & Lauritzen, 1990; Fenton & Neil, Reference Fenton and Neil2012).
BNs have already been employed to address financial problems. For example, in Cowell et al. (Reference Cowell, Verrall and Yoon2007) BNs were used for overall loss distribution and making predictions for insurance; in Neil & Fenton (Reference Neil and Fenton2008) BNs were used for modelling operational risk in financial institutes, while the work in Politou & Giudici (Reference Politou and Giudici2009) combines MC simulation, graphic models and copula functions to build operational risk models for a bank. Likewise, Rebonato (Reference Rebonato2010) discusses a coherent stress testing approach using BNs.
We have chosen to use BNs because the latest algorithms can model causal dependencies between hybrid variables during inference, to produce approximate posterior marginal distributions for the variables of interest. Also, by virtue of Bayes’ theorem they are agnostic about causal direction and can perform inference from cause to effect and vice versa (or convolution to deconvolution, as is the case here). Until very recently BN tools were unable to properly handle non-Gaussian continuous variables, and so such variables had to be discretised manually, with inevitable loss of accuracy. A solution to this problem was described in Neil et al. (Reference Neil, Tailor and Marquez2007) based on an extension of the junction tree (JT) inference algorithm, and is described below in section 3.2. The result of inference is a set of queries on the BN in the form of univariate or multivariate posterior marginal distributions. This allows the approximate solution of classical Bayesian statistical problems, involving continuous variables as well as hybrid problems involving both discrete and continuous variables, without any restriction on distribution family or any requirement for conjugacy. This scheme iteratively converges on the posterior solution and has provided highly efficient solutions in a number of domains (Marquez, Neil, & Fenton, 2010); (Fenton & Neil, Reference Fenton and Neil2012).
Both exact and approximate inference in BNs is NP-hard (Cooper & Herskovits, Reference Cooper and Herskovits1992) and the efficiency of the JT architecture depends on the size of the clusters in the associated tree. To help reduce conditional probability table (CPT) size we employ a factorisation scheme called binary factorisation (BF, described below in section 3.3) to reduce the size and associated computation time required for continuous variables in the model (Neil et al., Reference Neil, Chen and Fenton2012).
We have used AgenaRisk (2014), a commercial BN package and extended it to incorporate the new BFE algorithm to carry out the experiments described in section 4.
3.2. Dynamic discretisation (DD) on hybrid BNs
Static discretisation has historically been used to approximate the domain of the continuous variables in a BN using predefined, fixed piecewise constant partitions. This approximation will be accurate so long as the posterior high-density region remains in the specified domain during inference. However, the analyst will not know, in advance, which areas of the domain require the greater number of intervals, ultimately resulting in an inaccurate posterior estimate. DD is an alternative discretisation approach that searches for the high-density region during inference and adds more intervals where they are needed while removing intervals where they are not (by merging or deletion). The algorithm iteratively discretises the target variables by the convergence of relative entropy error threshold.
Formally, let X be a continuous node in the BN. The range of X is denoted by ΩX and the probability density function of X is denoted by f X. The idea of discretisation is to approximate f X as follows:
1. Partition ΩX into a set of interval ΨX={w j}.
2. Define a locally constant function f x on the partitioning intervals.
We estimate the relative entropy error induced by the discretised function using an upper bound of the Kullback–Leibler (KL) metric between two density functions f and g:
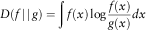 $$D(f\!\mid\,\mid\!g)=\mathop{\int} {f(x)\log {{f(x)} \over {g(x)}}dx} $$
Under the KL metric the optimal value for the discretised function  $\tilde{f}_{x} $
is given by the mean of the function in each of the intervals of the discretised domain. The discretisation task reduces then to finding an optimal partition set
 $\hat{\Psi }_{x} $
.
DD searches ΩX for the most accurate specification of the high-density regions given the model and the evidence, calculating a sequence of discretisation intervals in ΩX iteratively. At each stage in the iterative process, a candidate discretisation, Ψx={w j}, is tested to determine whether the relative entropy error of the resulting discretised probability density  $$\tilde{f}_{X} $$
is below a given threshold, defined according to some stopping rule. After each variable in the model is discretised the inference algorithm, such as JT, calculates the joint posterior distributions for all variables in the model. This gives a new posterior probability density for all variables and these are then re-discretised. This process continues until the stopping rule is triggered.
3.3. BF
The cost of using off-the-shelf BN algorithms to calculate N-fold convolution can be computationally expensive. The conditional probability density expression of node T is defined by all of its parent nodes by equation (1):
 $$T_{n} =S_{0} {\plus}S_{{\rm 1}} {\plus}\,\ldots\,{\plus}S_{n} $$
If each node has a node state of size m and the total number of parents is n, then the CPT for T has a total size of m n+1 given the intervals computed under DD. To help reduce the CPT size we employ BF to factorise the BN graph according to the statistical and deterministic functions declared in it.
To illustrate the BF process, we consider constant n-fold convolution models for both the independent and common cause case, as represented by BNs G1 and G2, respectively, in Figure 1. This is just equation (1).
Bayesian Networks models of N-fold convolution of i.i.d. severity variables (G1) and of common cause version (G2) with accompanying binary factorised versions (G1' and G2').

After employing BF, the BNs G1 and G2 are transformed into G1' and G2', respectively, as shown in Figure 1. In Figure 1G1 shows the N-fold convolution when severities are independent and identically distributed. G2 denotes the N-fold convolution when severities are dependent on a discrete common cause random vector C.
BF ensures that, in the transformed BN, each variable’s NPT expression involves a maximum of two continuous parent variables in the transformed BN. This produces a maximal discretised NPT of size m 3.
Theoretical equivalence of G1 and G1' with the resulting BN models G2 and G2' is demonstrated in Neil et al. (Reference Neil, Chen and Fenton2012).
4. BFE
To solve the N-fold convolution problem using off-the-shelf BN technology is not possible because we cannot compute G1 and G2 effectively from the conditional dependency structures defined in Figure 1. This is because, even with BF, either the model size is prohibitively large (in the case of G1) or the JT cluster sizes would be exponential in size (as with G2). Therefore, the original contribution of this paper is to produce an iterative factorised approach to the computation that scales up to arbitrary sized models. This approach is called Bayesian Factorisation and Elimination. This algorithm performs convolution on the hybrid models required to aggregate risk in the presence (or absence) of causal dependencies. This algorithm exploits a number of advances from the field of BNs already described in section 3. We refer to these advances as the BN engine and they are shown in the overall algorithm architecture in Figure 2.
Architecture of Bayesian Networks algorithms.
The BFE algorithm contains three separate steps, each performing specific optimisations:
1. Log-based aggregation (LBA): This algorithm computes equation (4), the n-fold convolution, in a log-based pattern that can be more efficient than aggregation by straight summation.
2. Variable elimination (VE): Variables are iteratively eliminated during LBA process, by which we can achieve greater computation efficiency for calculating arbitrary constant n-fold convolutions.
3. Compound density factorisation (CDF): The compound sum equation (3) can be factorised by this algorithm in order to reduce large NPTs into smaller ones. CDF is similar to BF except that in CDF we introduce one more intermediate variable (a Boolean node) for weighting the compound density combination at each step in the aggregation process.
4.1. LBA
In equation (3) each T i, i=1,…, n is the sum of its parent variables T i−1 and S i, and the aggregation process simply involves repeated summations of the same variable S i. As BF proceeds intermediate variables F j are created to aggregate every two parents, creating a hierarchy until the total aggregate T is computed. An example, in the presence and absence of common cause vector is shown in Figure 3.
G1 and G2 Bayesian Networks binary factorised for aggregation.
This approach to aggregation is computationally expensive since all the variables are entered and computed in the BN explicitly. LBA simply computes and subsequently reuses prior computed results recursively, so that in each subsequent step we can reuse results from previous steps, without having to create the whole BN. The resulting process is O(log2n).
4.2. VE
The aim of VE is to remove nodes from a BN, G, that do not belong to a query set Q, containing only the variables of interest, by a process of marginalisation. Here we use VE to reduce the number of variables we handle but add additional steps to exploit repeated structure in the BF model. We do not need, therefore, to explicitly manipulate the whole BN, because we are not interested in setting arbitrary query variables or conditioning evidence. Instead, we iterate through the binary factored model, progressively creating subsets of the aggregation hierarchy that can be reused recursively, eliminating nodes and reusing parts as we go.
We first consider a full BF BN and use this to identify variables that can be eliminated and query sets necessary during VE. In the simple case for an n-fold convolution for independent i.i.d. severity variables, the graph G1' in Figure 1 denotes the BF form of the computation of  $T_{n} =\mathop{\sum}\nolimits_{j\,=\,0}^n {S_{j} } $
after introducing the intermediate binary factored variables {T 1,T 2,…,T n−1}. The marginal distribution for T n has the form
 $$\eqalignno{ P(T_{n} )&=\mathop{\sum}\limits_{(S_{0} \ldots,S_{n} ,T_{1} ,\ldots\!,T_{{n{\minus}1}} )} {P(S_{0} ,S_{1} ,\ldots,S_{n} ,T_{1} ,T_{2} ,\ldots\!,T_{{n{\minus}1}} ,T_{n} )} \cr & =\mathop{\sum}\limits_{(S_{0} \ldots,S_{n} ,T_{1} ,\ldots\!,T_{{n{\minus}1}} )} {P(T_{n} \!\mid\!T_{{n{\minus}1}} ,S_{n} )P(T_{{n{\minus}1}} \!\mid\!T_{{n{\minus}2}} ,S_{{n{\minus}1}} )\ldots\!P(T_{1} \!\mid\!S_{0} ,S_{1} )P(S_{0} )P(S_{1} )\ldots\!P(S_{n} )} $$
Exploiting the conditional independence relations in Figure 1.
Notice that every pair of parent variables T i and S i+1 is independent in this model and we can marginalise out each pair of T i and S i+1 from the model separately. Equation (6) can be alternatively expressed as predefined “query blocks”:
 $$P(T_{n} )=\mathop{\sum}\limits_{T_{{n{\minus}1}} ,S_{n} }\!\! {P(T_{n} \!\mid\!T_{{n{\minus}1}} ,S_{n} )} \left\{ {\ldots\left\{ {\mathop{\sum}\limits_{T_{1} ,S_{2} } {P(T_{2} \!\mid\!T_{1} ,S_{2} )\left\{ {\mathop{\sum}\limits_{S_{0} ,S_{1} } {P(T_{1} \!\mid\!S_{0} ,S_{1} )P(S_{0} )P(S_{1} )} \!} \right\}P(S_{2} )} } \!\right\}\ldots\!\!} \right\}P(S_{n} )$$
So, using equation (7) we can recursively marginalise out, i.e., eliminate or prune, each pair of parents T i and S i+1 from the model. For example, the elimination order in equation (7) could be: {S 0, S 1}, {T 1, S 2}…{T n−1, S n}. The marginal distribution of T n, i.e., the final query set, is then yielded at the last elimination step.
In order to illustrate the recursive BN graph operations, required during VE, consider Figure 1 and BN G1. The first few steps involved are shown in Figure 4. At each stage we reuse the same graph structures and expressions for graphs {K 1, K 2, K 3} and {L 1, L 2, L 3}. We can proceed through the BF BN, computing the marginal distributions for the query set, removing elimination sets and repeating the process until we exhaust the variable list.
Variable elimination process applied to part of Bayesian Network G1.
However, in the case where common cause dependencies are present in the BN, as illustrated by G2 in Figure 1, additional care is needed during VE. Here the elimination set does not simply consist of leaf nodes that can be eliminated directly since we have a common parent node C, that we want to preserve in the query set at each step. To help highlight how the VE process operates in the presence of common cause variables consider BN G2' in Figure 1 and compute the posterior marginal distribution for T 2. The marginal distribution for T 2 has the form equation (8):
 $$\eqalignno{ P(T_{2} )&=\mathop{\sum}\limits_{C,S_{0} ,S_{1} ,S_{2} ,T_{1} } {P(T_{2} \!\mid\!T_{1} ,S_{2} )P(T_{1} \!\mid\!S_{0} ,S_{1} )P(S_{0} \!\mid\!C)P(S_{1} \!\mid\!C)P(S_{2} \!\mid\!C)P(C)} \cr & =\mathop{\sum}\limits_{C,S_{2} ,T_{1} } {P(T_{2} \!\mid\!T_{1} ,S_{2} )P(S_{2} \!\mid\!C)P(C)\left\{ {\mathop{\sum}\limits_{S_{0} ,S_{1} } {P(T_{1} \!\mid\!S_{0} ,S_{1} )P(S_{0} \!\mid\!C)P(S_{1} \!\mid\!C)} } \right\}} $$
We first want to eliminate S 0 and S 1 by marginalising them:
 $$P(T_{1} \!\mid\!C)=\mathop{\sum}\limits_{S_{0} ,S_{1} } {P(T_{1} \!\mid\!S_{0} ,S_{1} )P(S_{0} \!\mid\!C)P(S_{2} \!\mid\!C)} $$
The marginal of T 2 can now be expressed along with C, T 1 and S 2 alone:
 $$P(T_{2} )=\mathop{\sum}\limits_{C,S_{2} ,T_{1} } {P(T_{2} \!\mid\!T_{1} ,S_{2} )P(S_{2} \!\mid\!C)P(T_{1} \!\mid\!C)P(C)} $$
Next we eliminate S 2 and T 1:
 $$P(T_{2} \!\mid\!C)=\mathop{\sum}\limits_{T_{1} ,S_{2} } {P(T_{2} \!\mid\!T_{1} ,S_{2} )P(S_{2} \!\mid\!C)P(T_{1} \!\mid\!C)} $$
In general, by VE, we obtain the conditional distribution for each variable T n−1 (the sum of n severity variables) with the form:
 $$P(T_{{n{\minus}1}} \!\mid\!C)=\mathop{\sum}\limits_{T_{{n{\minus}2}} ,S_{{n{\minus}1}} } {P(T_{{n{\minus}1}} \!\mid\!T_{{n{\minus}2}} ,S_{{n{\minus}1}} )P(T_{{n{\minus}2}} \!\mid\!C)P(S_{{n{\minus}1}} \!\mid\!C)} $$
Since equation (11) specifies the conditional distribution for variable T n−1 | C and therefore the posterior marginal distribution for the target n-fold convolution T n−1 the aggregate total is obtained by marginalising out C.
In order to explain the VE algorithm, in terms of graph manipulation, in the common cause case we step through a 3-fold convolution. Figure 5(a) depicts a 3-fold convolution model, BF (from G to G') and then subject to VE, resulting in reduced the BN V. The VE steps are shown in Figure 5(b), which, although operating on subsets of G, result in the same graph, i.e., L 2=V.
(a) Simple common cause model binary factorisation and variable elimination (VE) process. (b) VE process applied to part of Bayesian Network G.
To calculate the arbitrary n-fold convolution in the multiple common cause case it is essential to maintain the structure connecting the common causes in G' in every elimination step so that when variables are eliminated any dependencies on common cause variables are correctly maintained. Consequently, the elimination task involves generating the marginal for variable T j conditional on the set C=C 0, C 1,…, C m. This more general case is shown in Figure 6, with multiple common cause variables C 0, C 1,…, C m, and dependent severity variables S i. The scheme can be generalised to any configuration of common causes.
Multiple common cause model binary factorisation and variable elimination process (transformed graph name shown below each graph).
4.3. CDF
Recall the compound density expression for an N-fold convolution, as given in equation (3), where  $$T_{j} =\mathop{\sum}\nolimits_{i=0}^j {S_{i} } ,j=0\ldotsL\;(length\;of\;N)$$
is an i-fold convolution with S itself and a j=P(N=j) is the weighting assigned to the corresponding T j. Unfortunately, the compound density expression for P(T) is very space inefficient and to address this we need to factorise it. Given each component in the mixture is mutually exclusive, i.e., for a given value of N the aggregate total is equal to 1, and only one T i, variable, this factorisation is straightforward. However, we cannot use a BF for equation (3), therefore we factorise the compound density expression into pairs of “block nodes” and combine each pair incrementally as shown below.
Equation (3) is factorised as shown in Figure 7, where additional Boolean variables E j (with only two states True and False)Footnote 1 are introduced to assign weightings proportional to a j, to each pair of block nodes, i.e., {T 0,T 1}, {F 0,T 2},…, {F j−2, T j}. Factor variables F j are created to calculate the weighted aggregate for each step, up to the length of the N-fold convolution L.
Compound density factorisation.
The NPT for E j−1 is defined by the following:
 $$P(E_{{j{\minus}1}} =True)={{a_{0} {\plus}a_{1} {\plus}\ldots{\plus}a_{{j{\minus}1}} } \over {a_{0} {\plus}a_{1} {\plus}\ldots{\plus}a_{j} }}$$
The conditionally deterministic expression for variable F j−1 (called a partitioned node in BN parlance) is defined by
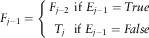 $$F_{{j{\minus}1}} =\left\{ {\matrix{ {F_{{j{\minus}2}} } \cr {T_{j} } \cr } \matrix{ {{\rm if} \ E_{{j{\minus}1}} =True} \cr { {\rm if} \ E_{{j{\minus}1}} =False} \cr } } \right.$$
Since T 0 and T 1 are mutually exclusive, the marginal distribution for variable F 0 is:
 $$F_{0} =P(E_{0} =True)P(T_{0} ){\plus}P(E_{0} =False)P(T_{1} )=a_{0} P(T_{0} ){\plus}a_{1} P(T_{1} )$$
which is identical to the first two terms in the original compound density expression (equation (3)). Similarly, the marginal for variable F j becomes:
 $$F_{{j{\minus}1}} =P(E_{{j{\minus}1}} =True)P(F_{{j{\minus}2}} ){\plus}P(E_{{j{\minus}1}} =False)P(T_{j} )$$
After applying the CDF method to equation (3) we have the marginal for F j−1, as shown by (14), which yields the compound density, P(T), for the N-fold convolution. Therefore, by using the CDF method we can compute the compound density (equation (3)) more efficiently.
The CDF method is a general way of factorising a compound density. It takes as input any n-fold convolution, regardless of the causal structure governing the severity variables. Note that the CDF method can be made more efficient by applying VE to remove leaf nodes. Likewise, we can execute the algorithm recursively reuse the same BN fragment P(F | F, T, E).
4.4. The BFE convolution algorithm
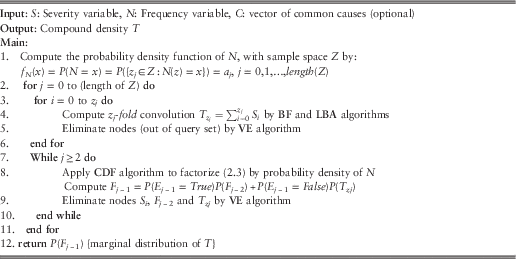
The BFE convolution algorithm is formalised, as pseudo code, in Table 1.
Bayesian Factorisation and Elimination convolution algorithm.
5. Deconvolution using the BFE Algorithm
5.1. Deconvolution
Where we are interested in the posterior marginal distribution of the causal variables conditional on the convolution aggregated results we can perform deconvolution, in effect reversing the direction of inference involved in convolution. This is of interest in sensitivity analysis, where we might be interested in identifying which causal variables have the largest, differential, impact on some summary statistic of the aggregated total, such as the mean loss or the conditional value at risk, derived from P(C | T>t 0).
One established solution for deconvolution involves inverse filtering using Fourier transforms, whereby the severity S is obtained by inverse transformation from its characteristic function. Alternative analytical estimation methods, i.e., maximum likelihood and numerical evaluation involving Fourier transforms or simulation-based sampling methods, can be attempted but none of them is known to have been applied to N-fold deconvolution in hybrid models containing discrete causal variables.
BN-based inference offers an alternative, natural, way of solving deconvolution because it offers both predictive (cause to consequence) reasoning and diagnostic (consequence to cause) reasoning. This process of backwards inference is called “back propagation”, whereby evidence is entered into the BN on a consequence node and then the model is updated to determine the posterior probabilities of all parent and antecedent variables in the model. A “backwards” version of the BFE algorithm offers a solution for answering deconvolution problems in a general way without making any assumptions about the form of the density function of S. The approach again uses a discretised form for all continuous variables in the hybrid BN, thus ensuring that the frequency distribution N is identifiable.
Example 1 Consider a simple BN with parent variable distributions X∼Normal (μ=5, σ 2=5), Y∼Normal (μ=10, σ 2=10) and likelihood function for a child variable P(Z | X,Y)=P(Z=X+Y). Figure 8(a) shows the prior convolution effects of the back propagation calculation, as marginal distributions superimposed on the BN graph. The exact posterior marginal for Z is Z∼Normal (μ=15, σ 2=15). Our approximation produces a mean of 14.99 and variance 16.28.
(a) Convolution and (b) deconvolution.
If we set an observation Z=z 0 and perform inference we obtain the posterior marginal of X by Bayes’ rule:
 $$P(X\!\mid\!Z=z_{0} )={{P(X,Z=z_{0} )} \over {P(Z=z_{0} )}}={{\mathop{\sum}\limits_Y {P(Z=z_{0} \!\mid\!X,Y)P(X)P(Y)} } \over {\mathop{\sum}\limits_{X,Y} {P(Z=z_{0} \!\mid\!X,Y)P(X)P(Y)} }}$$
Where our likelihood P(Z | X,Y) is a convolution function, equation (15) defines the deconvolution and yields the posterior marginal distribution of X given observation Z=z 0. In Figure 8(b), the observation is Z=30 (which is approximated as a discrete bin of given width), and the posterior for X has updated to a marginal distribution with mean 9.97 and variance 3.477.
In the example shown in Figure 8 the parent variables X and Y are conditionally dependent given the observation Z=z 0. For n-fold convolution with or without common causes an observation on the T i variables would also make each of the severity variables dependent and we can perform n-fold deconvolution using the DD and JT alone for small models containing non i.i.d severity variables with query block sizes of maximum cardinality four. For large models, containing i.i.d severity variables BFE provides a correct solution with minimal computational overhead.
We have already noted that during N-fold convolution the T i variables are mutually exclusive, such that for a given N=i, if the variable T i exists, then the other variables do not. This fact can be exploited during factorisation during the deconvolution processes.
Consider the common cause BN model shown in Figure 9. The fully specified model is shown in BN graph A. The posterior distributions for all nodes can be computed by way of the BFE convolution algorithm and we can cache any distributions and parameters we might need during this process, for subsequent use during deconvolution. The BFE deconvolution algorithm then proceeds by eliminating all intermediate, frequency and severity variables until we get the reduced BN graph containing the final query set of interest.
Binary factored common cause N-fold Bayesian Network, A, reduced by applying the variable elimination algorithm to G and then G'.
Let us assume the model structure in BN A of Figure 9. Here frequency N is discretised into three finite states {1, 2, 3}, so there are three n-fold convolution variables  $$T_{i} =\mathop{\sum}\nolimits_{j=0}^i {S_{j} } ,i=0,1,2$$
each corresponding to the sum of one, two and three severity variables. T is the compound distribution defined by:
 $$T=a_{0} P(T_{0} ){\plus}a_{1} P(T{}_{1}){\plus}a_{2} P(T_{2} ),a_{i} =P(N=i),i=0,1,2$$
Given evidence T=t 0 the deconvolution of C is achieved by:
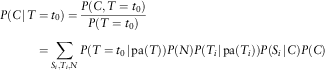 $$\eqalignno{ P(C\!\mid\!T& =t_{0} )={{P(C,T=t_{0} )} \over {P(T=t_{0} )}} \cr & =\mathop{\sum}\limits_{S_{i} ,T_{i} ,N} {P(T=t_{0} \!\mid\!{\rm pa}(T))P(N)P(T_{i} \!\mid\!{\rm pa}(T_{i} ))P(S_{i} \!\mid\!C)P(C)} $$
where pa(T) denotes the parents of T. So, once the convolution model has eliminated all irrelevant variables, in this case S i, T zj, E j, F j we would be left with the query set, which here is Q={C,T}.
5.2. Reconstructing the frequency variables during deconvolution
If we are also interested in including the frequency variable N in our query set we must be careful to cache variables E j, F j−2 and T zj during convolution. Recall that the prior distribution for N was decomposed into the E j during CDF, therefore we need some way of updating this prior using the new posterior probabilities generated on the Boolean variables E j during deconvolution. To perform deconvolution on N it is first necessarily to reconstruct N from the E j variables that together composed the original N.
Reconstruction involves composing all Boolean variables E j into the frequency variable N, in a way that the updating of E j can directly result in generating a new posterior distribution of N. The model is established by connecting all E j nodes to N, where the new NPT for N has the form of combining all its parents. However, it turns out this NPT is exponential (2j+1) in size. To avoid the drawback we use an alternative, factorised, approach that can reconstruct the NPT incrementally.
As before, we reconstruct N using BF where the conditioning is conducted efficiently using incremental steps. Here the intermediate variables produced during BF N k (k=0,…, j−1) are created efficiently by ensuring their NPTs are of minimal size.
The routine for constructing the NPTs for N k (k=0,…, j−1) from the E j’s is:
1. Order parents E j and E j−1 from higher index to lower index for N k’s NPT (since E j is Boolean variable with only two states, one concatenating all E j−1’s states and another state is single state that E j−1 does not contain. In this example E 1 should be placed on top of E 0 in the NPT table, as it is easier for comparing the common sets).
2. As we have already generated the NPT map of E j, E j−1 and N k. Next, we specify the NPT entry with unit value (“1”) at N k=τ, when E j and E j−1 has common sets τ (in this example, E 1 and E 0 have common sets τ=“0” and τ=“1”).
3. Specify NPT entry with value (“1”) at N k=τ, when E j and E j−1 have no common sets and E j=τ (E j has one state τ that E j−1 does not contain, so under this case N k only needs to be consistent with E j as the changes on E j−1 would not affect the probability P(N k=τ), in this example it is when E 1=τ=“2”).
4. Specify NPT entry with value (“0”) at all other entries.
We repeat this routine for all N k (k=0,…, j−1) until we have exhausted all E j’s, producing a fully reconstructed N. Once we have built the reconstructed structure (N k) for N, in fact the updates of E j’s probabilities are directly mapped to N k, and so deconvolution of N is retrieved.
5.3. The BFE deconvolution algorithm with examples
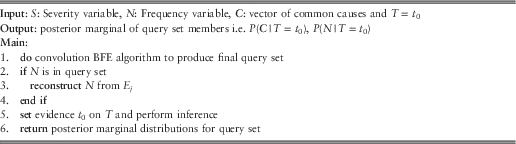
The BFE deconvolution algorithm for N-fold deconvolution is formalised as pseudo code in Table 2.
Example 2 Consider a simplified example for deconvoluting N, suppose frequency distribution N is discretised as {0.1, 0.2, 0.3, 0.4} with discrete states {0, 1, 2, 3} and S∼Exponential(1). Figure 10(a) shows these incremental steps for example 4. In this example there are three parents (E 0, E 1, E 2) to N. The incremental composition steps of E j have introduced two intermediate variables N 0 and N 1, and we expect the frequency N to be reconstructed at the end of the incremental step, which is variable N 1. Key to this process is how to build the NPT for each N k.
(a) Reconstruct N and (b) deconvoluting N.
Bayesian Factorisation and Elimination deconvolution algorithm.
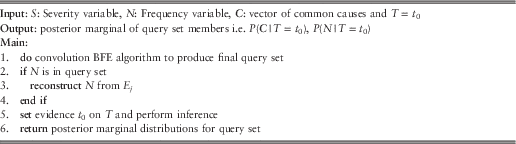
Table 3 illustrates the NPT of N 0, where it composes E 0 and E 1 successively, in such a way that each N k contains all and only its parents’ discrete states. So N 0 has the discrete distribution on “0”, “1” and “2”.
The node probability table of N 0.

Figure 10(b) shows the deconvolution of N by our reconstruction process. The reconstructed prior distribution of N 1 is identical to node “original N” (shown in Figure 10(a)) as we expected. After setting an observation value “0” at the compound sum variable F 2 we have queried that the posterior of N is 99.7% probability at state “0”, since at state zero it has all possibility of generating a zero compound sum at F 2.
The reconstruction theme is applicable to cases that N has discrete parent cause variables as well, where E j’s NPTs are generated directly from N’s parents, and the deconvolution is performed by BFE deconvolution algorithm. Experiment 3 in section 6 considers deconvoluting common cause variables where the model has this form.
6. Experiments
We report on a number of experiments using the BFE algorithm in order to determine whether it can be applied to a spectrum of risk aggregation problem archetypes. Where possible the results are compared to analytical results, FFT, Panjer’s approach and MC simulation. The following experiments, with accompanying rationale, were carried out:
1. Experiment 1: Convolution with multimodal (mixtures of) severity distribution. We believe this to be a particularly difficult case for those methods that are more reliant on particular analytical assumptions. Practically, multimodal distributions are of interest in cases where we might have extreme outcomes, such as sharp regime shifts in asset valuations.
2. Experiment 2: Convolution with discrete common causes variables. This is the key experiment in the paper since these causes will be co-dependent and the severity distribution will depend on their values (and hence will be a conditional mixture).
3. Experiment 3: Deconvolution with discrete common causes. This is the inverse of experiment 2 where we seek to estimate the posterior marginal for the common causes conditioned on some observed total aggregated value.
The computing environment settings for the experiments are as follows. Operation system: Windows XP Professional, Intel i5 @ 3.30 GHz, 4.0 GB RAM. AgenaRisk was used to implement the BFE algorithm, which was written in java, where typically the DD settings were for 65 iterations for severity variables and 25 iterations for the frequency variable. A sample size of 2.0E+5 was used as the settings in R (2013) for the MC simulation.
6.1. Experiment 1: convolution with multimodal severity distribution
Here we set the event frequency as N∼Poisson(50) but the severity distribution is a mixture distribution, S∼f S:
 $$f_{S} =(0.2){\rm Gamma}(5,\;1.5){\plus}(0.3){\rm Normal}(25,\;2){\plus}(0.4){\rm Normal}(50,\;3){\plus}(0.1){\rm Gamma}(100,\;2)$$
In a hybrid BN a mixture distribution is modelled by conditioning the severity variable on one or more partitioning discrete variables C. Assuming that severity variables S j are i.i.d. we can calculate the compound density using BFE.
The characteristic function of a mixture distribution is inconvenient to define (with continuous and discrete components). The analytical and programming effort needed to solve each multimodal severity distribution for Panjer is high, so here we compare with MC only. (Table 4).
Results of convolution with multimodal severity distribution.

MC, Monte Carlo; BFE, Bayesian Factorisation and Elimination.
The corresponding marginal distribution for the query node set {T, N, S} is shown in Figure 11.
Marginal distributions for overlaid on Bayesian Network graph containing query nodes for Experiment 1.
6.2. Experiment 2: convolution with discrete common causes variables
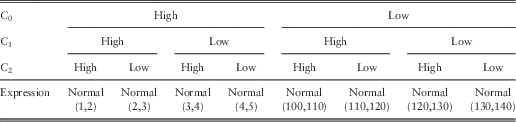
Loss distributions from operational risk can vary in different circumstances, e.g., exhibiting co-dependences among causes. Suppose in some cases that losses are caused by daily operations and these losses are drawn from a mixture of truncated Normal distributions, whereas extreme or some unexpected losses are distributed in a more severe distribution. We model this behaviour by a hierarchical common cause combination C 0,…, C 4.
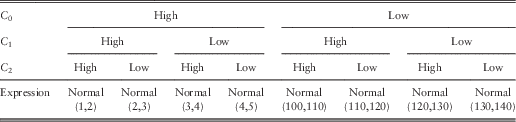
The severity variable S is conditioning on common cause variable, C 0, C 1, C 2. And these common cause variables are conditioned on higher common causes C 3 and C 4. Severity NPT is shown in Table 5. The frequency distribution of losses is modelled as N∼Poisson(50).
Severity node probability table.
In Figure 12(a) the model severities with dependencies by common cause variables C 0,…, C 4 is introduced. Figure 12(b) depicts a 16-fold convolution of dependent severities using the VE method. For any given frequency distribution N we can apply the BFE convolution algorithm to calculate the common cause N-fold convolution.
(a) Common cause-dependent severity; (b) 16-fold convolution of dependent severity.
Figure 13 illustrates the output compound densities for the compared algorithms. Table 6 shows that results for the two approaches are almost identical on summary statistics except the small difference on standard deviation. BFE has offered a unified approach to construct and compute such a model conveniently.
Compound densities (a) Monte Carlo; (b) Bayesian Factorisation and Elimination.
Common cause N-fold convolution density.

MC, Monte Carlo; BFE, Bayesian Factorisation and Elimination.
6.3. Experiment 3: deconvolution with discrete common causes variables
We reuse the convolution model from experiment 2 as the input model for deconvolution (Figure 14).
(a) Common cause N-fold convolution using Bayesian Factorisation and Elimination algorithm. (b) N-fold model deconvolution using BFE algorithm. (The intermediate variables in this example are shown for reference despite them being eliminated during the convolution process).
Figure 14(b) sets an observation on total aggregation node AggS_N. After performing deconvolution we queried the posterior marginal of common causes and diagnose that the most likely common cause is C 0, which is in its “Low” state with certainty. This is easily explained by the fact that from the severity NPT, shown in Table 5, it is only when state of C 0 is “Low” that a value of 6,000 can be at all probable. This deconvolution is currently only supported by BEF since the information cannot be back retrieved by other approaches.
Deconvolution is obviously useful in carrying out a sensitivity of the model results, allowing the analyst to quickly check model assumptions and identify which causal factors have the largest consequential effect on the result. This is difficult to do manually or informally in the presence of non-linear interactions. Also, without “backwards” deconvolution we can only compute such sensitivities “forwards” one casual variable at a time and this is computationally much more expensive. For example, the forwards calculation of T from ten Boolean common cause variables would require 210 calculations versus 40 in the backwards case (assuming T was discretised into 40 states).
7. Conclusion and Future Work
This paper has reviewed historical, popular, methods for performing risk aggregation and compared them with a new method called Bayesian Factorisation and Elimination. The method exploits a number of advances from the field of Bayesian Networks, covering methods to approximate statistical and conditionally deterministic functions and to factorise multivariate distributions for efficient computation. Our objective for BFE was for it to perform aggregation for classes of problems that the existing methods cannot solve (namely hybrid situations involving common causes) while performing at least as well on conventional aggregation problems. Our experiments show that our objectives were achieved. For more difficult hybrid problems the experimental results show that BFE provides a more general solution that is not possible with the previous methods.
In addition, the BFE approach can be easily extended to perform deconvolution for the purposes of stress testing and sensitivity analysis in a way that competing methods cannot currently offer. The BFE deconvolution method reported here provides a low-resolution result, which is likely good enough for the purposes of model checking and sensitivity analysis. However, we are investigating an alternative high-resolution approach whereby variables are discretised efficiently during the deconvolution process, thus providing more accurate posterior results.
Ongoing and future research is also focused on more complex situations involving both copulas and common cause variables. The challenge here is to decompose these models into lower-dimensional joint distributions, where complexity can be further reduced by factorisation. One final area of interest includes optimisation of the results such that we might choose set of actions in the model that maximise returns for minimum risk: we see deconvolution playing a strong role here.
Acknowledgements
We are grateful to the editor as well as the anonymous reviewers for comments and suggestions on the paper.