



Introduction
Large radio telescopes, such as the Green Bank Telescope [Reference Prestage, Constantikes, Hunter, King, Lacasse, Lockman and Norrod1], and the Five-hundred-meter Aperture Spherical radio Telescope [Reference Nan2], are built to help observe the universe, explore other intelligent civilizations and search for the origin of life, playing an important role in astronomy [Reference Brown and Lovell3–Reference Domcke and Garcia-Cely6]. In practice, the observing efficiency of large radio telescopes is closely related to the surface deformation of the main reflector [Reference Ruze7]. However, many factors, such as the enormous weight of the main reflector, wind, and temperature changes, can cause unknown surface distortions. Therefore, it is important to accurately measure and adjust the surface distortion.
The photogrammetric method [Reference Goldsmith8, Reference Subrahmanyan9] and the laser tracking method [Reference Gale10] are first used to perform non-contact measurements for large reflector antennas. With the advantage of high precision and high automation, radio holography is increasingly used to perform surface recovery [Reference Morris11–Reference Räisänen and Ala-Laurinaho18]. By introducing an additional reference antenna, the unknown surface distortion can be accurately reconstructed based on the holographic principle. However, the equipment cost is greatly increased and accurate calibration is required. In addition, it is difficult to accurately obtain the high-frequency scattering field, and these interferometry-based methods are sensitive to noise, which easily leads to poor surface retrieval. Therefore, a non-interferometric method is a promising alternative to achieve surface recovery.
For non-interferometric methods, the key is to propose an accurate forward propagation model and develop the corresponding reconstruction algorithm. The propagation of the microwave signal in a large radio telescope can be accurately described by Maxwell’s equations. To simplify the calculation, Baars et al. proposed the Fresnel approximation and the Fraunhofer approximation [Reference Baars, Lucas, Mangum and Lopez-Perez19], corresponding to the near-field and the far-field propagation models, respectively. However, the reconstruction is a non-convex and ill-posed inverse problem. Alternative projection algorithms [Reference Gerchberg20–Reference Junkin24], such as the well-known Gerchberg–Saxton (GS) algorithm, are proposed to solve this optimization problem. Due to the intensity-only (non-convex) constraints, it is easy for the iteration to stagnate around the local minimum, and the convergence is slow. Recently, based on the geometric optics and the law of conservation of energy, Huang et al. proposed a linear propagation model [Reference Huang, Jin, Ye and Meng25] and developed the corresponding deconvolution algorithm (namely the Huang algorithm). However, its limitation is that certain reconstruction errors also result from the linear approximation. Overall, the above traditional methods are physical-model-driven (i.e., based on a physical propagation model), and it is difficult to achieve a proper trade-off between reconstruction accuracy and reconstruction speed.
In optical imaging, the neural network has been introduced to retrieve the phase at the aperture plane based on a single near-field or far-field intensity measurement [Reference Barbastathis, Ozcan and Situ26, Reference Tong, Ye, Xiao and Meng27]. To the best of our knowledge, deep learning is first introduced by Xu et al. [Reference Xu, Wu, Ye and Chen28] to solve the inverse scattering problem in antennas. Compared with traditional methods, this is a data-driven approach, and the inverse mapping relationship is built directly by deep learning without the need to build a physical propagation model. In addition, the reconstruction can be accurate and fast. However, its weakness is that it requires a huge amount of training data, which is a major barrier to its practical application.
In this work, recurrent neural network (RNN) and convolutional neural network (CNN) are combined to establish the inverse mapping relationship between the intensity measurements and the surface deformation. To solve the problem of training data, an accurate physical propagation model is used to generate the data for pre-training. Then, the pre-trained RCNN model is improved and adapted by transfer learning, and finally, an accurate inverse mapping relationship is established.
Methods and materials
An approximate propagation model
For surface recovery of the main reflector in a large radio telescope, the propagation of the microwave signal can be divided into two stages, as shown in Fig. 1(a). In the first stage, the microwave signal originally emitted by the feed is reflected by the main reflector and then propagates to the aperture plane. This process can be approximated using ray propagation based on geometric optics. Theoretically, if the main reflector has no surface distortion (i.e., an ideal paraboloid), the complex wave field at the aperture plane should be a plane wave with equal phase. However, due to manufacturing errors and other factors, such as the gravity of the main reflector, wind, and temperature changes, there is usually some unknown distortion  $\delta (x,y)$ on the main reflector, where (x, y) is the local transverse coordinate of the main reflector. Thus, the phase contrast
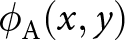 $\phi_{\mathrm{A}}(x,y)$ (or wavefront in adaptive optics) can be found at the aperture plane. Based on ray propagation, the mapping relationship between
 $\delta (x,y)$ and
 $\phi_{\mathrm{A}}(x,y)$ can be simplified as:
Schematic diagram of the proposed method. (a) Microwave propagation in a large radio telescope. (b) Point-by-point scanning intensity measurement by a UAV. (c) Deep learning-based surface reconstruction framework.

 \begin{equation}
\phi_{\mathrm{A}}(x,y)
=
\frac{4\pi}{\lambda}
\sqrt{\frac{4f^2}{x^2 + y^2 + 4f^2} }
\cdot
\delta (x,y),
\end{equation}
where λ is the wavelength of the microwave signal, f is the focal length of the main reflector, and the derivation of Eq. (1) is illustrated in Supplemental Document.
In the second stage, the microwave signal propagates from the aperture plane to a near-field plane that can be described by the Fresnel approximation,
 \begin{equation}
\begin{aligned}
\sqrt{I_{\mathrm{N}}(x,y)} \cdot \exp \big(\mathrm{i} \cdot \phi_{\mathrm{N}}(x,y) \big)& =
\mathcal{P}_{\Delta z} \big\{ \sqrt{I_{\mathrm{A}}(x,y)}\\ \quad &\cdot \exp
\big(\mathrm{i} \cdot \phi_{\mathrm{A}}(x,y) \big)\big\},
\end{aligned}
\end{equation}
where  $I_{\mathrm{N}}(x,y)$ and
 $\phi_{\mathrm{N}}(x,y)$ are the intensity and phase of the wavefield at the near-field plane, respectively,
 $I_{\mathrm{A}}(x,y)$ is the intensity of the wavefield at the aperture plane,
 $\mathcal{P}_{\Delta z}\{\cdot \}$ is the propagation operator by an axial distance
 $\Delta z$, and this operator can be calculated using the angular spectrum theory, i.e.,
 $\mathcal{P}_{\Delta z}\{\cdot \} = \mathcal{F}^{-1} \{\exp(\mathrm{i} \cdot \sqrt{(2\pi/\lambda)^2 - k^2_x - k^2_y}) \cdot \mathcal{F} \{\cdot \} \}$, where
 $\mathcal{F} \{\cdot \}$ and
 $\mathcal{F}^{-1} \{\cdot \}$ denote the Fourier transform (FT) and the inverse FT, kx and ky denote the transverse coordinate in the frequency domain, respectively. However, only the intensity of the wavefield can be detected, as shown in Fig. 1(b), and the phase information is lost. Therefore, it is difficult to deterministically reconstruct the distortion of the main reflector.
This approximate propagation model is used to generate a large amount of training data. Then, in the pre-training process, the corresponding approximate inverse mapping relationship can be priorly learned by the RCNN model. It should be noted that this approximate propagation model has the following approximations:
• In practice, the microwave signal emitted from the feed is designed as a Gaussian beam instead of an ideal point source;
• The forward propagation of the wavefield in the first stage is approximately described by ray propagation, ignoring diffraction effects such as scattering, interference, etc.;
• For the wavefield at the aperture plane, only the phase part is considered to be affected and the amplitude part remains unchanged;
• In the second stage, the propagation is modeled by the Fresnel approximation, which includes the paraxial approximation.
The recurrent convolutional neural network
Inspired by the study in volumetric fluorescence microscopy proposed by Huang et al. [Reference Huang, Chen, Luo, Rivenson and Ozcan29], this work is based on the RCNN to establish the complex mapping relationship between the surface deformation of the main reflector and the intensity at the aperture plane and that at the near-field plane, as presented in Fig. 1(c). On the one hand, CNN has been proven to successfully solve the image reconstruction problems in medical imaging, and computational imaging [Reference Barbastathis, Ozcan and Situ26, Reference Tong, Ye, Xiao and Meng27, Reference Greenspan, Van Ginneken and Summers30, Reference Suzuki31]. In this work, the intensity measurements (network input) and the surface deformation (network output) are all images, and the inverse mapping relationship between them is to be built via CNN. On the other hand, the RNN framework, such as Long Short-Term Memory (LSTM) or Gated Recurrent Units (GRU) [Reference Mikolov, Karafiát, Burget, Cernocký and Khudanpur32–Reference Dey and Salem34], is proposed to deal with the prediction problems with temporal series input. In this work, spatial causality rather than temporal causality exists between the multi-channel network input and the network output. Therefore, RNN is extended to explore the relationship between these spatial sequence signals. Overall, RCNN is theoretically well suited to solve this inverse problem.
Figure 2 illustrates the RCNN architecture. It has a two-channel input, consisting of the intensity at the aperture plane and that at a near-field plane, and the output is the predicted surface deformation. The main body of the RCNN model adopts the U-Net encoder-decoder framework, and the recurrent connection is arranged between the two feature maps (corresponding to the two-channel input) at each layer in the encoder parts. Since the network has only two-channel input, the recurrent connection is realized by the element-wise addition. For those networks with multi-channel input, a GRU or LSTM connection is recommended. In the encoder parts, the inter-layer propagation of the 2-channel input can be described by the following formula:
The workflow diagram of surface reconstruction using the RCNN model, including the network input, the network output, and the detailed architecture of the RCNN model.

 \begin{equation}
\begin{aligned}
x^1_k ={} \mathrm{Selu} \Big\{ \mathrm{BN} \Big[ \mathrm{Conv}_{s=2} \big(
\mathrm{Selu} \big\{ \mathrm{BN} \big[ \mathrm{Conv}_{s=1} ( x^1_{k-1} ) \big] \big\} \big) \Big] \Big\},
\end{aligned}
\end{equation}
 \begin{align}
\begin{aligned}
x^2_k
={}
\mathrm{Selu}
\Big\{
\mathrm{BN}
\Big[
\mathrm{Conv}_{s=2}
\big(
\mathrm{Selu}
\big\{
\mathrm{BN}
\big[
\mathrm{Conv}_{s=1}
(
x^1_{k-1} + x^2_{k-1}
)
\big]
\big\}
\big)
\Big]
\Big\},
\end{aligned}
\end{align}
where Selu $\{\cdot\}$ is the Scaled Exponential Linear Units activation function, BN
 $[ \cdot ]$ represents batch-normalization, and Conv
 $(\cdot)$ represents convolutional layers with parameter slide s equal to 1 or 2. In the decoder parts, the inter-layer propagation can be described as:
 \begin{align}
\begin{aligned}
y_k
={}
\mathrm{Selu}
\Big\{
\mathrm{BN}
\Big[
\mathrm{Conv}_{s=1}
\big(
\mathrm{Selu}
\big\{
\mathrm{BN}
\big[
\mathrm{Conv}_{s=1}
\big(
\mathrm{UpS}
(
y_{k-1}
)
\big)
\big]
\big\}
\big)
\Big]
\Big\},
\end{aligned}
\end{align}
where UpS $( \cdot )$ represents up-sampling, which is realized by an interpolation operation.
Transfer learning
For the practical application of deep learning, one of the biggest barriers is obtaining massive experimental data to effectively perform supervised learning. The same problem exists in this work. Due to the point-by-point scanning method, the intensity collection is critically time-consuming. Therefore, transfer learning is introduced to solve this problem. Based on the approximate propagation model proposed in section “An approximate propagation model”, the corresponding approximate inverse mapping relationship can be learned in advance by the RCNN model through pre-training. Then, the RCNN model is adjusted by transfer learning using experimental data, and finally, a more accurate inverse mapping relationship is established.
In this work, the experimental data for transfer learning are replaced by data generated by a commercial software package, GRASP Ticra 9.0, including the intensity at the aperture plane and the intensity at a near-field plane. In this software, the propagation of the wavefield in a large radio telescope is described by Maxwell’s equations, without any approximation about the total propagation process. Advanced algorithms are specially studied for the inverse scattering problems in a large antenna reflector, providing reliable results for the near-field and far-field calculations [Reference Schmidt, Geise, Migl, Steiner and Viskum35–Reference Chahat, Hodges, Sauder, Thomson and Rahmat-Samii38]. Overall, the forward propagation model built by GRASP Ticra 9.0 is more accurate compared to the approximate propagation model. Therefore, the effectiveness of transfer learning can be validated using the data generated by GRASP Ticra 9.0.
Data preparation and model training
For the RCNN model, the two-channel input is the intensity at the aperture plane and that at the near-field plane, and the output is the surface deformation. These three spatial sequence signals form one set of training data. The parameters involved in the forward propagation model are listed in Table 1.
Parameters involved in the propagation of the microwave signal

The surface deformation and the intensity measurements both adopt 256 × 256-pixel images. The corresponding distance between adjacent nodes can be calculated as  $0.43 \, \mathrm{m}$. This dimension matches the spacing of adjacent actuators under the main reflector panels (
 $0.3\sim0.7\, \mathrm{m}$). Therefore, it is convenient for the actuators to adjust the main reflector surface according to the predicted distortion.
Then, since the main reflector panels are manufactured and installed with high precision, it is assumed that there are no severe deformations between adjacent nodes. That is, smooth and continuous surface deformations are simulated and studied in this work. The range of the surface deformation is set to be  $[0, \, \lambda/5]$. The surface deformations are first generated by pseudo-random distribution, and then smoothed by Gaussian filtering. This procedure generates the surface deformations for both pre-training and transfer learning. However, it should be noted that different surface deformations are used for pre-training and transfer learning, respectively.
Intensity images used for pre-training
The intensity at the aperture plane under a given surface deformation adopts the counterpart with an ideal main reflector, i.e.,  $I_{\mathrm{A}}(x,y)\big|_{\delta(x,y)} = I_{\mathrm{A}}(x,y)\big|_{\delta(x,y) = 0}$ (3rd assumption in section “An approximate propagation model”). Next, the intensity at the near-field plane is calculated using Eqs. (1) and (2). The computation time for a single intensity image is about
 $0.19 \, \mathrm{s}$. A total of 24,000 image sets are generated for pre-training. Specifically, 20,000 sets are used as the training dataset, 2000 sets are used as the validation dataset, and the remaining 2000 sets are used as the test dataset.
Intensity images used for transfer learning
The intensity at the aperture plane and the intensity at a near-field plane are calculated using GRASP Ticra 9.0. The Gaussian beam is used as the source and the solver is set to Physical Optics Model and Physical Theory of Diffraction (PO/PTD). The computation time for one image set is  $6.33 \, \mathrm{h}$, and six sets can be calculated in parallel on a workstation computer with a 12-core CPU. A total of 900 image sets are generated for transfer learning, where 700 sets are used as the training dataset, 100 sets are used as the validation dataset, and the remaining 100 sets are used as the test dataset.
The Baidu PaddlePaddle backend framework is adopted to build the RCNN model. The L2 loss function is used, and it is optimized using the Adam optimizer with an initial learning rate of 0.001. The RCNN model is trained on a Baidu cloud computing platform equipped with a 32GB CPU and a Tesla V100 16GB graphics card.
Results
To ensure the performance of a large radio telescope, the Root Mean Square (RMS) error for the surface deformation should be less than  $\lambda /20 \sim \lambda/60$ [Reference Jenkins, Kalanovic, Padmanabhan and Faisal39–Reference San, Yang and Yin41]. Here, the accuracy criterion for the surface recovery is set to
 $\mathrm{RMS} \lt \lambda /120$ in order to successfully perform the subsequent adjustment using actuators. In addition, the structural similarity index (SSIM) is also used to provide a more comprehensive evaluation of the image reconstruction problem.
The pre-training
First, the RCNN model is pre-trained with the data generated by the approximate propagation model. The pre-training converges in about 40 epochs, and it takes  $27.49 \, \mathrm{h}$. The RCNN model is well fitted during the pre-training process, with the loss function over the training dataset and that over the validation dataset decreasing rapidly and simultaneously, as shown in Fig. 3(a). As for the reconstruction performance over the test dataset, the corresponding RMS errors can be seen in Fig. 3(b). The prediction for a single surface deformation takes
 $0.85 \, \mathrm{s}$. The proportion that the surface recovery meets the accuracy requirement (i.e.,
 $\mathrm{RMS} \lt \lambda /120$) over the test dataset is more than 99.9%, indicating that the inverse mapping relationship (corresponding to the approximate propagation model) can be well established by pre-training. Some reconstructed surface deformations are shown in Fig. 3(c). The first and second rows are the ground truth surface deformations and the reconstructed ones, respectively, and good agreement between them is shown. Furthermore, their horizontal and vertical section profiles are presented in Fig. 3(d). It is clear that quantitative reconstructions can be achieved by the RCNN model for the approximate propagation model.
The performance of the RCNN model in the pre-training process. (a) Loss functions over the training dataset and the validation dataset. (b) Histogram of the RMS errors of the reconstruction over the test dataset, where the red line represents the accuracy criterion. (c) Ground truth and reconstructed surface deformations, and the RMS and SSIM values are listed below the images. (d) Horizontal and vertical cross-section profiles (marked with yellow lines in (c)).

Transfer learning
Next, the pre-trained RCNN model is trained on the data generated by GRASP Ticra 9.0. To verify the importance of transfer learning, a comparison is made, i.e. another RCNN model without pre-training is trained directly with the same data. In addition, the number of the image sets in the training dataset is set as a variable. After the transfer learning, the same test dataset is employed to demonstrate the reconstruction performance, and the corresponding RMS errors are presented in Fig. 4. It is clear that after the pre-training, the learning of the inverse mapping relationship via the RCNN model can be greatly improved and accelerated. In particular, for the pre-trained RCNN model, the transfer learning converges quickly (with all RMS errors over the test dataset less than  $\lambda/120$) with only 400 image sets used as the training dataset. In contrast, it is very difficult for the untrained RCNN model to converge on a small training dataset. The corresponding RMS errors over the test dataset are much larger than
 $\lambda/120$, and they decrease at a very low rate as the number of training images increases. The RCNN model without pre-training comes to convergence when at least 6000 image sets are used as the training dataset (see Supplemental Document for more details).
Boxplots of the RMS errors of the surface recovery over the test dataset via the RCNN model with and without pre-training. The blue and red dashed lines are the same one, i.e., the accuracy criterion ( $\mathrm{RMS} \lt \lambda /120$).

The reconstruction performance of various methods, including RMS error, SSIM value, and computation time, is summarized in Table 2. The computation time of the RCNN model and the Huang algorithm are 0.85 and  $2.79 \, \mathrm{s}$, respectively, while the counterpart of the GS algorithm is
 $19.82 \, \mathrm{s}$. Figure 5 shows some reconstructed surface deformations by different methods, including the above two RCNN models (400 training image sets are used in the transfer learning), the Huang algorithm, and the GS algorithm. The first row is the ground truth surface deformations, the second and third rows are those recovered by the RCNN model with and without pre-training, and the fourth and fifth rows are those recovered by the Huang and GS algorithms, respectively. It can be seen that the RCNN model with pre-training has the best reconstruction performance. As for the RCNN model without pre-training, the general contour can be recovered, but most of the detailed features are lost. The reconstructions using the Huang algorithm have higher accuracy around the image center, while the recovery accuracy near the image edge is poor, which is due to the linear assumption related to the spatial coordinate. Finally, the GS algorithm fails to achieve reliable surface recovery, indicating that it is difficult for the iterative algorithm to find the global optimal solution under the intensity-only constraints.
The predictions by different methods. (a) Ground truth surface deformations. (b, c) Recovered surface deformations via the RCNN model with and without pre-training. (d, e) Recovered surface deformations using the Huang algorithm and the GS algorithm. The corresponding RMS and SSIM values are listed below each image.

Comparison of different methods on the test dataset, including mean RMS error, mean SSIM value, and mean computation time

Noise robustness of RCNN model
In practice, the intensity measurements may be contaminated by various noises, such as Gaussian noise, Poisson noise, speckle noise, etc. And, the final reconstruction can be seriously destroyed by these noises. Therefore, the robustness of different methods to noise is studied in this subsection. A certain amount of noise is added to the original intensity images, and the corresponding noise level is measured by the signal-to-noise ratio (SNR). We take Gaussian noise as an example, and the study of Poisson noise is presented in Supplemental Document.
In previous studies, various deep learning frameworks have been proposed to perform image denoising. In this subsection, we investigate whether the RCNN model can also be used as a denoiser when performing surface recovery. Specifically, an RCNN model is trained with noisy image sets in the pre-training and transfer learning process (referred to as noise-learning). Meanwhile, another same RCNN model is trained with noise-free image sets (referred to as noise-free-learning). In the transfer learning process, 700 image sets are used as the training dataset for both noise-learning and noise-free-learning. Then, the same test dataset consisting of 100 noisy image sets is adopted to demonstrate the reconstruction performance, and the corresponding RMS errors are shown in Fig. 6. It is clear that the performance of the RCNN model is significantly improved via noise-learning compared with the counterpart of noise-free-learning. As the noise level increases (i.e., the SNR value decreases), the performance of the RCNN model by noise-free-learning degrades critically, as expected, with RMS errors becoming larger than the accuracy requirement and their distribution becoming much wider. In contrast, the performance of the RCNN model by noise-learning is robust, and the RMS error and its range remain stable.
The violin plots of the RMS errors of the surface reconstruction over the same test dataset via the RCNN model under noise learning and under noise-free learning.

Figure 7 shows the reconstructions by different methods under noisy conditions. The first line is the noise-free intensity image and the noisy ones at the aperture plane, and the second line is the intensity images at the near-field plane. Without an effective denoising approach, the performance of the RCNN model under noise-free-learning, the Huang algorithm, and the GS algorithm become worse as the noise increases, and even fails to recover the surface deformation ( $\mathrm{SNR} = 20 \, \mathrm{dB}$). In contrast, the RCNN model under noise-learning produces reliable reconstructions even when the noise is very high, suggesting that the noise can be implicitly revealed in the backward propagation model using this data-driven approach.
Reconstruction performance of different methods under noisy conditions. (a), (b) Original intensity image and the noisy ones at the aperture plane and at the near-field plane. (c, d) Surface recovery via the RCNN model under noise-learning and noise-free-learning. (e, f) Surface recovery via the Huang algorithm and the GS algorithm. The corresponding RMS and SSIM values are listed below each image.

Robustness to axial positioning errors
The point-by-point intensity measurement is planned to be performed by an unmanned aerial vehicle (UAV). The positioning error of the UAV can have an important influence on the recorded intensity and the final surface recovery. In this subsection, the effect of the axial positioning error of the UAV is investigated. For each measuring point M at the aperture plane and at the near-field plane,  $\mathrm{M} = (x,y,z=z_m)$, a certain perturbation is added along the z-axis, i.e.,
 $\mathrm{M}' = (x,y,z=z_m + \Delta z(x,y))$, where this perturbation obeys a random uniform distribution,
 $\Delta z(x,y)) \mathop{\sim} \limits^{\mathrm{i.i.d.}} \mathrm{U} (-\frac{\Delta z_{\mathrm{max}}}{2}, +\frac{\Delta z_{\mathrm{max}}}{2})$, where
 $\Delta z_{\mathrm{max}}$ is the maximum axial positioning error. The reconstruction performance versus
 $\Delta z_{\mathrm{max}}$ is shown in Fig. 8. It can be seen that the surface recovery is accurate and stable even when the maximum axial positioning error is up to
 $1 \, \mathrm{m}$. In practice, most commercial UAVs are able to meet this positioning accuracy requirement.
The boxplot of the RMS errors of the surface recovery over the test dataset via the RCNN model when the measuring points have axial positioning errors.

Discussion and conclusion
In this work, a deep learning based framework is developed to achieve fast and accurate surface recovery. RNN and CNN are combined to build the inverse mapping relationship between the intensity measurements and the surface deformation. In addition, a physical forward propagation model is used to perform the pre-training, which is helpful to facilitate the practical application of this method.
RNN is first proposed to solve the prediction problems with the input temporal sequential signals. Recently, RNN is combined with CNN to predict the fluorescence intensity image at a certain transverse plane according to the known ones at other planes. In these studies, the input and output of the network are both the same temporal or spatial signals. However, in our work, the network input and output have different spatial properties, while spatial causality exists between them. And, it is proved in the pre-training and transfer learning that the complex inverse mapping relationship between these spatial sequence signals can be well established via the RCNN model.
Next, transfer learning is helpful to facilitate the practical application of this deep learning-based surface reconstruction framework. Although a physical forward propagation model is required, a large amount of data can be generated via this propagation model in a computationally efficient manner compared to the time-consuming collection of experimental data. Thus, the corresponding approximate inverse mapping relationship can be built up in advance via the RCNN model. As a result, a 15-fold reduction in the number of training images is achieved in the transfer learning process. From an optimization point of view, pre-training provides a good initial guess for transfer learning. However, in practice, it is still difficult to obtain the ground truth surface deformations, which can be the focus of further study.
Traditional methods can be classified as the model-driven approach, since the basis and focus of their study is to develop an accurate forward propagation model. In the Huang algorithm, microwave propagation is described by ray propagation, which is not valid since the diffraction effects cannot be ignored in the large antenna scattering problems. Although its reconstruction is fast, the reconstruction accuracy is not satisfactory. For the GS algorithm, the forward propagation model is more accurate than that of the Huang algorithm. However, due to the ill-posedness of the reconstruction problem, the iterative algorithm fails to find the global optimal solution. Deep learning is known for its data-driven approach to directly build the inverse mapping relationship. However, its weakness and limitation is that the preparation of a large amount of experimental data is challenging.
In this work, the model-driven approach and the data-driven approach are combined. The former is used to establish the basis of transfer learning, thus reducing the requirement in the number of experimental data for deep learning, while the latter is adopted to establish the inverse mapping relationship between the spatial sequential signals. By using multiple intensity as the network input, the number of image pairs in the training dataset can be further reduced to facilitate the practical application of the deep learning approach. In addition, the RCNN model is more robust to noise and axial positioning errors of the measurement points.
This study may also be useful in adaptive optics, where atmospheric turbulence is also related to phase contrast at the aperture plane.
Supplementary material
The supplementary material for this article can be found at https://doi.org/10.1017/S1759078724000217.
Acknowledgement
The authors would like to thank Boyang Wang for the helpful discussions and feedback.
Funding statement
This work was funded by the National Natural Science Foundation of China (NSFC) [Project No. U1931137].
Competing interests
None declared.

Zhan Tong received his bachelor degree in mechanical engineering from Jilin University in 2018 and started his Ph.D. research in the School of Mechanical Engineering, Shanghai Jiao Tong University in September 2018. His main research interests are Microwave Holography, Phase Retrieval Algorithm, Reflector Surface Measurement, and Optical Diffraction Tomography.

Xuesong Ren received his bachelor degree in mechanical engineering from the Shanghai Jiao Tong University in 2019 and started his Ph.D. research at the School of Mechanical Engineering, Shanghai Jiao Tong University in September 2021. His main research interests include microwave holography, computer vision, and computational photography.

Guoxiang Meng received her Ph.D. in 1990 from Xi’an Jiao Tong University. She became a full-time professor at Shanghai Jiao Tong University in 2004. Her main research interests are reflector surface measurement, fluid transmission, and control theory.



