


Introduction
The vertical motion of ice which covers a body of water can be very important to structures adhering to this ice. An example is the phenomenon of “ice jacking”, where continued small vertical oscillations of the ice can pull up a pile several meters high over the course of a winter (see, e.g. Reference WortleyWortley, [1978]). Such oscillations are particularly troublesome in harbors, where there are usually many structures, and are often associated with a natural resonance of the water in the harbor. Thus, it is both interesting and important to consider the properties of such seiching when the harbor is covered with ice.
A simple model related to this behavior is considered below: the transverse oscillations in an infinitely long channel of uniform depth and with vertical walls. The ice is assumed to be elastic, and the water pressure hydrostatic, that is, the long-wave approximation is used. There have been relatively few studies of waves under ice in situations where lateral boundaries are important (see, e.g., Reference StokerStoker, 1957). Thus, the work below should probably be considered a base-line study, on which improvements can and should be made. However, the algebra involved is rather tedious, and these results are reported now, in an attempt to set the stage for further work. Special attention is devoted below to the conditions under which the natural approximations of water hydrostatics and ice elasticity both hold. Finally, it does seem that this rather idealized model, which incorporates the dynamics of the motion of the underlying water, is an improvement over the commonly used model of an elastic plate on an elastic foundation.
The Model
The situation considered is shown in Figure 1. Ice of uniform thickness 2h covers an infinitely long channel of uniform depth H and width W. The x coordinate has its origin at the channel center, and is directed across the channel. The z coordinate is positive upward. The effects of the Earth’s rotation are neglected, the pressure is assumed hydrostatic, and the ice elastic. The oscillations are taken to be small in amplitude. Then the linearized equations of motion are, when variations along the channel are assumed to vanish Reference Stoker(Stoker, 1957),

Here, ς is the displacement of the ice from its equilibrium position, u is water velocity in the x direction, p is water pressure, p0 is water pressure at the ice-water interface, ρ is water density, ρi is ice density, D= 2h3E/3(1−v 2) is the flexural rigidity of the ice, E is Young’s modulus, and v is the Poisson coefficient.
The coordinate system and basic notation for the model. Note that the ice is assumed to be rigidly clamped to (i.e. frozen to) the channel walls.

Analysis

gives
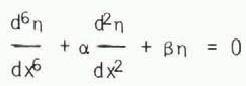
where

(which = p g/D, for thin ice) and

Assuming η∝eλ x, and working through the necessary algebra eventually gives the six independent solutions

where A= P cos θ/2, B= P sin θ/2,  and
 , and

 .
It should be noted that
 and
 are real,
 , and
 . Also, P and C are real and positive, and π/3 < Θ π/2. The cases where α < 0 occur at periods less than a few seconds, and fall outside both our range of interest and the hydrostatic approximation.
First consider the modes of oscillation which are asymmetric about x= 0. Here,

where the Ai are constants to be determined by the boundary conditions. These conditions are η = dη/dx= u= 0, at x = ±W/2. When u is written in terms of η using Equations(1), these become

The assumed conditions at the walls deserve comment. We have taken the ice to be rigidly attached to the (vertical) walls. This can be inappropriate: in Nature, an ice crack induced by changing water levels is often seen very near the wall. This crack would suggest that some type of “free” conditions, such as no vertical shear and no bending moment in the ice at the wall, would be more realistic. The conditions we have chosen in this paper will only apply when such a crack is not present. Somewhat paradoxically, this is likely to be so when water-level changes are rather uncommon (e.g. on small, inland water bodies not strongly affected by tides). Here, the ice has a much better chance to adhere strongly to the wall.
The best boundary conditions with which to model seiching when the ice is separated from the wall are not obvious. It is very likely that some water would seep upward through any crack, thus relieving the water pressure, and changing the water dynamics. However, the no-shear, no-moment conditions could give another bound on the resonant frequencies in an actual situation. We would expect these frequencies to be somewhat lower, as the system is then less constrained.
For a nontrivial solution (i.e. Ai≠0), the coefficient determinant of Equations(4) must vanish. Introducing the non-dimensional variables
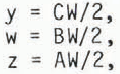
then gives, after some algebra, the condition

where

A similar treatment for the modes which are symmetric about x= 0 gives

The Solution
To solve Equations (6) and (7), it is convenient to introduce the new variables

where


Note that Equations (5) give


where
The Dispersion Relation
It is numerically convenient to specify Ψ and then solve Equations (6), (7), and (8) for Φ. However, we really want Φ in terms of χ and Δ, which is a non-dimensional dispersion relation. For fairly thin ice, we do not expect ice thickness to affect the seiche period greatly. Thus, φ should vary mainly with χ. The relations between (χ,Φ) and (φ,Φ) for Δ = 0 are
The equivalent relations for Δ ≠ 0 are
We expect Δ to be small, and χ to be rather large. For example, consider the following typical case, which will also be used later:

Here, Δ = 2.25 × 10⁻⁴, and χ = 1.7 × 10⁴. We also expect Φ not to be extremely sensitive to changes in Δ, so that the relation between ϕ0 and χ0 should give a good estimate of the dispersion relation for most physically reasonable situations.
The dispersion relations for the first three modes (i.e. having 1, 2, and 3 nodes), and for Δ = 0 and 10−3, are shown in Figure 2. The calculated values of φ(Ψ) are given in Table I. The dispersion relation for other values of Δ can be easily calculated from the (χ,Φ ; Φ,Ψ) relations given above. As expected, the natural frequency increases with increasing D, and with decreasing W (i.e. decreasing χ). The frequencies increase with increasing Δ, although this effect is very small for the fundamental mode. The fundamental period for the typical case (9) is T= 29.7 s. The corresponding period for an ice-free channel is calculated from Merian’s formula  to be 40.4 s.
The dispersion relation for seiching in a two-dimensional, ice-covered channel, showing the natural nondimensional frequencies Φ for the lowest three modes of oscillation. The numbers by the curves are mode numbers. The solid curves show the Φ, x relation for Δ = 10−3. The dot-dash curves show the asymptotic estimates given by Equations (10) and (11). All logarithms here and elsewhere are to the base ten.


It is helpful to have more explicit forms of the dispersion relations, for large, but reasonable χ. In many physically realistic situations, ψ is quite large, suggesting that the sinusoidal terms in Equations(6) and (7) are relatively small. Then large-value expansions of the ψ portions of y, w, and z given in Equation(8) lead to the asymmetric-mode relation
where a= 33/4/2. Rewriting this in terms of χ and Φ gives

The corresponding symmetric-mode relation is

The dispersion curves defined by Equation (10) and (11) are also shown in Figure 2. They are quite accurate for χ greater than about 106, although the discrepancy at a fixed χ increases with increasing mode number.
For extremely large χ, Equations(10) and (11) give
where n = 1, 2, 3, … is the mode number. This can be rewritten as

The corresponding result for no ice, obtained by simply rewriting the general Merian formula  in terms of Φ, is
Thus, the vibration frequency in the limit as the ice thickness approaches zero is less than that for the no-ice case. This is perhaps unsettling, as water with ice would seem to represent a “harder” spring-mass system than that without. The explanation seems to lie in the boundary conditions, and the singular nature of the problem in the thin-ice limit. For the fundamental mode (for example), and for the same slopes ∂η/∂x at the channel center, the boundary conditions at the walls ensure that there is more potential energy in the no-ice case than in the case where ice is present, but where h approaches zero (since the strain energy of ice can then be neglected). Thus, the no-ice case is harder, and the natural frequency higher. This only happens at very high χ: for the fundamental mode, we find Φ =π at χ =  = 1.1 × 10¹¹, and Φ < π for
 . In fact, we will show below that the hydrostatic approximation is often not valid near the wall for such large values of χ. (In the case of (9) above,
 when the ice thickness is decreased to 0.25 mm.)
Representative shapes of the first three modes for various χ are shown in Figure 3. The maximum value of η(ηmax) approaches the wall with increasing χ. Near the wall, the η derivatives are large, in accord with the wall boundary conditions and the singular nature of the problem. Enlargements of the fundamental mode shapes in this region are shown in Figure 4, and the positions of ηmax as a function of χ in Figure 5. Note that the positions of the maxima nearest the wall become the same for all three modes, as χ becomes large. Of course, the locations of such maxima should be avoided when placing structures such as piles.
Examples of the shapes of the lowest three modes together with the corresponding values of χ0 and χ, for Δ = 10−3

The shape of the fundamental mode near the channel well, for various Ψ or χ0. The near-wall shapes of the second and third modes are very similar to this.

Positions of the maxima of the three lowest modes, as a function of χ0. The number by each curve is the mode number. The second maximum for mode 2 is always at Χ = 0.

The Range of Validity
Over what ranges of parameters are the above results valid? The results are limited mainly by two assumptions. First, the hydrostatic approximation was used. This is valid only for rather long-period oscillations. Second, the ice was assumed to behave elastically, and creep was neglected. This is valid only for fairly short-period oscillations. Thus, we expect there to be a range of the oscillation period T over which the above results are reasonably accurate. The criteria will be couched in terms of Φ and, via the dispersion relation, χ.
First consider the hydrostatic approximation. The elementary criterion for this to hold is that the water be shallow: W/H>>1. (To obtain numbers below, this statement and others similar to it will be interpreted, rather conservatively, as W/H > 10). However, Reference LambLamb (1932) and Reference ProudmanProudman (1952) have shown it also necessary that
for vertical accelerations to be neglected. This can be written

Using the lower bound on W/H given just above yields Φ < 5. Thus, most of each of the dispersion curves shown in Figure 2 is valid for any W/H >> 1, and slightly larger W/H render the entire figure valid, at least with respect to condition (13).
However, this is not the end of the matter. There is also an upper bound on χ (and a corresponding lower bound on Φ) associated with the hydrostatic approximation. Reference Peregrine and MeyerPeregrine (1972) has shown in a rigorous fashion that the hydrostatic relation is valid to an error on the order of (H/L)2, where L is an appropriate horizontal length scale for the situation. This scale is normally taken to be W, but in our case the distance d from the wall to the nearest η maximum seems much more reasonable (see Fig. 5). Again, this is especially true because of the singular nature of the problem, and the consequent great importance of the boundary conditions at the wall. Define ξ as the fractional distance from the wall to the nearest η maximum: d = ξW/2. Then the resulting criterion for the hydrostatic approximation to hold near the wall becomes

Thus, there is a minimum ξ associated with each W/H. Since ξ decreases with increasing χ (Fig. 5), there is a maximum χ associated with each W/H. The resulting range of validity is shown in Figure 6. This criterion must be kept in mind, when proceeding to the thin-ice limit.
The range of validity of the results, according to the hydrostatic approximation. The numbers by the curves are mode numbers. The regions above each curve are those for which the hydrostatic approximation is valid. The difference between the curves for χ(Δ = 10−3) and χ0 is at most about 2% of χ0, and cannot be shown at the scale of the figure.

Now consider the limitations imposed by the elasticity assumption. Ice does not behave elastically when the time scale of loading is large. The precise criterion for the case of oscillatory motion is still unclear, and may well be amplitude dependent (Reference MichelMichel, 1978). However, a reasonable value for the largest “elastic” period seems to be Te = 5 min. The condition T < Te gives

This lower bound on Φ, in conjunction with the dispersion relation, gives an upper bound on χ. Thus, there are two criteria for the maximum value of χ for which the model is probably accurate: that shown in Figure 6, and that given by Equation(15). These vary with the non-dimensional parameters W/H and W/gTe 2; the lower of the two χ values, χm, controls the situation. Contours of χm for the fundamental mode are shown in Figure 7. For small W/gTe 2, the hydrostatic approximation is most limiting, and is independent of W/gTe 2. For large W/gTe 2, ξm is determined by the elasticity approximation. The dividing value of W/gTe 2 decreases with increasing W/H. Similar figures could be drawn for the higher modes.
Maximum values of χ, χm, for which both the hydrostatic and elasticity approximations are probably valid, for the fundamental mode. Below the dashed line, the hydrostatic approximation is most limiting. Above the line, the elasticity approximation is most limiting. Numbers on the curves give the appropriate power of ten.

Now consider example (9) once more. Here, χ = 1.7 ×10⁴. If we choose Te = 300 s, W/gTe 2 = 2×l0−4. Since W/H = 20, this is well within the region where the hydrostatic approximation is most limiting. Here, χm = 4.5 × l05, which is much greater than χ.
In what physical situation is the elasticity criterion most limiting? For variety, consider the case of W/H = 100. The value W/gTe 2 = 2.7 ×10⁻³ is just within the region where χm is given by Equation(15). At this point W = 2400 m and H = 24 m. Also χm = 5.6 × 10⁷. From the definition of χ, the model assumptions hold if
which here requires an ice thickness 2h > 1.9 m. This is rather thick ice. It seems that the hydrostatic assumption is usually more important.
The results shown in Figure 7 are quite insensitive to physically reasonable values of Δ. This is so because the fundamental-mode results shown in both Figure 2 and Figure 6 are also insensitive to Δ. Of course, the small Δ dependence for any of the first three modes could be calculated if desired, using the theory above and the numerical results in Table I.
The maximum usefulness of criterion (15) and Figure 7 await a reliable determination of Te. Also, the accuracy of all these numerical results suffers from the arbitrariness of the above interpretation of “<<” (which can be improved upon, if one has certain limits of accuracy to maintain). The best way to deal with the limitations imposed by the hydrostatic assumption would be to do without it. This seems possible, by following analyses of the reflection of capillary-gravity waves from a wall (e.g. Reference PackhamPackham, 1968).
Finally, consider the remarks in the dispersion-relation section above pertaining to the value of χ above which the natural frequency is less than that in the no-ice case. For the fundamental mode, χ = 1.1 × 10¹¹. Then Figure 6 gives (W/H)min = 320. Thus, for example, the case (9), with ice thickness reduced to give χ, is far outside the range in which the hydrostatic approximation is valid.
Ice Forces at the Wall
Now consider the relation between seiche amplitude and the force and moment exerted on the channel wall. If we neglect the minor dependence on Δ, the mode shape depends only on χ (Fig. 3). Then the maximum ice curvature also varies only with χ, and with the maximum value of η over the entire ice sheet, a. The maximum moment is found to always occur at the wall, and can be written
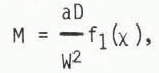
Here, f1 is a normalized, non-dimensional curvature (expressed in terms of w, y, and z). Similarly, the maximum vertical shear force also occurs at the wall, and is given by

where f2 is a normalized, non-dimensional third derivative. The quantities f1 and f2 are shown in Figure 8. Both f1 and f2 increase with increasing mode number, and become independent of mode number for very large χ (in accord with the mode-shape results shown in Figures 4 and 5). Both exhibit an approximately exponential increase with increasing, large χ. That is, the force and moment increase markedly (for fixed a and D) with increasing channel width. It should also be recalled that the position where η = a varies slowly with large changes in χ (Fig. 3).
Nondimensional, normalized moments f1 and shear forces f2 on the channel wall. Mode numbers are given on the curves. The curves for χ(Δ = 10−3 and χ0 indistinguishable at the scale of the figure. See the text for the definitions of f1 and f2.

Ice Failure
Although the case of ice failure may well lie outside the range in which ice can be considered elastic (Reference MichelMichel, 1978), there is some merit in following the elastic model through to this point. This has also been done by others (e.g. Reference BillfalkBillfalk, [1981], Reference Billfalk and Hanover1982; Reference Carter, Carter, Ouellet and PayCarter and others, [1981]), and gives if nothing else a starting point against which progress towards realism can be measured. Accordingly, we will assume that the ice remains elastic up to the point where it breaks, or at least cracks. This point is, of course, yet another bound on the model used above – this time on the amplitude of the seiche.
Since ice can fail in either shear or tension, both cases will be considered. The maximum tensile stress σ occurs at Z = ±h, and is given by σ = 3M/2h2 (see, e.g., Reference Timoshenko and Woinowsky-KriegerTimoshenko and Woinowsky-Krieger, 1959). The maximum shear stress is at z = 0, and is τ = 3S/4h. Denote the ultimate values by σ0 and τ0, and assume that when one of these is exceeded, the ice breaks or cracks (or, at least, that the elastic model no longer applies). Divide Equation(16) and (17) to get

The function q(x) is important to what follows, and is shown in Figure 9.
The function q = f1/f2, which is related to the character of ice failure, when the ice is assumed to behave elastically up to this point. Mode numbers are given on the curves. The solid curves are for Δ = 0. (i.e. χ =χ0). The dashed curves are for Δ = 10−3. They are indistinguishable at the scale of the figure, except for small χ.

Note that Equation(18) is independent of a: for a given situation, the ratio of σ to τ is constant as the seiche becomes more energetic. Then, if σ0 < Rτ0, σ0 and encountered first as a increases, and the ice fails at the wall in tension. In this case the maximum vertical force on the wall is associated with the shear stress τ = σ0/R, and is Smax = 4hσ0/3R. The maximum amplitude is

On the other hand, if σ0 > Rτ0, the ice either fails in shear at the wall, or the ice-wall bond fails. (The criteria for these two occurrences are quite close, see Reference MichelMichel 1978.) The maximum vertical force is now Smax = 4hτ0/3; the maximum seiche amplitude is

According to Reference MichelMichel (1978), σ0 ≈ τ0 (to a factor of 2, which accuracy is in accord with the spirit of the entire argument), so that R ≈ 1 separates the two cases, or q(χ) ≈ h/2W. That is, for h/2W < q, we expect the ice to fail in tension, Smax ≈ hσ0, and amax ≈ σ0W2/(Ehf1).
Now consider case (9) discussed above. Here, Figure 9 gives q ≈ 0.06. Since h/2W ≈ 10−3, we expect the ice to fail in tension. Then, using σ0 = 2 × 10⁶ N/m2, Equation(19) suggests amax ≈ 8 cm. The maximum vertical force on the wall is about 3 × l04N/m.
Summary
A first step towards describing seiching in an ice-covered channel has been taken, using the assumptions of ice elasticity and hydrostatic pressure in the water column, and assuming the ice to be rigidly attached to the channel walls. The domain over which the elasticity and hydrostatic-pressure assumptions should be valid has been delineated, and maximum forces and moments on the channel walls calculated. These results, together with the dispersion relation, are the principal products of this paper. The next step should be to do away with the elasticity and hydrostatic assumptions, and to investigate other boundary conditions which may be more applicable when the ice is cracked near the walls. Also, more reliable failure criteria should be incorporated, so that maximum seiche amplitudes, forces, and moments for a given ice thickness, channel width, etc., can be estimated better. These steps will necessitate incorporating phenomena such as delayed elastic strain and creep in the ice constituitive equation (e.g. Reference Sinha, Vermeer, Luger, Rotterdam and BalkemaSinha, 1982; Reference NevelNevel, 1968).
Acknowledgements
I am grateful to Professor C.A. Wortley for several stimulating conversations about the nature of ice. This work was funded by the University of Wisconsin Sea Grant College Program under grants from the National Sea Grant College Program, National Oceanic and Atmospheric Administration, U.S. Department of Commerce, and from the State of Wisconsin. Federal Grant NA800AA-D-00086, Project No. E/E.l.



