Introduction
Folliculogenesis is a fundamental process of female reproduction. The state of follicles in the ovary is a major indicator of female fertility preservation. Folliculogenesis is mainly regulated by gonadotropins. Follicle-stimulating hormone (FSH) is a growth and differentiation factor for preantral follicles (McGee et al., Reference McGee, Spears, Minami, Hsu, Chun, Billig and Hsueh1997). FSH acts through membrane-associated receptors to stimulate granulosa cell proliferation and oestrogen biosynthesis (Gore-Langton and Dorrington, Reference Gore-Langton and Dorrington1981). Pregnant mare serum gonadotrophin (PMSG) is an isohormone of FSH and has been widely used to induce oocyte maturation and follicle growth artificially.
Oestrogen is a steroid hormone produced in the granulosa cells of follicles. Oestrogen is involved in several important cellular processes such as proliferation, differentiation and apoptosis. Dysregulation of its biosynthesis results in some severe diseases in various systems such as hormone-dependent breast and ovarian cancers, as well as osteoporosis, cardiovascular diseases and neurodegenerative diseases. In particular, oestrogen plays an important role in the development of the female reproductive system and gonad differentiation (Britt and Findlay, Reference Britt and Findlay2003). Oestrogen binds to different receptors (ERs) (Greene et al., Reference Greene, Gilna, Waterfield, Baker, Hort and Shine1986; Kuiper et al., Reference Kuiper, Enmark, Pelto-Huikko, Nilsson and Gustafsson1996), of which the alpha receptor (ERα) is mainly located in thecal cells of follicles, as well as in the oviduct and uterus (Press et al., Reference Press, Nousek-Goebl, Bur and Greene1986). The beta receptor (ERβ) is mainly present in granulosa cells of follicles (Lee et al., Reference Lee, Zhang, Sugiura, Wigglesworth, Uliasz, Jaffe and Eppig2013). These receptors mediate the genomic functions of oestrogen. In addition, G protein-coupled receptor 30 (GPR30) was reported to be a transmembrane oestrogen receptor that is expressed in both oocytes and somatic cells (Wang C et al., Reference Wang, Prossnitz and Roy2007). G15 was found to be an antagonist of this oestrogen membrane receptor (Dennis et al., Reference Dennis, Burai, Ramesh, Petrie, Alcon, Nayak, Bologa, Leitao, Brailoiu, Deliu, Dun, Sklar, Hathaway, Arterburn, Oprea and Prossnitz2009)
During the early stages of follicle growth, it is well accepted that the oestrogen–ERs system is functional in maintaining oocyte meiotic arrest by regulating the expression of natriuretic peptide C and natriuretic peptide receptor 2 (NPPC/NPR2) (Liu W et al., Reference Liu, Xin, Wang, Wang, Wang, Zhang, Yang, Zhang, Zhang, Wang, Xu, Duan and Xia2017). However, whether oestrogen influences other aspects of folliculogenesis is not resolved. Primordial follicle differentiation and early activation were believed to be independent of oestrogen. Other studies in mice have shown that estradiol (E2) had a role in controlling the size of the primordial follicle pool and oocyte size (Britt, et al., Reference Britt, Saunders, McPherson, Misso, Simpson and Findlay2004). Ovaries from mutant mice with an oestrogen receptor α gene knockout (ERαKO) exhibited only a few primary follicles (Lubahn et al., Reference Lubahn, Moyer, Golding, Couse, Korach and Smithies1993). In other ERαKO mice, ovaries grew normal follicles through the primordial, primary, and antral follicle stages (Schomberg et al., Reference Schomberg, Couse, Mukherjee, Lubahn, Sar, Mayo and Korach1999). The distinct defect in oestrogen receptor β gene knockout (ERβKO) mice was anovulation (Antal et al., Reference Antal, Krust, Chambon and Mark2008; Maneix et al., Reference Maneix, Antonson, Humire, Rochel-Maia, Castañeda, Omoto, Kim, Warner and Gustafsson2015) or the reduced ability to ovulate (Krege et al., Reference Krege, Hodgin, Couse, Enmark, Warner, Mahler, Sar, Korach, Gustafsson and Smithies1998). The infertility of the ERβKO mouse appeared to be due to the lack of late follicular maturation and ovulation (Dupont et al., Reference Dupont, Krust, Gansmuller, Dierich, Chambon and Mark2000; Maneix et al., Reference Maneix, Antonson, Humire, Rochel-Maia, Castañeda, Omoto, Kim, Warner and Gustafsson2015). So it remains ambiguous whether oestrogen influences early development of follicles, and whether the promoting effect of FSH on the follicle growth is mediated by oestrogen.
Although oestrogen is involved in ovulation through downregulating gap junction communication between cumulus cells and oocytes in goat COCs (Zhang H et al., Reference Zhang, Wei, Gao, Ma, Yang, Zhao, Liu, Liu, Zhao and Ma2019) and through promoting cumulus cell expansion (Liu J et al., Reference Liu, Yao, Lu, Xu, Zhang, Wei, Zhao, Tang, Li, Liu, Zhao, Wei and Ma2020), how it contributes to meiotic resumption remains to be elucidated. The expression of ERα/β in growing follicles was found to be promoted by PMSG. However, with maturation of follicles, expression of ERα and ERβ proteins was greatly reduced following human chorionic gonadotropin (hCG) stimulation (Liu W et al., Reference Liu, Xin, Wang, Wang, Wang, Zhang, Yang, Zhang, Zhang, Wang, Xu, Duan and Xia2017). Conversely, expression of the G protein oestrogen receptor (GPER) on the oocyte membrane increased with oocyte maturation (Li et al., Reference Li, Ren, Zhang, Li and Chian2013). So it is possible that oestrogen functions continuously after follicles have grown.
The objective of this study was to clarify whether the promotion of gonadotropin to follicle development is mediated by oestrogen, and whether oestrogen contributes directly to meiotic resumption. For this purpose, two antagonists of oestrogen, tamoxifen and G15, were used to determine the effects of oestrogen on folliculogenesis.
Materials and methods
Supplementation of tamoxifen to the superovulation of mouse
All experimental procedures on mice were conducted according to Guangdong provincial ordinances on laboratory animals.
Here, 6–8-week-old female NIH mice (Guangdong Medical Laboratory Animal Centre) were divided into two groups [Control (Ctrl) group and tamoxifen (Ta) group]. Ctrl group mice were superovulated regularly with 10 U PMSG (ShuSheng, China); Ta group mice were injected with tamoxifen (MCE) 20 μg/0.2 ml, 1 day prior to the PMSG administration. Then four additional injections were administered at 12-h intervals, in total 100 μg tamoxifen was injected intramuscularly to each mouse. Next, the ovaries were taken and fixed in 4% paraformaldehyde (PFA). Haematoxylin and eosin (H&E) staining was carried out after sectioning to display the follicles.
Preparation of the preantral follicles
For in vitro culture of preantral follicles, 3-week-old NIH mice were killed by cervical dislocation. Mouse ovaries were carefully picked and the adipose and connective tissues were removed. Under a stereoscopic microscope, follicles were dispersed using a sterile needle and kept in handling medium [0.01% penicillin, 0.01% streptomycin, 10% fetal bovine serum (FBS) (Gibco) and 0.36% HEPES (Genview) in MEM α (Gibco)]. Preantral follicles with diameters between 100–160 μm were selected and rinsed three times in the handling medium.
In vitro culture of the preantral follicles
Preantral follicles of commensurate sizes were pooled and used for two experiments.
For Experiment 1, follicles were divided randomly into three groups (Ctrl, 1 μM Ta and 5 μM Ta) to compare the influence of tamoxifen on the growth of preantral follicles. The basic medium for all the three groups was MEM α supplemented with 0.01% penicillin, 0.01% streptomycin, 10% FBS and 1% insulin–transferrin–selenium (ITS) (ScienCell), as well as 250 mU/ml of PMSG. Additional tamoxifen (1 μM or 5 μM) was added to the medium of the 1 μM Tam and 5 μM Tam groups, respectively.
Single follicles were cultured in the wells of 96-well plates with 100 μl corresponding culture medium and kept in an incubator (ESCO) in an atmosphere of 5% CO2 in air and 100% humidity at 37°C. Half of the medium was removed and replaced with fresh medium after 2 days of culture. Follicles were photographed before the culture started (Day 0) and after 2 and 4 days of culture (Days 2 and 4) under an inverted microscope (Olympus LX51). Diameters of the follicles were measured with ImageJ software based on the photographs.
At the end of culture, all the medium in the wells was replaced with 100 μl fresh medium and 10 μl solution of Cell Counting Kit-8 (CCK-8) (NCM) was added in each well, optical density (OD) was measured using a microplate reader (BioTek Synergy4) at 450 nm after 2 h of incubation at 37°C.
For Experiment 2, to compare the effects of G15 (MCE) on follicle growth, commensurate follicles were randomly grouped (PMSG and G15) and single follicles were seeded into the wells of the 96-well plates with 100 μl culture medium. The basic medium of two groups for follicle culture was MEM α with 250 mU/ml of PMSG as in Experiment 1. An additional 1 μM G15 was added into the medium of the G15 group.
Follicles were incubated with 5% CO2 in air at 37°C. Half of the medium was refreshed on every other day. The cultured follicles were photographed at Days 0 and 6. At the end of the culture, 10 μl of CCK-8 solution was added to each well with 100 μl culture medium for the OD measurement. Diameters of the follicles were measured using ImageJ software.
COCs isolation and culture
NIH female mice (aged 4–8 weeks) were injected intraperitoneally with 10 IU PMSG and, 48 h later, the ovaries were taken out and moved to washing medium consisting of 0.01% penicillin, 0.01% streptomycin, 0.3% bovine serum albumin (BSA) (Roche), 0.36% HEPES (Genview) and 4 mM hypoxanthine (HX) (Solarbio) in MEM α. Cumulus–oocyte complexes (COCs) were isolated by puncturing the antral follicles with sterile needles, and then washed through several changes of washing medium.
COCs were divided randomly into four groups and were cultured in 2 ml maturation medium in 35-mm dishes. The maturation medium of the control group was MEM α with 0.01% penicillin, 0.01% streptomycin, 0.3% BSA (Roche) and 0.1% DMSO (Sigma), the maturation medium of the E2 group contained 0.1 μM estradiol (E2) (MCE) in the medium of the control group, the medium of 1 μM G15 and 10 μM G15 groups contained additionally 1 μM G15 or 10 μM G15 in the medium of the E2 group.
After 2 or 12 h of culture, COCs were incubated with 0.25% trypsin (GIBCO) in phosphate-buffered saline (PBS) for 1–2 min, and cumulus cells were removed by gentle pipetting. Then, denuded oocytes (DOs) were fixed in 4% paraformaldehyde in PBS. The germinal vesicle (GV) or the first polar body (PBI) was checked under the inverted microscope. Chromosomes were then stained with 1 μg/ml DAPI, and spindles were stained with anti-α-tubulin antibody (Boster, China) at 1:100 and Dylight 488-labelled secondary antibody at 1:100.
Statistical analysis
The average diameters of follicles, percentages of follicles, percentages of GVBD or PBI extrusion were presented as the mean ± standard error (SEM). Each experiment was repeated three times or more under the same conditions. Differences between groups were evaluated using GraphPad Prism v.7.04 software and t-tests. A P-value < 0.05 was considered as significant statistically.
Results
Tamoxifen inhibited follicle growth in vivo
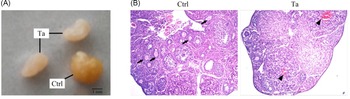
After administration of tamoxifen, the ovaries of Ta group mice were clearly smaller compared with those of the Ctrl group (Fig. 1A). H&E staining showed that there were many less growing follicles in the mouse ovaries from the Ta group, compared with ovarian section of the control group. A few haemorrhagic cysts were seen on the section from the Ta group (Fig. 1B). These findings suggest that follicular growth had been inhibited after the administration of tamoxifen.
Mouse ovaries after tamoxifen (Ta) treatment in vivo. (A) Photograph of mouse ovaries of groups Ctrl and Ta (scale bar: 1 mm). (B) H&E stained ovarian sections of Ctrl group and Ta group mice. Growing follicles (arrows) and haemorrhagic cyst (arrowheads). Original magnification ×40.

Tamoxifen inhibited the follicle growth stimulated by PMSG
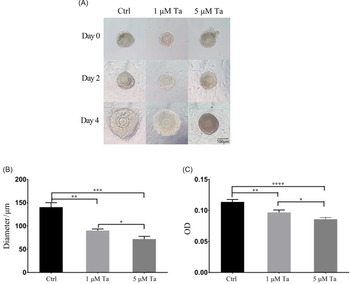
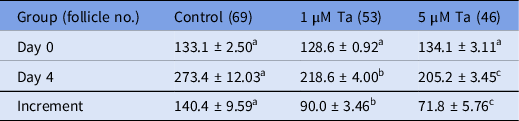
It was evident that most follicles grew during the 4-day culture (Fig. 2A), except for a few degenerated follicles. The average diameters of follicles at Days 0 and 4 are listed in Table 1. Follicle diameters of all three groups were commensurate at the beginning of the culture (Day 0). After 4 days of culture, follicular diameters of the three groups (Ctrl/1 μM Ta/5 μM Ta) increased at different rates (Fig. 2A,B). The diameter increments of follicles from the tamoxifen-treated groups were significantly less compared with that of the control (P < 0.01) (Table 1), and the average diameter in the 5 μM group was less compared with that of the 1 μM group. These findings indicated that PMSG stimulated follicles to grow in vitro and that growth was inhibited in a dose-dependent manner by the addition of tamoxifen (Fig. 2B).
Growth comparison of follicles among the three groups. (A) Photographs of the typical follicles of the three groups (Ctrl/1 μM Ta/5 μM Ta) at different times of in vitro culture (Days 0, 2, 4). Scale bar: 100 μm. (B) Diameter increments of follicles after the 4-day culture in vitro. (C) Average optical density of the formazan colour reaction for the single follicles of the three groups using the CCK-8 kit. Data are represented as the mean ± SEM. *P < 0.05, **P < 0.01, ***P < 0.001, ****P < 0.0001 as determined using Student’s t-tests.

Average diameters of follicles in the three groups (X ± SEM) (μm)

Average diameter of preantral follicles in the three groups at the beginning of culture (Day 0) and after 4 days of culture (Day 4), and the average increments of preantral follicles.
a,b,cDifferent superscripts among groups in the same rows indicate significant differences (P < 0.05).
In addition, the cell numbers of the growing follicles were counted by OD measurement. The average OD value of single follicles in the control group was 0.11, significantly larger when compared with that of 1 μM and 5 μM groups (0.10 and 0.09; Fig. 2C). The higher OD value of the control group indicated that follicles from the control group had more cells compared with that of the 1 μM and 5 μM groups.
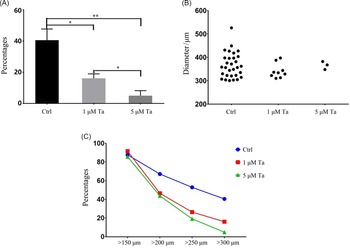
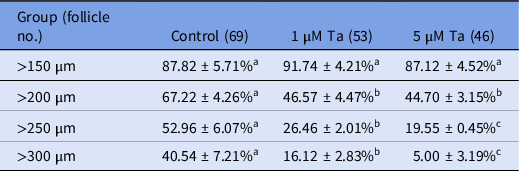
Among all the follicles cultured, predominantly some grew, and exhibited major differences between groups. For example, follicles with diameters >300 μm differed in size and number among the three groups (Fig. 3A). In total, 40.5% of follicles in the control group were >300 μm in diameter, whereas only 5% of follicles reached this size in the 5 μM Ta group (Table 2). The biggest follicle diameters were 526 μm in the control group and 382 μm in the 5 μM Ta group (Fig. 3B). These results indicated that follicles from the control group grew faster than those from the 1 μM Ta and 5 μM Ta groups. In other words, tamoxifen inhibited the growth of follicles induced by PMSG, especially in the later periods of growth. When follicles were cultured in medium containing tamoxifen, most follicles were impeded to reach the size of 300 μm in diameter (Fig. 3B).
Growth of preantral follicles treated by tamoxifen (Ta) in vitro. (A) Percentages of follicles with diameters over 300 μm. P-values were calculated using t-tests. *P < 0.05, **P < 0.01. (B) Scatter diagram of the follicles with diameters over 300 μm. (C) Percentages of follicles with diameters above a certain level after 4 days of culture. Blue line represents the follicles of the Ctrl group, red line represents follicles of the 1 μM Ta group, green line represents follicles of the 5 μM Ta group. Ctrl, 1 μM Ta and 5 μM Ta stand for control, 1 μM Ta and 5 μM Ta groups, respectively.

Percentages of follicles reaching certain levels of diameter

Percentages of follicles with diameters above a certain level after 4 days of culture (Day 4) in the three groups.
a,b,cDifferent superscripts among groups on the same rows indicate significant differences (P < 0.05).
To further analyze follicle growth, the percentages of follicles reaching certain sizes were calculated (Table 2). Results showed that the percentages of follicles reaching diameters of 200 μm, 250 μm, and 300 μm in the tamoxifen-treated groups were lower compared with those in the Ctrl group, although the initial sizes of the follicles in all the three groups were commensurate (Tables 1 and 2). These findings indicated that tamoxifen had inhibited the growth of follicles to diameters of 200 μm, 250 μm, 300 μm, and that inhibition increased as the follicles grew larger (Fig. 3C). These results suggested that oestrogen had a promoting effect on follicle growth in the early period.
G15 did not decrease the growth of follicles stimulated by PMSG
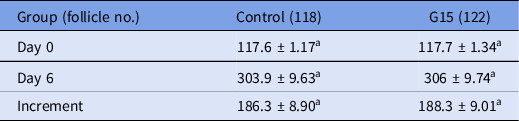
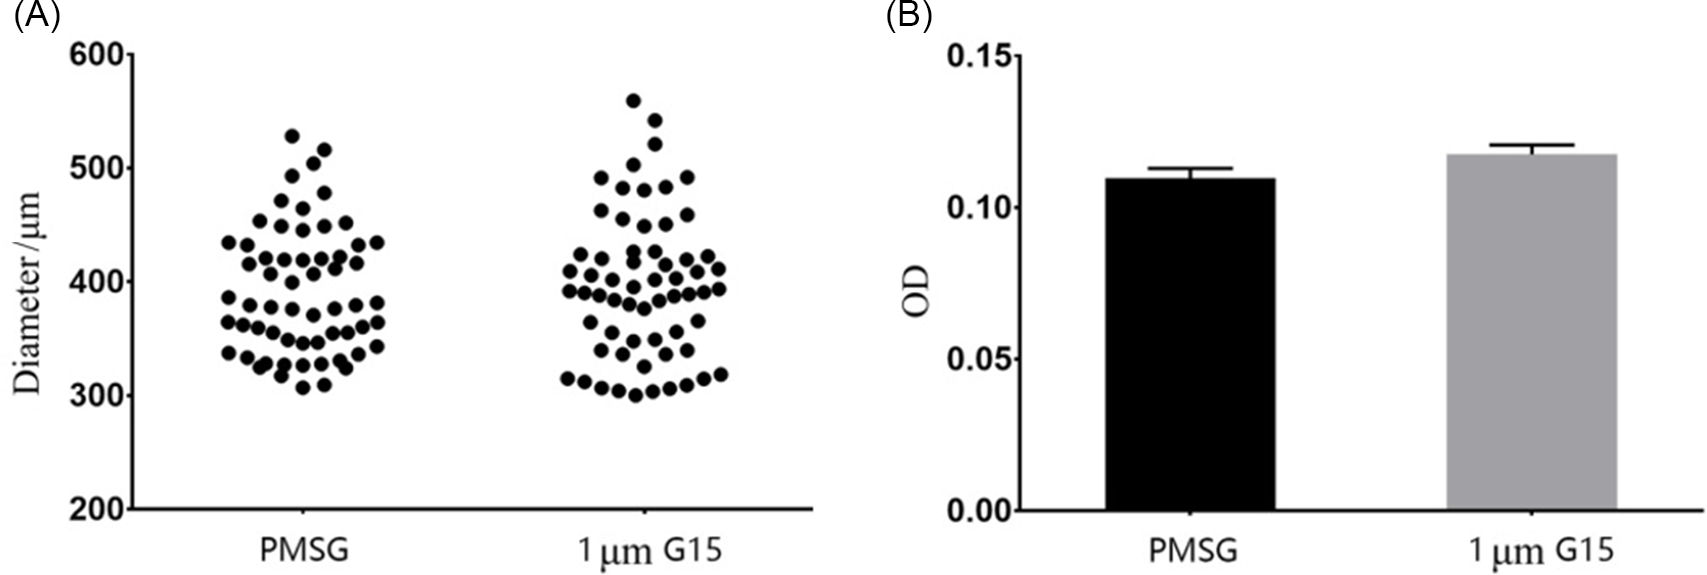
Follicles were cultured in medium containing G15, the antagonist of oestrogen to the membrane receptor, and follicle diameters were measured after 6 days of culture. Results showed that the average diameter of follicles cultured with 1 μM G15 did not differ significantly from that of follicles cultured with PMSG alone (Table 3 and Fig. 4A). The percentage of follicles >300 μm in diameter was 50.85% in the PMSG group, which was not significantly different from that of the G15 group (50.82%). The biggest follicle in the PMSG group had a diameter of 528.2 μm, while the largest diameter in the G15 group was 559.2 μm.
Average diameters of follicles cultured in the medium with G15 (X ± SEM) (μm)

Average diameters and the diameter increments of preantral follicles between control (Ctrl) and G15 groups at the beginning of culture (Day 0) and after 6 days of culture (Day 6). Data are represented as the mean ± SEM.
aThe same superscripts in the same rows indicate insignificant differences (P > 0.05) (P-value using Student’s t-tests).
Comparison of the follicle growth between PMSG and G15 groups. (A) Scatter diagram of the follicle diameters of the two groups. (B) Average optical density (OD) values for the formazan colour reaction of single follicles from the two groups using the CCK-8 kit. The difference between the PMSG and G15 groups was not significant statistically.

The formazan colour reaction for single follicles showed that average OD values of follicles after 6 days of culture were not significantly different between PMSG and 1 μM G15 groups (0.11 and 0.12; Fig. 4B). These results indicated that G15 did not hamper follicles growth when stimulated by PMSG.
Taken together, tamoxifen, instead of G15, inhibited follicle growth promoted by PMSG. These results showed that PMSG is dependent on oestrogen to promote follicle growth. Oestrogen has growth-enhancing effects on follicles during the early growth stage. Therefore, oestrogen contributes to follicle growth during early folliculogenesis. The effect of oestrogen on follicle growth is mediated by the nuclear receptor, not by the membrane receptor.
GVBD occurred without oestrogen
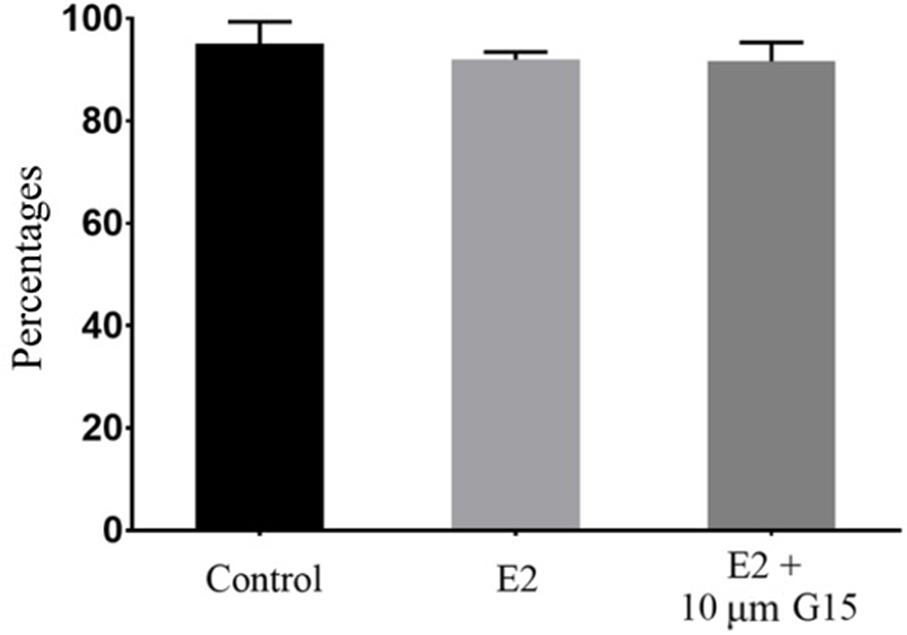
When the cumulus cell–oocyte complexes were picked at 48 h after PMSG administration, oocyte meiosis was ready to resume. Germinal vesicle breakdown (GVBD) occurred spontaneously at a percentage of 95.07 ± 2.48% after 2 h of culture. Supplementation of oestrogen in the medium did not significantly change the occurrence of GVBD (91.97 ± 0.74%), concurrent supplementation of G15 also did not change occurrence (91.67 ± 1.83%) (Table 4 and Fig. 5). The percentages of GVBD were not significantly different among the three groups (P > 0.2). This result suggests that the oocytes had grown completely at that time and that additional oestrogen was not required for GVBD.
GVBD occurrence of oocytes from the three groups after 2 h culture

Data are represented as the mean ± SEM.
aThe same superscripts in the same row indicate insignificant differences (P > 0.05) (P-value using Student’s t-tests).
Percentages of GVBD oocytes among the three groups after 2 h culture. The differences among the three groups were not significant statistically.

Oestrogen promoted the transition from metaphase to anaphase through GPER
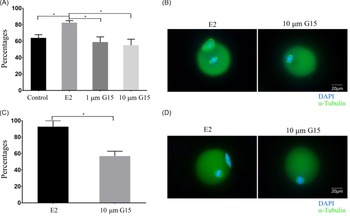
When the COCs were cultured in vitro, meiotic resumption proceeded gradually. GVBD occurred in most oocytes after 2 h of culture (Fig. 5). At 12 h of culture, the first polar body was extruded and oocytes proceeded to metaphase in the second meiosis. The addition of 0.1 μM E2 to the medium increased PBI extrusion to 82.44 ± 2.48%, compared with the control group at 63.93 ± 3.93%. However, supplementation of G15 (1 μM or 10 μM) with 0.1 μM E2 reduced PBI extrusion to 58.82 ± 6.40% or 55.02 ± 7.30%, respectively (Table 5 and Fig. 6A). These results indicate that G15 had significantly inhibited PBI extrusion promoted by E2.
Occurrence of PBI extrusion after 12 h culture

PBI extrusion of oocytes cultured in vitro for 12 h from the control, E2, 1 μM G15 and 10 μM G15 groups. Data are represented as the mean ± sem.
a,bDifferent superscripts in the same row indicate significant differences (P < 0.05).
Occurrence of PBI extrusion from oocytes cultured in vitro. (A) Percentages of PBI extrusion in oocytes from different groups after 12 h of culture. (B) Immunofluorescence images of oocytes cultured for 12 h, α-tubulin (green) and DAPI (blue); scale bar = 20 μm. (C) Percentages of PBI extrusion oocytes from different groups after 17 h culture. (D) Immunofluorescence images of oocyte cultured for 17 h, α-tubulin (green) and DAPI (blue); scale bar = 20 μm. *P < 0.05 as determined using Student’s t-tests.

The addition of E2 did not increase the occurrence of GVBD, supplementation of G15 did not hamper the occurrence of GVBD either. GVBD might be a spontaneous process after release from arrest, however polar body extrusion should need to be facilitated by other factors. Data showed that oestrogen might participate in driving polar body extrusion. Addition of E2 increased PBI extrusion to 82.44%, compared with 63.93% in the control group. However, concurrent supplementation of G15 reduced PBI extrusion to less than 60% (Table 5).
To further determine whether the PBI extrusion slowed down upon addition of G15, polar body were examined after a prolonged culture of 17 h. Results showed that PB extrusion did not increase after 5 h of prolonged culture (Fig. 6C). The ratio of PBI extrusion after 17 h of culture (56.89%) was not significantly different from the ratio at 12 h of culture (55.0%) (Tables 5 and 6). The results from the immunofluorescent assay showed that G15-treated oocytes without extruding PBI stayed in metaphase I, whether after 12 h culture or after 17 h culture (Fig. 6B,D). This testifies that G15 prevented oocytes from transiting to anaphase I from metaphase I.
Occurrence of polar body extrusion after 17 h culture

PBI extrusion of oocytes cultured in vitro for 17 h from the E2 and 10 μM G15 groups. Data are represented as the mean ± SEM.
a,bDifferent superscripts between groups in the same row indicate significant differences (P < 0.05).
Discussion
FSH regulates follicular development (Roy and Greenwald Reference Roy and Greenwald1989; Wang XN et al., Reference Wang, Roy and Greenwald1991) and follicular oestrogen biosynthesis. Granulosa cells produce oestrogen upon FSH stimulation during folliculogenesis. How does oestrogen contribute to folliculogenesis? The common factor between different ERKO mice was anovulatory. During growth of follicles, estradiol has been shown to enhance the expression of natriuretic peptide receptor B (NPR2), therefore enabling maintenance of meiotic arrest (Zhang M et al., Reference Zhang, Su, Sugiura, Wigglesworth, Xia and Eppig2011), but ambiguity still exists in whether oestrogen plays a role in other aspects such as follicle growth. For example, ovaries of some ERKO mice exhibited follicle development through the primordial, primary, and antral follicle stages (Schomberg et al., Reference Schomberg, Couse, Mukherjee, Lubahn, Sar, Mayo and Korach1999; Antal et al., Reference Antal, Krust, Chambon and Mark2008), but other ERKO mice only had a few primary follicles in their ovaries (Lubahn et al., Reference Lubahn, Moyer, Golding, Couse, Korach and Smithies1993).
Experiments in this study demonstrated that the antagonist of oestrogen, tamoxifen, counteracted follicle growth stimulated by PMSG in vivo or in vitro from the start of culture. Ovaries from adult mice were smaller after the administration of tamoxifen, due to lack of growing follicles. When preantral follicles were cultured with PMSG, more than 80% grew to >150 μm in diameter, and some continued to grow to 200 μm. After the 4-day culture, 40% of follicles were >300 μm in diameter (Fig. 3C and Table 2). Tamoxifen produced an inhibitory effect on the growth of small follicles. The inhibitory effect of tamoxifen was increased as the follicle grew larger (Fig. 3A). When follicles were cultured with PMSG plus 5 μM tamoxifen, only 5% reached >300 μm in diameter, much less than the 40% of follicles when cultured with PMSG alone. Tamoxifen strikingly inhibited follicle growth in the early stages of the preantral follicles, preventing much more follicles from growing to 300 μm. This result indicated that oestrogen is involved in follicle growth stimulated by PMSG or that the stimulatory effect of gonadotropin PMSG on follicle growth was mediated by oestrogen from the early stage of folliculogenesis. The influence of oestrogen increased as the follicle became larger in size. This may be because, as follicle grows, more FHRs are expressed on granulosa cells (Khalid et al., Reference Khalid, Haresign and Luck2000) and more oestrogen synthesized in the granulosa cells participates in cell proliferation and follicle growth.
Among the follicles with diameter below 150 μm, some had died or had shrunk (data not shown). This proportion was increased when cultured in medium supplemented with tamoxifen, compared with that in medium with PMSG alone. The dead or shrunken follicles might have been caused by apoptosis, because oestrogen has been reported to have the effect of suppressing apoptosis in early antral and preantral follicles (Billig et al., Reference Billig, Furuta and Hsueh1993; Quirk et al., Reference Quirk, Cowan and Harman2006) and of preventing follicular atresia (Britt et al., Reference Britt, Drummond, Cox, Dyson, Wreford, Jones, Simpson and Findlay2000; Dupont et al., Reference Dupont, Krust, Gansmuller, Dierich, Chambon and Mark2000). Oestrogen also contributed to telomere maintenance in ovarian granulosa cells by upregulating the genes c-Myc and TERT in vivo (Bayne et al., Reference Bayne, Li, Jones, Pinto, van Sinderen, Drummond, Simpson and Liu2011).
Some studies have demonstrated that oestrogen plays an important role in ovulation. The contribution of oestrogen is to prevent premature meiosis before the oocyte has grown fully. Mediated by nuclear receptors, oestrogen enables the maintenance of meiotic arrest by enhancing the expression of natriuretic peptide receptor B (NPR2) and natriuretic peptide type C (NPPC) (Zhang M et al., Reference Zhang, Su, Sugiura, Wigglesworth, Xia and Eppig2011). After the oocyte has grown fully, the nuclear receptors reduce following the LH surge and the meiotic arrest will be relieved. However, it is not clear what other forces are used to initiate meiosis?
In an experiment using goats, oestrogen supplementation increased the occurrence of GVBD in vitro (Zhang H et al., Reference Zhang, Wei, Gao, Ma, Yang, Zhao, Liu, Liu, Zhao and Ma2019). In this study, fully grown mouse COCs were picked 48 h after PMSG stimulation, and cultured in vitro. GVBD occurred without added oestrogen, possibly because the remaining cumulus cells contributed to some extent. But G15 supplementation did not hamper the occurrence of GVBD (Fig. 5). So GVBD of mouse oocytes might be a spontaneous process after the release from arrest.
For the reduction division, additional oestrogen is beneficial for chromosome separation, and the effect of oestrogen was inhibited by the GPR30 antagonist G15. This finding demonstrated that the transition from metaphase I to anaphase I was driven by oestrogen through the pathway of membrane receptors. These results suggest that oestrogen is actively involved in meiosis resumption of the fully grown oocyte, in addition to the maintenance of meiotic arrest during follicular growth.
In conclusion, oestrogen plays a progressive role in the two phases of follicle growth and oocyte maturation. During follicle growth, in addition to maintenance of meiotic arrest, oestrogen through the nuclear receptor promotes the follicle to grow. After the follicle has grown fully, oestrogen triggers the transition from metaphase I to anaphase I through the GPER during meiotic resumption.
Acknowledgements
This study was supported in part by the Jinan University Fund for the postgraduates training (No. 50505064).
Conflict of interest
The authors declare no conflict of interest.