


Political conflict in high-income democracies is increasingly defined by geographic divides in growth, opportunities, and skills (Boix Reference Boix2019; Ejrnæs et al. Reference Ejrnæs, Jensen, Schraff and Vasilopoulou2024; Iversen and Soskice Reference Iversen and Soskice2019). The clustering of highly skilled workers into wealthier urban areas has created new spatial economic inequalities. As socially liberal educated voters have moved into growing urban centres, populist revolts have seemingly erupted in the outlying ‘places that don’t matter’ (Maxwell Reference Maxwell2019; Rodríguez-Pose Reference Rodríguez-Pose2018). Indeed, political scientists have recognised the importance of local demographic and economic contexts for understanding political attitudes and electoral behaviour – from backlashes against immigration or globalisation to support for redistribution (Chou et al. Reference Chou, Moffitt and Busbridge2022; Colantone and Stanig Reference Colantone and Stanig2018 a; Rickard et al. Reference Rickard2020; Rueda Reference Rueda2018).
Local conditions do not just produce political reactions, but are also shaped by politics. Recent research in comparative political economy highlights the way that national political and economic institutions can shape how economic and technological change translates into local inequalities (Ansell and Gingrich Reference Ansell, Gingrich, Pierson, Thelen, Hacker and Fernandez2021; Rodden Reference Rodden2019; Wiedemann Reference Wiedemann2024).
Systematically studying the political causes or consequences of contemporary spatial inequalities requires data that both capture granular local contexts and are comparable across a broad variety of states (Giraudy et al. Reference Giraudy, Moncada and Snyder2019; Sellers Reference Sellers2019). Historically, such data have been unavailable, leaving scholars to study single countries or conduct comparative analyses using highly aggregated regional data that are unable to capture urban–rural divides or within-region variation. As such, substantial gaps remain in our knowledge regarding the nature of cross-national variation in spatial inequalities and their political consequences.
To fill these gaps, we have created the Regional Human Capital Database (RHCD). Covering twenty wealthy democracies, it contains highly localised information on educational attainment, voting, population, and migration structures from the 1980s to the 2020s.Footnote 1
This letter first reviews the limitations of existing data and then presents our dataset. We demonstrate the value of the RHCD by tackling two descriptive questions at the heart of contemporary research on the knowledge economy: (1) Are urban–rural inequalities in human capital growing everywhere? (2) Is populist voting concentrated in areas ‘left behind’ by these shifts?
In so doing, we advance three critical findings. First, there are large spatial inequalities in educational attainment within the aggregated regions that have been the focus of previous research. Secondly, urban–rural gradients vary substantially across countries, with both Scandinavian and some Anglophone countries displaying more urban-biased growth models. Thirdly, while populist voting is concentrated in places where populations have lower formal levels of education, these places are often adjacent to booming urban centres, complicating narratives about ‘left behind’ areas.
These findings demonstrate the ability of the RHCD to advance our understanding of the politics of the knowledge economy in ways which are not possible with existing comparative datasets. However, we believe that the RHCD has immense potential beyond these specific applications, enabling political scientists, sociologists, demographers, and others to advance understanding of a wide range of questions.
By outlining our approach to constructing the RHCD, this letter (and its Appendix) also provides a resource to scholars looking to construct highly localised datasets for advanced democracies. It points to existing data sources, measurement choices, and approaches to validation.
Why the Geography of Human Capital Matters to Political Scientists
Levels of educational attainment – and the geographic variation in them – are central to several critical domains of research in political science.
First, a growing body of research shows that regional inequalities – or perceptions of them – are an increasingly central feature of contemporary politics (Ejrnæs et al. Reference Ejrnæs, Jensen, Schraff and Vasilopoulou2024; Rodden Reference Rodden2019; Wiedemann Reference Wiedemann2024). High levels of human capital are a key factor behind the ability of urban agglomerations to benefit from the rise of knowledge-based industries (Glaeser and Saiz Reference Glaeser and Saiz2003; Moretti Reference Moretti2012), with critical consequences for overall regional inequality (Gennaioli et al. Reference Gennaioli, La Porta, Lopez-de Silanes and Shleifer2013). Both the level and spatial distribution of human capital vary substantially across countries, contributing to varied patterns of regional inequality (Iammarino et al. Reference Iammarino, Rodriguez-Pose and Storper2019). Yet, how both political and economic institutions shape these varied spatial distributions, and in turn, under what conditions voters actually respond to these differences, remain open questions.
Secondly, the spread of highly educated people affects the partisan composition of subnational areas. Education is a strong predictor of a cluster of political attitudes including support for immigration, opposition to some forms of redistribution, voting for green parties, and a rejection of the populist right (Attewell Reference Attewell2021; Cavaille and Marshall Reference Cavaille and Marshall2019). The literature is increasingly exploring the consequences of geographic clusters of attitudes, particularly in majoritarian systems that under-represent the preferences of voters concentrated in large cities (Arzheimer et al. Reference Arzheimer, Berning, De Lange, Dutozia, Evans, Gould, Harteveld, Hood, Ivaldi, Norman, Van Der Brug and Van Der Meer2024; O’Grady and Wiedemann Reference O’Grady and Wiedemann2024; Rodden Reference Rodden2010). In proportional systems as well, spatial clustering is producing new competitive dynamics for parties, as challenger parties on the left and the right are more or less concentrated in human capital-dense areas. Yet, outside majoritarian contexts, we know little about the connection between the spatial distribution of party support and the positions that parties adopt.
Thirdly, existing literature suggests that the distribution of educational attainment may moderate the way different aggregate shocks – political, economic, or demographic – drive changes in individual attitudes and voting. Areas with high levels of human capital have economies that tend to be more resilient to the negative shocks caused by globalisation or austerity that have often led to populist backlashes (Baccini and Sattler Reference Baccini and Sattler2025; Ballard-Rosa et al. Reference Ballard-Rosa, Malik, Rickard and Scheve2021; Colantone and Stanig Reference Colantone and Stanig2018 a). Likewise, voters may respond differently to changes such as an increase in immigration, depending on the extent to which more or less educated individuals live in their local area (Velásquez and Eger Reference Velásquez and Eger2022). Again, however, we have little systematic data that allow us to test this moderating effect.
Understanding the evolving spatial distribution of people in the knowledge economy, the consequences of this distribution for both voting and party competition, and the resilience of local areas to shocks requires data that are local, longitudinal, and comparable. The RHCD allows for an unprecedented level of granularity and comparative leverage, linking population characteristics and voting at the local level over time.
The Limitations of Existing Data
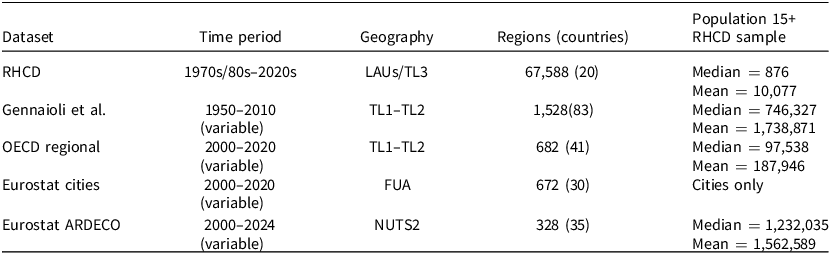
Table 1 outlines several existing attainment datasets. These existing comparative regional datasets on educational attainment have limited geographic granularity or temporal coverage, hampering cross-national research into these questions.
Comparison between RHCD and existing datasets

Data collected by Eurostat and the OECD only begin in the 2000s or 2010s, making them unsuitable for studying long-term change. Gennaioli et al. (Reference Gennaioli, La Porta, De Silanes and Shleifer2014) provide regional educational attainment data globally over a long period (1961–2011) but, like other datasets, they largely measure attainment for large administrative units (Territorial Level (TL) 1–2 in OECD nomenclature, equivalent to the European Nomenclature of Territorial Units for Statistics (NUTS) 1–2 in Europe). The RHCD measures attainment at the level of Local Area Unit (LAU) or TL3/NUTS3, discussed more below.
Aggregated units obscure the substantial geographic, demographic, and political variation between the areas that comprise them (see below, Figure 1). It is often impossible to distinguish urban cores from suburban peripheries and rural hinterlands, or to delineate economically meaningful units such as local labour markets. This aggregation means that existing datasets are of limited use when systematically examining politically important spatial distinctions that appear in nationally specific literature (see, for example, Rodden Reference Rodden2019).
Distribution of municipalities (LAUs) by level of tertiary educated population within larger regions.

Regional Human Capital Database (RHCD)
To remedy these gaps, we collect data on population structures, educational attainment, migration, and voting for twenty long-standing wealthy democracies with a population of over 1 million: Australia, Austria, Belgium, Canada, Denmark, Finland, France, Greece, Germany, Ireland, Italy, Japan, New Zealand, Norway, Portugal, Spain, Sweden, Switzerland, the United Kingdom, and the United States. Israel meets these criteria, and will be added in the future, as will the post-2000s EU member states. Data for the Netherlands are available from the mid-1990s, but are of lower quality (see Appendix). Our data range from the 1970s, 1980s, or 1990s to the present. We are adding additional data from the 2020s as they become available.
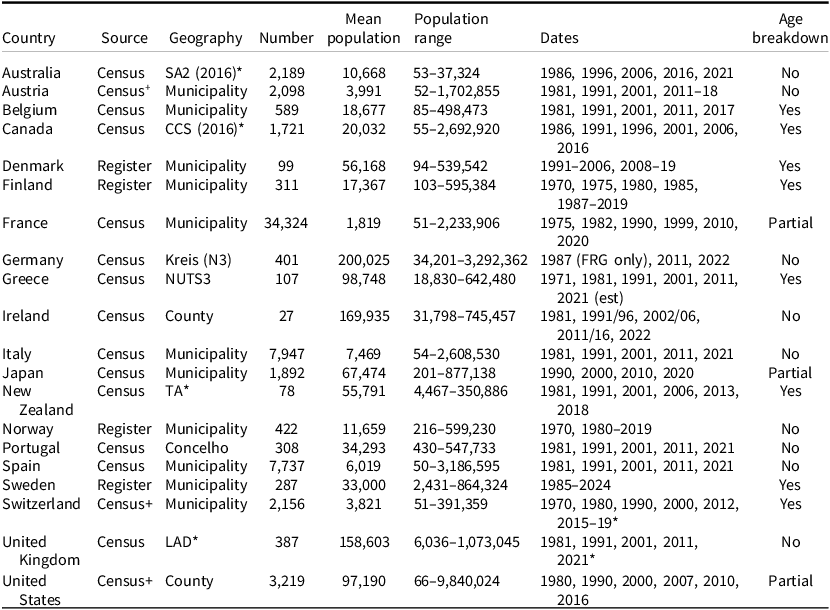
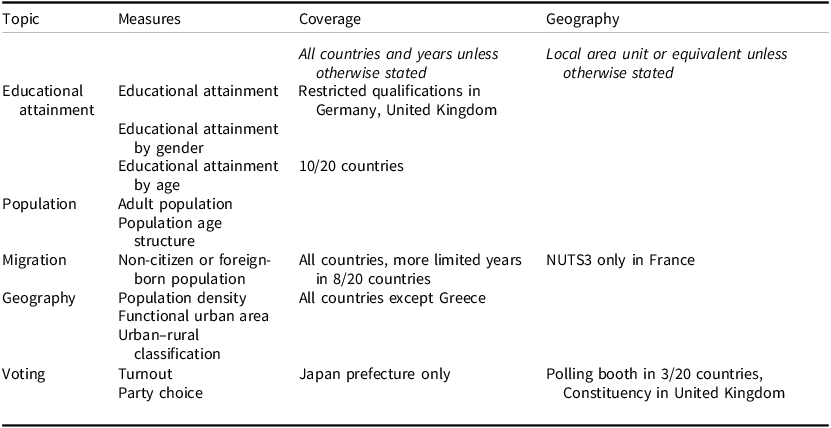
We draw on national censuses, population registers, and large household surveys, as these are the only sources with sample sizes that allow detailed geographical breakdowns. Table 2 summarises our geographical and temporal coverage. Due to data confidentiality restrictions, we use published aggregate data, harmonising geographical boundaries, educational qualifications, and age distributions to ensure comparability. We discuss our approach below, with an extensive appendix documenting our sources and coding decisions. There are a range of variables available in the RHCD (see Table 3 for details), but the following sections focus on explaining our approach to measuring educational attainment since it represents our most novel contribution.
Overview of RHCD

Note: number and population of units given in 2011 or closest year. Cases with <50 population not included. For the United Kingdom, we have data for Great Britain only.
*Australian units are Statistical Area 2 (SA2), in Canada we measure attainment at the Consolidated Census Subdivision (CCS), the Territorial Authority (TA) in New Zealand, and Local Authority District (LAD) in the UK.
+For the United States and Switzerland, we draw on survey data in more recent waves. Austria has moved to a register-based approach.
Variables available in the Regional Human Capital Database

Geographical Units
In order to reveal patterns across different types of areas (for example, cities v. suburbs) within the same region, the RHCD reports attainment at the lowest reliable level available. Our core unit is the local area unit (LAU), the base unit of European geography, which generally corresponds to the lowest level of local government. In Ireland, we collect data at a scale between LAU and NUTS3. For Greece, we only have data at the NUTS3 level, but disaggregate the urban areas of Athens and Thessaloniki. Data at LAU level are not available for Germany, restricting us to the Kreis (NUTS3). In non-European cases, we choose units approximately equivalent in size and/or function to LAUs: administrative units in the United States (counties) and New Zealand (territorial authorities and wards), and census statistical units in Australia and Canada. These units are nested in Organisation for Economic Co-operation and Development (OECD) statistical hierarchies, and can often be matched to local labour markets (commuting zones) that cross administrative boundaries. Where available, we include supplementary data breaking apart major urban units into smaller areas. To maintain data protection, we do not report units with populations below fifty.
We harmonise all geographic units to 2018 boundaries (2022 for Japan), with version 2 of the dataset providing the 2022 boundaries. In most countries, only a fraction of boundaries change over time, but in some cases, like Denmark in 2007, there has been a radical overhaul of the municipal structure. The dominant trend since the 1970s has been one of consolidation. We combine historical units to match 2018 (2022) boundaries. Where LAUs split (for example, the Roman suburb of Fiumicino), we back-estimate the current unit by assigning it a share of the older merged unit based on population ratios. The result is that we have disaggregated stable units over long periods of time.
LAUs are not perfect units: they vary dramatically in size, population, and functions both between and within countries (see limitations for further discussion). Nonetheless, we believe they are a suitable choice for several reasons: (1) in most countries they increase the number of cases and reduce their average population by an order of magnitude or more when compared to TL1/TL2 units; (2) this increased granularity enables re-aggregation to various theoretically relevant units that are nested within or cut across TL1/2 unit boundaries – these units may be comparable across countries in certain cases where LAUs are not; and (3) The LAU is a widely adopted geographical standard, used for example in the OECD’s recently developed Local Data Portal, making it easy for users to link the RHCD to other datasets.
Educational Qualifications and Population Structures
National education systems differ in how they structure and report qualifications. To facilitate cross-national comparisons, we harmonise qualifications to the International Standard Classification of Education (ISCED) 2011. We distinguish ISCED 0–2 (no formal education, primary, lower secondary), ISCED 3–5 (upper secondary, non-tertiary vocational, short-cycle tertiary), and ISCED 6–8 (bachelor’s degree or equivalent, master’s, PhD). Overall, the ISCED 6–8 category is most consistently measured across countries. We are unable to consistently distinguish qualifications below ISCED 6 for Germany and the United Kingdom. The broad ISCED categories omit important detail regarding the subject of study and vocational or academic orientation of qualifications, but they capture high-level variation in the distribution of human capital within countries. They also reliably measure the spatial distribution of people with a university education, which is increasingly important in the knowledge economy.
In some cases, national measures combine qualifications that cut across ISCED boundaries. The most common problem emerges around short-cycle tertiary education (ISCED 5), which some countries combine with long-cycle tertiary education (ISCED 6–8). Where this problem arises, we estimate the share of those with ISCED 4–5 and 6–8 qualifications (see Appendix).
We measure attainment across the full population aged 15+, disaggregated by gender. Our choice to examine the 15+ population differs from the OECD or Eurostat (which measure attainment for the 25–64 year old population) but is in line with Barro and Lee (Reference Barro and Lee2013). Attainment of the 15+ population is more reliably reported for small areas than the working-age population. In eight cases we have detailed age breakdowns (Table 2).
While data covering those aged 15+ is widely available, some countries report educational qualifications over different age ranges (for example, 16+, 15–69). To address these differences, we either ‘add’ or ‘subtract’ age groups by drawing on population data with a detailed age breakdown, and estimate the level of attainment among the missing groups using alternative data sources (see Appendix).
Demographics, Voting, and Urban Form
To complement our measures of educational attainment, we also gather census/register data on the population age distribution and the share of the population who are foreign born/non-citizens. We harmonise voting in national elections from the 1980s or 1990s to the present at the same geographic level. This approach provides a more disaggregated measure of local party choice and turnout than existing cross-time datasets, such as Kollman et al. (Reference Kollman, Hicken, Caramani, Backer and Lublin2017). Huijsmans and Rodden (Reference Huijsmans and Rodden2025) have developed similarly disaggregated election results, although we choose to use stable units, allowing us to compare the same places over time.
To measure urban form, we draw on the OECD Functional Urban Area classification, which classifies LAUs in areas with a densely populated urban core based on commuting patterns. We use the Eurostat TERCET typology (and non-European equivalents) to further distinguish between towns and rural areas. Combining these sources gives a five-category urban classification: major city and core suburbs; outskirts of major cities; metropolitan areas; medium sized areas; rural areas and towns. We also measure population density, and, for units within a functional urban area, the geographic distance from the unit to the centre of the core city. Table 3 summarises the full range of variables available in the RHCD.
Potential for Data Linkage
One of the main strengths of the RHCD is the ease with which it can be linked to a wide range of other datasets because it is built on standardised geographical units (LAUs). Linakages could include geocoded survey datasets with measures of political attitudes and behaviour (such as household panel surveys in the United Kingdom, Germany, and Switzerland, and some national election studies), and highly granular measures of local context such as income (Mikou et al. Reference Mikou, Vallet and Guivarch2024) and innovation (De Rassenfosse et al. Reference de Rassenfosse, Kozak and Seliger2019), as well as transport connectivity, public services, and natural environment from the OECD Local Data Portal.
RHCD data can also be aggregated to a range of other statistical geographies, such as the the OECD-TL3/2 level (NUTS2/3) geographies at which measures of regional GDP per capita, employment, and industrial structure are available. The granular nature of the RHCD also enables aggregation to less commonly used geographies that will be relevant for many important questions, including Functional Urban Areas or nationally specific measures of commuting zones, and areas in close proximity to current or historical borders for spatial regression discontinuity designs.
Comparison to Existing Data
We validate our measures of educational attainment against those from existing comparative regional databases at higher levels of aggregation. Our estimates of the share of the adult population degree educated (ISCED 6–8) are highly correlated with regional data from Gennaioli et al. (Reference Gennaioli, La Porta, De Silanes and Shleifer2014) (r = 0.81), Eurostat data on Functional Urban Areas (r = 0.81) and NUTS2 regions (r = 0.84), and OECD regional data (r = 0.69). Our data reliably track existing regional attainment data (see appendix for further details).
However, the principal advantage of the RHCD lies in its ability to uncover variation within large regions. To illustrate this advantage, Figure 1 plots the share of the adult population of four countries possessing tertiary education (ISCED 6–8) at two levels of aggregation: the LAU and TL2 regions. It demonstrates that within a TL2 region, there is substantial variation among LAU in the share of the population with tertiary education, leading to overlapping distributions between regions with very different average levels of attainment. We employ multilevel models to estimate the share of variation in educational attainment within countries that is accounted for by TL2/TL3 regions (see Appendix). These models show that between 20 and 40 per cent (depending on decade) of the within-country variation in degree level attainment is at the regional level – suggesting much variation in attainment is at smaller geographical levels. Examining the regional level alone substantially understates disparities between the most and least educated places. The disaggregated data, by contrast, allow us to look at patterns of agglomeration, spillovers, and long-term change or persistence at much more localised levels.
Applications
What, then, can we learn by using the highly disaggregated RHCD? We present two applications that address important descriptive questions about the political economy of the knowledge economy. Our analyses reveal substantial cross-national heterogeneity that would not be visible using existing comparative data.
Question 1: Are Urban–Rural Divides Growing Everywhere?
Contemporary work in political science points to new urban–rural electoral cleavages emerging in some – but not all – advanced democracies (Harteveld et al. Reference Harteveld, Van der Brug, de Lange and Van der Meer2022; Huijsmans and Rodden Reference Huijsmans and Rodden2025; Luca and Kenny Reference Luca and Kenny2024; Taylor et al. Reference Taylor, Lucas, Armstrong and Bakker2023). Where these cleavages have emerged, scholarship has linked new political shifts to underlying economic and social changes related to the rise of urban-concentrated knowledge-intensive industries (Glaeser Reference Glaeser2011; Moretti Reference Moretti2012). However, these heterogeneous political divides raise two key questions: (1) to what extent do we see growing urban–rural divides in human capital across countries? (2) To what extent do these divides overlap with political ones? This section examines the first question, and the second application turns to the second question.
We first use the RHCD to examine the evolution of urban–rural gaps in the concentration of residents with higher levels of education. Figure 2 plots the population-weighted percentage of the adult population with tertiary education (ISCED 6–8) by country and year, distinguishing areas based on our five-category urban–rural classification. Figure 3 shows similar patterns when disaggregating areas by population density.
Urban–rural gradients in per cent of adult population tertiary educated by country and year.

Per cent of adult population tertiary educated in population-weighted quantiles of density by country and year.

Urban–rural gradients vary widely across countries. Some countries – Australia, Canada, and the Nordic states – exhibit strong and growing urban–rural differences. However, these gaps are much smaller in Belgium, Italy, Switzerland, and the United Kingdom. In Belgium and Switzerland, narrower urban–regional gaps stem from the low share of people with tertiary education and a more even spatial distribution. By contrast, in Italy and the United Kingdom they result from heterogeneity in the compositions of large cities: attainment in Naples is much lower than in Milan, and attainment in London is much higher than in the West Midlands (see Appendix) (McCann Reference McCann2016). These urban–rural gaps translate into large, and growing, absolute (but not necessarily relative) inequalities in the distribution of the highly educated (see Appendix).
Our findings show that there is substantial cross-national heterogeneity in the degree to which large urban agglomerations are distinct from other areas. They also suggest that similar patterns of spatial inequality in educational attainment can arise in otherwise very different contexts, like Scandinavia and Australia. Conversely, more similar political economies, such as those of the United States and the United Kingdom, do not necessarily produce urban–rural gaps of the same magnitude. A combination of urban structure and wider political economy both shape whether growth is concentrated in cities, and which cities gain from these shifts. Future research should investigate the extent to which urban–rural gaps can be explained by political choices in education policy (Valero and Van Reenen Reference Valero and Van Reenen2019), public investments in research (Barnes Reference Barnes2021), housing and urban planning (Chou and Dancygier Reference Chou and Dancygier2021; Trounstine Reference Trounstine2020), or past industrial or regional policies (Lee Reference Lee2024).
Question 2: Where Are the ‘Places That Don’t Matter’?
Much recent work links spatial disparities in economic outcomes to new political divides. Rodríguez-Pose (Reference Rodríguez-Pose2018) characterises rising populism as the ‘revenge of places that don’t matter’, arguing that weak regional economic performance is closely linked to populist voting. Do rising tides lift all boats? Or do low attainment areas in high growth regions look like low attainment areas elsewhere? Recent work by Patana (Reference Patana2022) argues that there is substantial variation within urban areas. The RHCD allows us to improve on the large regions (Colantone and Stanig Reference Colantone and Stanig2018 b) and short time frames (Dijkstra et al. Reference Dijkstra, Poelman and Rodríguez-Pose2020) used in existing comparative research and ask these questions.
Figure 4 plots the association between local tertiary attainment and right-populist voting in four recent legislative elections (see the Appendix for similar plots in other European countries). The plot distinguishes the relationship in the functional urban areas of major cities from the rest of their country. It demonstrates two features that challenge the idea that right-populist voting is driven by the resentments among those living in peripheral regions.
Association between populist-right voting in legislative elections and educational attainment. Binned scatterplot in deciles of per cent degree educated. Estimates weighted by number of voters, and population weights used to construct decile bins.

First, as previous research suggests, in France and Sweden there is a strong negative association between local educational attainment and right-populist voting, but this relationship is weaker in the United Kingdom and non-existent in Spain in the 2010s. These differences may reflect varying temporal patterns of voter mobilization, or more enduring differences in the distribution of inequalities of opportunity and income in some economies than in others.
Secondly, there is a strong negative association between education and populist-right voting even within the areas around Europe’s most economically dynamic cities, such as London, Paris, and Stockholm, and secondary centres like Lyon. A similar conclusion holds when comparing LAUs to NUTS2 regions (see Appendix) – the association between education and populist-right voting is at least as strong within NUTS2 regions as between them. In other words, being in a booming region does not necessarily inoculate less educated areas from populism, and the relationship between local context and right-populist voting exists even within the places that ‘do’ matter.
Previous work shows that economic shocks galvanise a populist response by raising sociotropic concerns about local economic decline (Colantone and Stanig Reference Colantone and Stanig2018 a; Rodríguez-Pose et al. Reference Rodríguez-Pose, Terrero-Dávila and Lee2023). Yet our findings suggest that a populist backlash can arise even when opportunities remain plentiful in the broader region. These findings raise new questions as to why the spatial distribution of populist voters varies across countries, and how places with different baseline levels of human capital respond to trade or policy shocks.
Limitations
It is important to acknowledge the limitations of our data. First, we are not measuring the performance of local education systems. The RHCD measures the attainment of adults in an area at the time of data collection. Some of these residents were educated locally and others are internal/external migrants. Future research should assess the role of local educational supply relative to sorting processes.
Secondly, countries vary widely in their administrative geographies, leading to differences in the number and size of LAUs. Some countries have LAUs with a high average size and narrow population range (for example, the United Kingdom, Ireland), while in others (such as France), area populations vary over many orders of magnitude. We weight all estimates by population size, and find no evidence that urban–rural or density gaps in education vary across countries with different numbers of cases or average population sizes (see Appendix). Nonetheless, this heterogeneity may impact the validity of cross-national comparisons due to the modifiable area unit problem (Lee and Rogers Reference Lee and Rogers2019). However, these differences also raise interesting questions about how the fragmentation of local government may shape the concentration of human capital.
Conclusion
The geography of educational attainment is central to the politics of high-income democracies. However, comparative research on these topics has been hampered by data with limited spatial precision and temporal coverage. To address this gap, we present the RHCD, containing harmonised and spatially precise measures of local educational attainment, demographics, urban form, and voting for twenty high-income democracies. Our data shed light on questions ranging from urban–rural disparities to the geography of populist voting.
We find substantial cross-national heterogeneity in the spatial concentration of skills. This finding suggests that conclusions about growing regional inequalities in the knowledge economy that are derived from single-country studies (most commonly the United States) may not generalise well to other institutional contexts. Our data also raise questions about influential claims that populist-right voting in Europe reflects a backlash among those living in large-scale regions that have experienced economic decline. Instead, we find strong evidence that variation in human capital is associated with voting patterns even within advantaged regions. This shows the ability of the RHCD to push forward comparative research on the political geography of growth and inequality in the knowledge economy, by revealing patterns that would be obscured in other comparative datasets.
However, these applications only hint at the full potential of the RHCD for scholars in political science and beyond. The combination of highly granular, longitudinal, and comparative measures of educational attainment, demographics, urban form, and voting could shed light on an enormous range of questions about how spatial inequalities shape, and are shaped by, institutional and political context. We look forward to seeing what researchers do with our data.
Supplementary material
The supplementary material for this article can be found at https://doi.org/10.1017/S0007123426101513.
Data availability statement
Replication data for this article can be found in Harvard Dataverse at: https://doi.org/10.7910/DVN/941WKY.
Acknowledgements
The authors thank Yi Jael Tan for research assistance. We thank participants at workshops at Harvard (2025), Humboldt University (2024), the University of Oxford Department of Social Policy and Intervention, and members of the Canadian Institute for Advanced Research IEP programme, as well as staff at multiple national statistical agencies, for help in conceptualising and developing this project. All errors remain our own.
Financial support
Research for this article is supported by funding from the European Research Council (ERC) through a Starting Grant for the project The Transformation of Post-War Education: Causes and Effects (SCHOOLPOL) (grant number 759188).
Competing interests
None.
Ethical standards
The underlying data used to produce the RHCD are available from existing public databases and have been reproduced in accordance with data holders’ rules on distribution.



 Open access

