
1. Introduction
Many situations in nature or in industries involve mixing a diffusive scalar in a sheared particulate suspension. The transport of oxygen or drugs by blood (Kabacaoğlu, Quaife & Biros Reference Kabacaoğlu, Quaife and Biros2017; Kaoui Reference Kaoui2018; Berg et al. Reference Berg, Davit, Quintard and Lorthois2020), of nutrients inside the cell cytoplasm (Goldstein & van de Meent Reference Goldstein and van de Meent2015), of adjuvants in concretes or of heat in some exchangers (Dbouk Reference Dbouk2018; Yousefi et al. Reference Yousefi, Ardekani, Picano and Brandt2020) provide a few examples illustrating the importance of this problem, which still lacks a fundamental description. So far, the enhanced transport properties of sheared suspensions have been described mostly at a macroscopic scale through an effective diffusion coefficient (Metzger, Rahli & Yin Reference Metzger, Rahli and Yin2013; Souzy et al. Reference Souzy, Yin, Villermaux, Abid and Metzger2015; Thøgersen & Dabrowski Reference Thøgersen and Dabrowski2017).
This work adopts a completely different approach by developing a microscopic description of the mixture, which enables one to predict the evolution of the scalar concentration distribution. These developments have been made possible by the recent convergence of three key elements. First, the existence of a theoretical framework – the so-called lamellar approach – which envisions a mixture as a set of stretched lamellae, possibly interacting with each other, and provides the tools to tackle complex mixing problems from the sole knowledge of their dispersion and stretching kinematics (Ranz Reference Ranz1979; Duplat, Innocenti & Villermaux Reference Duplat, Innocenti and Villermaux2010; Le Borgne, Dentz & Villermaux Reference Le Borgne, Dentz and Villermaux2015; Villermaux Reference Villermaux2019). Second, the recent experimental determination of the stretching laws in sheared suspensions, which has revealed that fluid material lines undergo exponential and log-normally distributed elongations (Souzy et al. Reference Souzy, Lhuissier, Villermaux and Metzger2017). Third, the recent development of experimental techniques giving access to the finest scales of a concentration field (Souzy et al. Reference Souzy, Zaier, Lhuissier, Le Borgne and Metzger2018).
Our study focuses on the evolution of an initially segregated blob of dye sheared in a suspension of non-Brownian particles, in the limit of vanishing Reynolds number. We show that the mixture successively goes through a solitary-strip regime, a coalescence regime and a final dispersion regime. We systematically investigate this evolution for two different Péclet numbers and provide predictions for the concentration distributions and the transitions between these successive stages of mixing.
2. Experimental set-up
The experimental set-up, sketched in figure 1(a), is similar to the one used in Souzy et al. (Reference Souzy, Zaier, Lhuissier, Le Borgne and Metzger2018). A transparent suspension containing a blob of dyed liquid is deformed in a pure shear flow and the mixing of the dye is measured by monitoring a slice of the suspension perpendicular to the vorticity direction.
(a) Schematic of the experimental set-up. (b) Transverse view of the injection system used to form a thin cylindrical blob of dyed liquid. (c) Picture of the blob cross-section at strains  $\gamma =0$ and
 $\gamma =5$ for
 . The initial blob size is
 $2s_0\approx 200\ \mathrm {\mu }\textrm {m}$ by
 $2l_0\approx 300\ \mathrm {\mu }\textrm {m}$. The intersections of the particles with the light sheet are highlighted in grey.

2.1. Suspension, blob of dye preparation and shear flow
The shear cell consists of two Plexiglas plates separated by a 3 mm gap filled with the suspension. The suspension is composed of transparent and almost monodisperse poly(methyl methacrylate) (PMMA) spheres, with diameter  $d = 335\pm 30\ \mathrm {\mu }\textrm {m}$, immersed in a Newtonian liquid. The liquid is a mixture of Triton X-100 (75.15 wt%), zinc chloride (14.24 wt%), water (10.34 wt%) and nitric acid (0.27 wt%) with a density and a refractive index matching those of the particles. The mixture has a high viscosity (
 ${\approx }4\ \textrm {Pa}\ \textrm {s}$), which ensures that inertial effects are negligible. The particulate volume fraction of the suspension is set to
 $\phi =0.30$.
Prior to shearing the suspension, the dyed liquid is injected with a syringe in the neutral plane of the shear cell forming an almost cylindrical blob aligned with the  $y$-vorticity direction; see figure 1(b). The syringe's needle has a diameter of
 $500\ \mathrm {\mu }\textrm {m}$, but thinner blobs are produced in a controlled way by withdrawing the syringe body and piston at different velocities; see figure 1(b). For all experiments, the blob initial transverse dimensions,
 $2s_0 \approx 200\ \mathrm {\mu }\textrm {m}$ and
 $2l_0 \approx 300\ \mathrm {\mu }\textrm {m}$, are comparable with the particle diameter; see figure 1(c). The injected blob is composed of the suspending fluid, to which a small amount (
 $C_{0}=7.5 \times 10^{-7}\ \textrm {g}\ \textrm {ml}^{-1}$) of fluorescent dye (Rhodamine 6G) is mixed. This protocol of injecting a fluorescent liquid in a non-fluorescent suspension has been preferred to the inverse configuration used by Souzy et al. (Reference Souzy, Lhuissier, Villermaux and Metzger2017), where all the suspension is fluorescent, except for a dark blob obtained by locally photo-bleaching the dye. While the latter technique provides an accurate control of the blob shape, the larger amount of fluorescence in the cell strongly decreases the signal-to-noise ratio of the concentration measurements (
 ${\approx }10$ versus
 ${\approx }1000$ for dye injection). Following Souzy et al. (Reference Souzy, Lhuissier, Villermaux and Metzger2017), the molecular diffusion coefficient of the dye,
 $D$, is measured from the evolution of blobs of dye sheared in the fluid mixture alone (without particles). This procedure yields
 $D=6.0\times 10^{-13}\ \textrm {m}^{2}\ \textrm {s}^{-1}$.
Promptly after blob injection, the suspension is sheared with a rate  $\dot {\gamma }$ by moving the plates of the shear cell in opposite directions using two high-precision translation stages (not shown in the schematic). The travel range of the plates sets the maximum strain
 $\gamma \equiv \dot {\gamma } t = 40$. Two sets of experiments are conducted for
 $\dot {\gamma } = 0.00714$ and
 $0.714\ \textrm {s}^{-1}$, i.e. for values of the Péclet number,
 , of 85 and 8500, respectively. For each Péclet number, the experiments are repeated seven times.
2.2. Dye concentration measurements
Imaging is performed using a laser source (Laser Quantum Gem512, 2.5 W,  $\lambda =532\ \textrm {nm}$) turned, through a series of lenses, into a thin laser sheet (with thickness
 $10\text {--}15\ \mathrm {\mu }\textrm {m}$). The sheet illuminates the flow-gradient plane (
 $xz$) at a distance of 20 particle diameters from the sidewall (approximately twice the gap width). The dye located in the illuminated plane fluoresces and re-emits light at a longer wavelength (
 $\lambda \approx 600\ \textrm {nm}$) with an intensity proportional to the dye concentration,
 $C$. Although the refractive indices of the liquid and the particles cannot be strictly matched for both wavelengths with a ternary mixture (since the densities have also to be matched), we manage to match all indices to the fourth digit by tuning the temperature of the set-up (
 $25.5 \pm 0.3^{\circ }\textrm {C}$) with a thermal bath. A high-pass filter (590 nm) is used to eliminate incident light and collect only the fluorescence signal emitted by the dye. To further reduce the background brightness, a light-trap, consisting of razor blades stacked with their cutting edges facing the laser sheet, is placed at the bottom of the shear cell (see figure 1b), which prevents spurious reflections of the incident laser light.
Images are recorded with a high-resolution, low-readout-noise camera (Hamamatsu C11440) combined with a long-distance macroscope (Leica Z16 APO  $\times$1), which provides a resolution of
 $3.3\ \mathrm {\mu }\textrm {m}\ \textrm {pixel}^{-1}$ and a field of view of
 $6.8\ \textrm {mm} \times 6.8\ \textrm {mm}$; see figure 1(c). During an experiment, the exposure time is progressively increased to adapt the dynamic range of the camera to the overall decay of the dye concentration. This procedure allows us to resolve the concentration field over longer times and over a broader concentration range. Photo-bleaching of the dye by the incident laser sheet is minimized by using a moderate laser power (300 mW), by capturing only one picture every strain unit, and by using a shutter synchronized with the camera to block the incident laser light between exposure periods. This limits the total exposure time to less than 4 s over the whole experiment and ensures that the loss of fluorescence due to photo-bleaching remains below
 $3\,\%$. Last, the concentration field is obtained from the raw images according to
 $C(x,z)/C_0 = (I(x,z) - I_b ) / (I_0-I_b)$, where
 $I_b$ is the background noise intensity, and
 $I_0$ and
 $C_0$ are the maximum intensity and the maximal concentration at
 $t=0$, respectively.
3. General observations
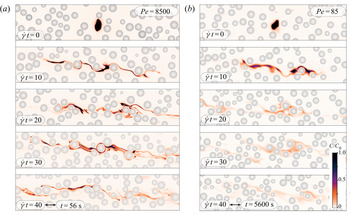
Figure 2 compares, at equal strains, the typical evolution of the dye concentration field obtained for the two Péclet numbers investigated. On a global scale, the blob of dye is stretched by the mean flow and aligns with the mean flow direction ( $x$), while it is dispersed in the transverse direction by the fluctuations of the flow induced by the particles. On a smaller scale, the flow stretches and folds the dyed liquid into thinner lamellar structures, which are eventually blurred by molecular diffusion. At a given strain, the spatial dispersion of the lamellae appears to be similar between the two Péclet numbers. By contrast, the process of mixing is much more advanced for the lowest Pé, consistently with the longest time over which diffusion operates for a smaller shear rate: while most lamellae are still thin and sharp at
 $\gamma = 30$ for
 , they are broader and already significantly blurred for
 .
Blob of dye in the sheared suspension. Dye concentration field for (a)  and (b)
 shown for identical strains
 $\gamma \equiv \dot {\gamma }t$ (see also supplementary movie 1 available at https://doi.org/10.1017/jfm.2021.270).

Figure 3 presents the evolution of the corresponding concentration distributions,  $P(C)$. The concentration distribution is obtained from all the pixels where the concentration level is above the threshold value,
 ${C_{th}}$, which corresponds to the background noise. The value of
 $C_{th}$ is adjusted by hand to delineate the lamellae contour. Its value decreases slowly with increasing deformation; however, this does not affect the shape of the distribution above
 $C_{th}$. Initially,
 $P(C)$ has the characteristic U-shape of a segregated system, with a peak at the blob initial concentration,
 $C/C_0=1$. As the blob is stretched and mixes with the surrounding liquid, the probability of the large concentrations decays. At equal strains, the steeper decay of the distributions at large concentration observed at low Péclet number indicates a more advanced mixing. In the following, we provide a theoretical framework to describe the evolution of these concentration distributions.
Evolution of the concentration distribution for (a)  and (b)
 . Symbols: experimental data. Lines: solitary-strip model,
 $P_{{SS}}(C)$ (4.6), with
 $f=0.30$ and
 $g=0.21$. Solid lines highlight strains (
 $\gamma \leq 18$ and
 $\gamma \leq 10$ for (a,b), respectively) for which the number of overlaps is expected to be small (
 ${{\mathcal {S}}}/{{\mathcal {A}}}\leq 1$; see text). Dashed lines are used at larger strains. Insets: same in double-logarithmic scales. Each distribution is obtained by averaging seven independent runs.

4. Solitary-strip model
At sufficiently short times, the blob of dye forms thin lamellae, which are essentially isolated from each other and which we call hereafter elementary lamellae. Each elementary lamella results from the stretching induced by the combination of the mean and fluctuating components of the flow. Assuming (in line with the solitary-strip framework (Villermaux Reference Villermaux2019)) that the stretching rate over each lamella cross-section is uniform at each time, the probability distribution of the lamella elongations is set by that of the fluid material lines. In a previous work (Souzy et al. Reference Souzy, Lhuissier, Villermaux and Metzger2017), this elongation distribution has been shown to follow a log-normal statistic given by
 \begin{equation} P(\rho)=\frac{1}{\sqrt{2{\rm \pi}}\,\sigma\rho} \exp\left({-\frac{(\ln\rho-\mu)^{2}}{2\sigma^{2}}}\right), \end{equation}
where the elongation,  $\rho (t)$, is the ratio of the current material line length to its initial length, and both the mean value,
 \begin{equation} \mu \equiv \langle\ln\rho \rangle=f \gamma, \end{equation}
and the variance,
 \begin{equation} \sigma^{2} \equiv \langle\ln^{2} \rho\rangle - \langle\ln\rho \rangle^{2} = g \gamma, \end{equation}
of the logarithm of the elongation grow linearly with strain, with coefficients  $f\simeq 0.193$ and
 $g\simeq 0.174$ for
 $\phi =0.30$ (Souzy et al. Reference Souzy, Lhuissier, Villermaux and Metzger2017).
To compute the concentration distribution of the whole blob of dye, we first derive the concentration distribution of each of its lamellar portions. For a slender portion of lamella with elongation  $\rho (\gamma )$, the combined advection and diffusion of the dye transversely to the lamella follows the pure diffusion equation,
 $\partial _\tau C = \partial _\eta ^{2} C$, in terms of the dimensionless time scale
 and length scale
 $\eta = \rho h$, with
 $h$ the distance to the lamella midplane (Ranz Reference Ranz1979; Rhines & Young Reference Rhines and Young1983; Meunier & Villermaux Reference Meunier and Villermaux2003; Souzy et al. Reference Souzy, Zaier, Lhuissier, Le Borgne and Metzger2018). Assuming that this portion of lamella has an initially Gaussian concentration profile and experiences a constant elongation rate (
 $\dot {\rho }/\rho =\ln \rho /t= \textrm {const.}$), its profile evolves as
 $C = {C_{m}}\, \mathrm {e}^{-h^{2}/2s^{2}}$, where the half-width, maximal concentration and dimensionless time follow, respectively,

The concentration probability distribution of this portion of lamella above the threshold concentration  ${C_{th}}$ is obtained from the change of variable
 $P_{G}(C) = |\mathrm {d} h/\mathrm {d} C|/h_{th}$, with
 $h_{th}$ the distance from the lamella midplane at which
 $C(h_{th}) = {C_{th}}$. This yields
 \begin{equation} P_{G}(C,{C_{m}}) = \frac{1}{2C\sqrt{\ln\dfrac{{C_{m}}}{{C_{th}}}}\, \sqrt{\ln\dfrac{{C_{m}}}{C}}},\quad \text{for}\ {C_{th}} \leq C\leq {C_{m}} \end{equation}
(see Souzy et al. (Reference Souzy, Zaier, Lhuissier, Le Borgne and Metzger2018) for details of the calculations).
As long as the different portions of the lamellae do not overlap with each other, the solitary-strip concentration distribution,  $P_{{SS}}(C)$, for the whole blob of dye is obtained by summing the contributions of the different lamella portions. It is expressed as
 $P_{{SS}} \propto \int _0^{\infty } 2h_{th} \rho l_0 P(\rho ) P_{G}(C,{C_{m}})\,\mathrm {d}\rho$, where
 $2h_{th}\rho l_{0}$ is the area of a portion (in the
 $xz$-plane) and
 $P(\rho )$ is the probability, given by (4.1), that a portion has the elongation
 $\rho$. Using
 $h_{th}=(s_{0}/\rho ) \sqrt {(1+2\tau )\ln ({C_{m}}/{C_{th}})}$, the concentration distribution becomes
 \begin{equation} P_{{SS}}(C) = A^{{-}1} \int_0^{\infty}\! \frac{\sqrt{1+2\tau}}{C \sqrt{\ln\dfrac{{C_{m}}}{C}}} \, P(\rho)\,\mathrm{d}\rho, \end{equation}
with  $A = 2\int _0^{\infty } \sqrt {1+2\tau } \sqrt {\ln ({C_{m}}/{C_{th}})} P(\rho )\,\mathrm {d}\rho$ a normalizing constant.
Figure 3 compares the solitary-strip prediction (4.6), with  $f=0.30\pm 0.03$ and
 $g=0.21\pm 0.03$ as adjustable parameters, to the experimental results. The fit is performed on the low-Péclet-number data (
 , for which the minimal lamella width, given by the Batchelor scale
 , is well resolved), and up to a strain
 $\gamma =12$ (in order to have a limited influence of coalescence).
The model captures well the shape of the concentration distributions and the progressive decay of the concentration levels, for both Péclet numbers and up to a strain  $\gamma \approx 12$ for
 and
 $\gamma \approx 16$ for
 . The fitted values of
 $f$ and
 $g$ are also in reasonable agreement with the experimental values determined previously by Souzy et al. (Reference Souzy, Lhuissier, Villermaux and Metzger2017) (i.e.
 $f\simeq 0.193$ and
 $g\simeq 0.174$). The difference is possibly related to the fact that the stretching laws measured by Souzy et al. (Reference Souzy, Lhuissier, Villermaux and Metzger2017) were obtained from a two-dimensional section of a three-dimensional flow field, which may have slightly underestimated the actual three-dimensional elongation experienced by the lamellae. Note also that the agreement found at large
 is somehow unexpected since the minimum lamella width,
 , is below the spatial resolution of the set-up (
 $3.3\ \mathrm {\mu }\textrm {m}$). At larger strains, the solitary-strip model fails to describe the concentration distributions. This is better appreciated in the double-logarithmic plots shown in the insets of figure 3, which allow one to compare the concentration distributions at long times. The experimental concentration levels are found to decay much slower than anticipated by
 $P_{{SS}}$. This is consistent with the increasing interaction between lamellae. The solitary-strip framework no longer applies when lamellae significantly overlap with each other (see figure 2 and Movie 1). Overlapping lamellae add up their concentration levels, which slows down the global concentration decay relative to non-overlapping lamellae. A relevant model of the concentration distributions at high strains thus calls for a description of coalescence.
5. Coalescence model
Overlaps between lamellae necessarily occur because the unfolded area of the blob grows exponentially and eventually becomes larger than the dispersion envelope in which the blob develops. Indeed, the length of the elementary lamellae,  $2\langle {\rho }\rangle l _0$, increases exponentially, while, after a short initial contraction, their width
 $s$ is locked at the Batchelor scale,
 $s_B\sim \sqrt {D/f\dot {\gamma }}$, at which the transverse compression rate
 $\sim f\dot {\gamma }$ is balanced by the diffusive broadening rate
 $\sim D/s^{2}$; see (4.4a–c). The non-overlapping blob area thus increases exponentially as
 ${{\mathcal {S}}} \sim s_B\,l_0\ \textrm {e}^{f\dot {\gamma } t}$. On the other hand, the dispersion envelope grows from the combined effect of the mean flow and of the Fickian dispersion induced by the fluctuating motion of the particles. for
 , the area of dispersion, which is illustrated in figure 4(a) by overlaying the concentration fields of seven experiments, increases algebraically with time according to
 \begin{equation} {{\mathcal{A}}} = {\rm \pi}\sqrt{[l_0^{2}+2\kappa t][s_0^{2}+2\kappa(t+\dot{\gamma}^{2} t^{3}/3)]} \sim \kappa\dot{\gamma} t^{2}, \end{equation}
where  $\kappa \approx 0.017 \phi \dot {\gamma } d^{2}$ is the shear-induced dispersion coefficient (Metzger et al. Reference Metzger, Rahli and Yin2013; Souzy et al. Reference Souzy, Lhuissier, Villermaux and Metzger2017). The value of
 $\kappa$ is obtained from the evolution of the spatial variance of the dye concentration
 $\sigma ^{2}_z$ in the transverse direction (
 $z$); see figure 4(b).
(a) Overlay of the concentration fields obtained from seven runs at  $\gamma = 7.5$. Each colour corresponds to a run. The dashed line delineates the dispersion envelope of area
 ${{\mathcal {A}}}$ (5.1). (b) Normalized spatial variance of the dye concentration in the transverse direction,
 $\Delta \sigma ^{2}_z/d^{2}=(\sigma _z^{2}-\sigma _z^{2}(t=0))/d^{2}$, versus strain. The linear fit (black line) provides the shear-induced dispersion coefficient
 $\kappa =0.017\phi \dot {\gamma } d^{2}$.

As a result, the typical number of overlaps between elementary lamellae, given by the ratio  ${{\mathcal {S}}}/{{\mathcal {A}}}$, eventually becomes very large. For the low-Péclet-number experiments,
 ${{\mathcal {S}}}/{{\mathcal {A}}} \sim 10$ for
 $\gamma = 20$ and
 ${{\mathcal {S}}}/{{\mathcal {A}}}\sim 10^{4}$ for
 $\gamma = 40$. This estimate for the number of overlaps corroborates the validity range of the solitary-strip model observed in figure 3. Significant deviation from the experimental data is found around
 $\gamma =12$ (respectively 16) for
 (respectively 8500), while (4.4a–c) and (5.1) yield
 ${{\mathcal {S}}}/{{\mathcal {A}}}=1$ at
 $\gamma \simeq 10$ (respectively 18). However, it must be noted that these estimates are meaningful only in the average sense. In practice, the transition between the solitary-strip and the coalescence regimes is not expected to be sharp, but rather gradual, because of the broad distribution of the stretching and merging statistics, which will be discussed in the following.
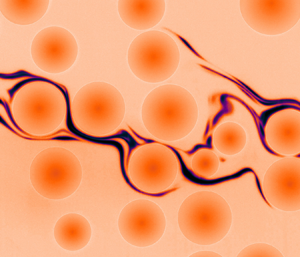
As shown in figures 2 and 5(a), these overlaps result from the continuous stretching, folding and fusing of adjacent lamellae into a single portion of lamella. This iterative process continuously creates a new lamella, hereafter called super-lamella, which contains an increasingly large number of folded elementary lamellae, while preserving the essentially lamellar structure of the blob of dye. This super-lamella typically meanders between each pair of neighbouring particles within the dispersion envelope. Hence, its total length  $2L$ does not grow exponentially but is limited by the area of the dispersion envelope according to
 $2L/2l_0 = a {{\mathcal {A}}}/{{\mathcal {A}}}_0$, where
 $a$ is a constant of order one. Like in (4.4a–c) for the elementary lamellae, this effective stretching dynamics sets the evolution of the super-lamella width
 $S$ and dimensionless time
 $T$:

The long-time evolution of  is consistent with the experimental observations: the apparent width of the super-lamellae is larger at low
 and slowly increases with strain (see figure 2).
(a) Coalescence event and corresponding concentration profiles before (blue) and after (red) merging occurs. (b) Sketch of the super-lamella formed by the coalescence of elementary lamellae. (c,d) Comparison between the experimental distributions and the coalescence model  $P_{{C}}(C)$ (5.6), for (c)
 and (d)
 . The coalescence model is plotted when the number of overlaps becomes significant (
 ${{\mathcal {S}}}/{{\mathcal {A}}}>1$), i.e. when
 $\gamma >10$ for
 and when
 $\gamma >18$ for
 .

We then assume that the aggregation process forming the super-lamella occurs at random and with a constant rate prescribed by the growth of  ${{\mathcal {A}}}$ and
 $\langle {\rho }\rangle$. As a consequence, the number of elementary lamellae
 $n$ fused into a super-lamella follows the exponential distribution (Smoluchowski Reference Smoluchowski1917):
 \begin{equation} P(n) = \frac{1}{\langle{n}\rangle}\,\mathrm{e}^{{-}n/\langle{n}\rangle},\quad \text{with}\ \langle{n}\rangle = \frac{\langle{\rho}\rangle l_0}{L} = \frac{\langle{\rho}\rangle{{\mathcal{A}}}_0}{a{{\mathcal{A}}}}, \end{equation}
which is valid when the mean number of elementary lamellae contained in a super-lamella is large ( $\langle {n}\rangle \gg 1$). The expression for
 $\langle {n}\rangle$ reflects that the length of the elementary lamellae,
 $2\langle {\rho }\rangle l_0$, must fold entirely over the length
 $2L$ of the super-lamella. This recovers the exponential increase of
 $\langle {n}\rangle$ with time discussed above.
As shown in figure 5(a), the super-lamella has a nearly Gaussian concentration profile. Then, owing to the conservation of the dye, the maximum concentration,  $C_M$, of a super-lamella is determined by its width
 $S$ and by the number
 $n$ of elementary lamellae with maximum concentration
 ${C_{m}}$ that it contains. This yields
 \begin{equation} C_M = \frac{1}{S}\sum_{i=1}^{n}\,s_i C_{{m},i} \simeq \frac{n\langle{s{C_{m}}}\rangle}{S} = \frac{s_0C_0}{S\langle{\rho}\rangle}\,n, \end{equation}
where the mean-field approximation (averaging of  $s{C_{m}}$) is relevant for the large number of overlaps considered here (
 $n\gg 1$). The local width
 $S$ of the super-lamella could possibly correlate with the number
 $n$ of elementary lamellae it contains locally. However, the variations in
 $S$ observed in the experiments, which are of the order of a few units, are negligible relative to the orders of magnitude variations in
 $n$ given by (5.3). We therefore assume that
 $S$ is independent of
 $n$ and uniform. The final concentration distribution, accounting for coalescence, is then obtained by summing the contributions of the Gaussian concentration profiles of the super-lamella for all values of
 $n$, i.e.
 \begin{equation} P_{{C}}(C) \propto \int_1^{\infty} P(n) {H_{th}} P_G(C,C_M)\,\mathrm{d} n, \end{equation}
where the apparent width of a super-lamella (i.e. where  $C>{C_{th}}$) follows
 ${H_{th}} = S\sqrt {\ln ({{C_{M}}}/{{C_{th}}})}$, which is defined for
 ${C_{th}}<{C_{M}}$. Introducing
 $\tilde {n} \equiv n/\langle {n}\rangle$, (5.5) can be recast into
 \begin{equation} P_{{C}}(C) = \frac{A'^{{-}1}}{2C}\int_{1/\langle{n}\rangle}^{\infty} \frac{\mathrm{e}^{-\tilde{n}}}{\sqrt{\ln\dfrac{\langle{{C_{M}}}\rangle\tilde{n}}{C}}}\,\mathrm{d}\tilde{n}, \quad \text{with}\ \frac{\langle{{C_{M}}}\rangle}{C_0} \equiv \frac{{C_{M}}|_{\tilde{n}=1}}{C_0} = \frac{1}{\sqrt{1+2T}}, \end{equation}
and  $A' = \int _{1/\langle {n}\rangle }^{\infty } \mathrm {e}^{-\tilde {n}} \sqrt {\ln (\langle {{C_{M}}}\rangle \tilde {n}/{C_{th}})}\,\mathrm {d}\tilde {n}$ a normalizing constant. Through (5.2)–(5.3) for
 $T$ and
 $\langle {n}\rangle$, (5.6) is entirely set by the Péclet number and the kinematic quantities
 ${{\mathcal {A}}}$ and
 $\langle {\rho }\rangle$.
The concentration distribution  $P_{{C}}$ behaves like
 $\sim (1/C)\,\mathrm {e}^{-C/\langle {{C_{M}}}\rangle }$ (within logarithmic corrections). It is thus entirely prescribed by the average maximum concentration
 $\langle {{C_{M}}}\rangle$, below which the distribution decays like
 $1/C$, and above which the decay is exponential. This prediction is compared with the experimental distributions in figure 5(c,d), with
 $a$, the proportionality factor between the super-lamellae length
 $2L/2l_0$ and the dispersion area
 $A/A_0$, as the only free parameter (its value is set by fitting the model to the low-Péclet-number data, which yields
 $a=4\pm 1$, consistently with the expectation that
 $a$ is of order one). For large Péclet number (
 ), the agreement with experiments is slightly improved relative to the solitary-strip model but not quantitative. The coalescence model predicts a larger probability for the intermediate concentration levels and a distribution tail decaying more sharply than observed experimentally. This discrepancy is consistent with the observations in figure 2, which show that for
 the bundles of lamellae are only partially fused, even at large strains. Their concentration profiles are therefore not well captured by the Gaussian shape assumed in the model. Another potential bias is that, for
 , the typical thickness
 $S$ of the super-lamella, which is set by the Batchelor scale,
 (see 5.2), is comparable with the laser sheet thickness,
 ${\sim }10\ \mathrm {\mu }\textrm {m}$. For a lamella that is not perpendicular to the laser sheet, this would average the concentration profile and alter the concentration measurements.
By contrast, for moderate Péclet number ( ), the coalescence model captures quantitatively the shape of the distributions at long times (
 $\gamma \gtrsim 16$), both for the low-concentration part (
 ${\sim }1/C$) and for the typical concentration
 $\langle {{C_{M}}}\rangle$ above which the distributions decay sharply. In this case, coalescing lamellae are found to be almost entirely fused, at all times, into a super-lamella with a close to Gaussian concentration profile.
6. Conclusion
Mixing in a particulate suspension is determined not only by the mean flow and the scalar diffusion, but also by the crucial contribution of the chaotic fluctuating motion induced by the particles, which sets both the stretching of the liquid at the smallest scales and its global dispersion at the largest ones. Mixing proceeds by the formation of elementary lamellar structures, which stretch, fold, are dispersed, diffuse and eventually overlap. The overall mixing of a blob of dye, whose initial size is of the order of the particle diameter, goes through three main stages that are summarized in figure 6.
Sketch of the successive stages of mixing for a small blob ( $s_0 \sim d$) at large Péclet number. (a) Initial segregated blob of dye with a peaked concentration distribution. (b) Above a strain
 $\gamma \sim 1$, the blob evolves as a solitary strip (without overlaps) undergoing exponentially growing, log-normally distributed, elongations. The distribution decays close to algebraically (4.6). (c) The dispersion envelope area,
 ${{\mathcal {A}}} \sim \kappa \dot {\gamma } t^{2}$, is soon too small to contain the exponentially growing area of an unfolded blob,
 ${{\mathcal {S}}}=s_B l_0\,\mathrm {e}^{f\dot {\gamma } t}$. Overlaps become significant above the strain at which
 $n \sim {{\mathcal {S}}}/{{\mathcal {A}}} \sim 1$. The random iterative aggregation of elementary lamellae forms a super-lamella with overall length
 $2L\sim 2l_0{\mathcal {A}}/{\mathcal {A}}_0$, width
 , and which contains an exponentially distributed number of elementary lamellae (5.3). The concentration distribution decays like
 $C^{-1}$ below an exponential cut-off at the mean concentration (5.6). (d) When the super-lamella has thickened up to the microscopic stirring scale, i.e. when
 $S\sim d$, portions of the super-lamella coalesce. The concentration field should then follow an overall Gaussian shape spanning the whole dispersion envelope.

(i) Below a deformation  $\gamma \sim 10$, which depends only logarithmically on
 , the growth of the dispersion envelope
 $\dot {{{\mathcal {A}}}}/{{\mathcal {A}}}$ is typically larger than the sub-particle scale stretching rate
 $f\dot {\gamma }$. Overlaps are thus scarce, and the concentration distribution is well captured by a solitary-strip description (4.6), which is based solely on the local statistics of stretching of the fluid material lines (Souzy et al. Reference Souzy, Lhuissier, Villermaux and Metzger2017).
(ii) At larger strains, overlaps become abundant. The exponentially stretched elementary lamella is randomly folded and merged into a thicker super-lamella, which undergoes a global algebraic stretching, prescribed by the growth of  ${{\mathcal {A}}}$, and thickens as
 at long times. The super-lamella thus contains an exponentially increasing number of folded elementary lamellae
 $n$, and the iterative random aggregation at the origin of its formation implies that
 $n$ is exponentially distributed (5.3). This coalescence process leads to the concentration distribution
 $P_{{C}}(C)\sim (1/C)\,\mathrm {e}^{-C/\langle {{C_{M}}}\rangle }$ (5.6). This description was shown to apply at moderate
 (
 $\sim 10^{2}$). However, it still has to be refined to account for the continuously incomplete merging of the super-lamella observed at larger
 (
 $\sim 10^{4}$).
(iii) Last, at even larger strains, when the width of the super-lamella becomes of the order of the microscopic stirring scale, i.e. when  $S\sim d$, the portions of super-lamella are expected to coalesce. The concentration field should then follow an overall Gaussian shape spanning the whole dispersion envelope, except for a thin mixing front at the edge of the envelope. This third stage has not been studied here because it is expected to occur for strains
 , which are beyond those achievable with our set-up.
The above microscopic description of the mixing process has been confronted to experiments for a single volume fraction ( $\phi =0.30$). It is, however, expected to apply over a broad range of volume fractions, typically for
 $\phi =[0.20\text {--}0.55]$, where the kinematics of the flow was shown to follow the same dispersion, stretching and folding mechanisms. From the dependence of the kinematic coefficients (
 $f$,
 $g$ and
 $\kappa$) on
 $\phi$ (Sierou & Brady Reference Sierou and Brady2004; Souzy et al. Reference Souzy, Lhuissier, Villermaux and Metzger2017), the models proposed in the present study provide direct quantitative predictions for the evolution of the concentration distributions over a broad range of volume fractions.
To conclude, we would also like to highlight that resolving the microscopic mechanisms of mixing at high  represents an experimental challenge. In the present study, it has been addressed thanks to experimental developments (injection device, index matching, light trap, dynamic range acquisition) giving access to the evolution of the concentration levels over three decades – a key aspect that could stimulate future studies on mixing.
Supplementary movie
A supplementary movie is available at https://doi.org/10.1017/jfm.2021.270.
Acknowledgements
We warmly thank E. Villermaux for stimulating discussions on the coalescence model.
Funding
This work has been supported by ANR ScienceFriction, by Labex MEC ANR-10-LABX-0092, and by ANR-11-IDEX-0001-02.
Declaration of interests
The authors report no conflict of interest.
Data availability
The data that support the findings of this study are available from https://zenodo.org/record/4588722.