Introduction
Protected areas (PAs) are the most effective tool for safeguarding species and ecosystems globally (Dudley et al. Reference Dudley, Parrish, Redford and Stolton2010). The 15th Conference of the Parties of the signatories of the Convention on Biological Diversity (CBD) agreed in Target 3 to protect 30% of the land and sea area by 2030 (CBD 2022). This target emphasizes not only the need to increase PA coverage but also the importance of ensuring that these areas are ecologically representative and effectively managed to improve biodiversity (CBD 2022). It identifies both PAs and other effective area-based conservation measures (OECMs) that contribute to biodiversity conservation outside formal PAs, often encompassing Indigenous and traditional territories, as the two primary area-based conservation tools. Target 3 interacts with other targets, such as Targets 10 (sustainable land use) and 20–23 (inclusive governance), supporting a broader, integrated strategy for biodiversity conservation (Gurney et al. Reference Gurney, Adams, Álvarez-Romero and Claudet2023). However, under the previous Aichi Target 11, many countries have prioritized PA coverage over the diversity of ecosystem types, leading to biases, whereby certain ecosystems remain under-protected (Watson et al. Reference Watson, Darling, Venter, Maron, Walston and Possingham2016).
Biodiversity conservation has been one of the main priorities for the foundation of PAs (Lecina-Diaz et al. Reference Lecina-Diaz, Alvarez, De Cáceres, Herrando, Vayreda and Retana2019). Effective conservation strategies need to consider biodiversity across different organizational levels and spatial scales (Wu Reference Wu2008). Ecoregions have been used as a proxy for ecological representation to assess whether biodiversity is adequately protected. The World Wildlife Fund developed an ecoregion map that geographically categorizes the Earth’s terrestrial ecosystems based on ecological characteristics, biodiversity and environmental conditions (Olson et al. Reference Olson, Dinerstein, Wikramanayake, Burgess, Powell and Underwood2001).
To ensure biodiversity is sufficiently represented within PAs, it has been recommended to protect at least 10% of each ecoregion (McNeely Reference McNeely1993, Balmford et al. Reference Balmford, Bennun, Brink, Cooper, Cote and Crane2005). However, PAs are often unevenly distributed across ecoregions, with some receiving disproportionately more protection than others (Brooks et al. Reference Brooks, Bakarr, Boucher, Da Fonseca, Hilton-Taylor and Hoekstra2004, Chape et al. Reference Chape, Harrison, Spalding and Lysenko2005, Jenkins et al. Reference Jenkins and Joppa2009). For instance, terrestrial ecoregions have higher protection ratios than marine ecoregions, and most ecoregions, with a few exceptions such as tundra and steppe regions, have less than 17% protection in Central Asia (Farhadinia et al. Reference Farhadinia, Waldron, Kaszta, Eid, Hughes and Ambarlı2022). This imbalance calls for a systematic assessment of PA distribution in order to close conservation gaps and enhance protection for under-represented ecosystems.
Although indicators and methods are being developed to achieve ecological representation targets in PAs worldwide (Di Marco et al. Reference Di Marco, Watson, Venter and Possingham2016, Gannon et al. Reference Gannon, Dubois, Dudley, Ervin, Ferrier and Gidda2019), shortcomings in ecological representation have been identified from the regional to the global level. The widely used ecoregion map (Brooks et al. Reference Brooks, Bakarr, Boucher, Da Fonseca, Hilton-Taylor and Hoekstra2004, Rodrigues et al. Reference Rodrigues, Andelman, Bakarr, Boitani, Brooks and Cowling2004, Schutz Reference Schutz2018) primarily captures biogeographical differences in species composition and does not account for the functional and compositional characteristics of ecosystems. As a result, it may underestimate or overestimate conservation status and fail to identify small but ecologically unique areas (Keith et al. Reference Keith, Ferrer-Paris, Nicholson, Bishop, Polidoro and Ramirez-Llodra2022).
To address these limitations, the International Union for Conservation of Nature (IUCN) developed the Global Ecosystem Typology (GET), a framework increasingly recognized within international biodiversity policy for its ability to integrate the functional and compositional characteristics of ecosystems and better represent the diversity of ecosystem types worldwide (Keith et al. Reference Keith, Ferrer-Paris, Nicholson and Kighsford2020, IUCN 2024). This comprehensive typology classifies all realms, including natural and anthropogenic ecosystems, providing a holistic framework for ecosystem assessment (Keith et al. Reference Keith, Ferrer-Paris, Nicholson, Bishop, Polidoro and Ramirez-Llodra2022). However, the available indicative distribution maps of ecosystem functional groups (EFGs; level 3 in the GET) are intended only for global comparison and are of limited use for classifying and assessing ecosystems at national and regional scales (Sink et al. Reference Sink, Adams, Franken, Harris, Currie and Karenyi2023). Therefore, in the national-level analyses, the GET map should be refined to have greater spatial and thematic resolution, reflecting a country’s specific environmental characteristics.
Using a version of the GET map refined for national-level analysis – the Korean adapted Ecosystem Typology (KET) – we examine whether South Korea’s PAs effectively protect all ecosystem types, including anthropogenic ecosystems. The KET map has land-cover data that reflect South Korea-s environmental patterns (Sohn et al. Reference Sohn, Won, Jeon, Park, Kim, Han and Song2023). We first assess the ecological representativeness of South Korea-s PAs using the KET map, then compare we this with that depicted by the ecoregion map. We aim to identify under-represented ecosystems and to propose measures to enhance conservation efforts.
Materials and methods
Study site
South Korea spans from warm oceanic to cold continental climates, with four distinct seasons. Although South Korea covers a relatively small area (100 033 km2), it benefits from diverse biotic resources and natural environments due to its unique geography, which encompasses forest and coastal ecosystems (CBD 2024).
We further described study site characteristics using the KET map, which reclassified the EFGs at level 3 of the IUCN GET Map 2.0 (Keith et al. Reference Keith, Ferrer-Paris, Nicholson and Kighsford2020) based on the 2021 Korean Land Cover Map (MOE 2021) to better reflect South Korea’s ecosystems (Sohn et al. Reference Sohn, Won, Jeon, Park, Kim, Han and Song2023). The original GET map was not used, as it lacks sufficient resolution for national-level classification. The KET map retained the higher-level structure of the GET map but adjusted the EFGs that align with the environmental characteristics of South Korea. According to the ecosystem type classification in the KET map, domestic ecosystems are categorized into five realms (first level), 11 biomes (second level) and 25 EFGs (third level; Fig. S1). Among the 32 EFGs (excluding subterranean types, marine core/selected transition types) identified for South Korea in the GET map, seven types – F1.4 (seasonal upland streams), F1.5 (seasonal lowland rivers), F2.5 (ephemeral freshwater lakes), FM1.2 (permanently open riverine estuaries and bays), FM1.3 (intermittently closed and open lakes and lagoons), MFT1.1 (coastal river deltas) and T2.1 (boreal and temperate high montane forests and woodlands) – were excluded from the KET map due to their absence from South Korea. In detail, the country is categorized at the third level: 8 terrestrial, 10 freshwater, 5 marine–terrestrial, 1 terrestrial–freshwater and 1 marine–freshwater–terrestrial EFGs (Sohn et al. Reference Sohn, Won, Jeon, Park, Kim, Han and Song2023). The T2.2 deciduous temperate forest type occupies the largest portion of the country’s land area (41.49%), highlighting the mountainous terrain of much of South Korea. Other than that, South Korea is surrounded by the ocean on three sides, and the west coast has long stretches of coastal tidal flats. While marine ecosystems were generally excluded due to the terrestrial focus of the KET map, land-based coastal ecosystems such as tidal flats were retained where represented in land-cover data.
Data acquisition and management
To obtain the current data on the PAs in South Korea, we used the public version of the Korea Database on Protected Areas (KDPA) for October 2023 (KDPA 2023), which manages the status of PA categories designated by 16 laws across five ministries and local authorities (Table S1). Operated by the Ministry of Environment (MOE) and Korea National Park Services (KNPS), PAs in South Korea are submitted and listed in the World Database on Protected Areas (WDPA; KDPA 2023).
To obtain the ecosystem-type data in South Korea, we used the KET map (Keith et al. Reference Keith, Ferrer-Paris, Nicholson and Kighsford2020, Sohn et al. Reference Sohn, Won, Jeon, Park, Kim, Han and Song2023) to describe the study site. The KET map was derived from the 2021 Korean Land Cover Map (MOE 2021), is updated annually at a 1-m resolution and of all available maps is considered to be the most accurate representation of land cover in South Korea.
To identify whether South Korea’s PAs are evenly protecting the country’s diverse ecosystem types, we analysed the KET map and compared the outcome with that of the biogeographical ecoregion map (Olson et al. Reference Olson, Dinerstein, Wikramanayake, Burgess, Powell and Underwood2001), which has been used for ecological representation. First, for the ecoregion map analysis, we overlapped South Korea’s PAs with the three ecoregions corresponding to South Korea in the Terrestrial Ecoregions of the World (https://geospatial.tnc.org). Then, for the KET map analysis, we conducted a gap analysis by overlapping the 27 PA categories with the 25 EFGs in the KET map in more depth. First, using raster layer statistics, we calculated the EFG protection ratio – the proportion of each EFG’s total area that is covered by PAs – to assess how well each EFG is protected. Second, we calculated the area protection ratio – the proportion of the total PA area occupied by each EFG – to understand the representation of each EFG within South Korea’s PAs. We also calculated the percentage of EFGs within each PA category to understand the types of ecosystems that each PA category focuses on. In our analysis, we assessed the representativeness of each ecosystem by aligning with the percentage requirements established by global targets: <10% = low protected status (below the 2010 IUCN-CBD 10% target); 10–16.99% = moderately protected (between the 2010 10% target and the 2020 17% target); 17–29.99%= moderately highly protected (between the 2020 target and the 2030 30% target); and ≥30% = highly protected (meets or exceeds the 2030 30% target).
To examine the spatial distribution and overlap of PA categories in South Korea, we analysed the management and distribution of PA categories. We found that the distribution of 27 PA categories is concentrated in specific regions, and we further evaluated the degree of overlap (Fig. S2b). We examined overlaps among all 27 PA categories, the data of which were managed within a single vector layer, so we extracted each category and performed overlap analysis. We visualized the results using QGIS’s Natural Breaks classification.
Results
Ecoregion representation and coverage in the PAs
As of January 2023, excluding overlaps after removing overlapping areas within PA designations, PAs covered 17 351.3 km2, which is c. 17.3% of the total land area of South Korea. Of the three terrestrial ecoregions of South Korea (Fig. 1), the central Korean deciduous forests accounted for the largest proportion of PAs (72.00%), followed by the southern Korea evergreen forests (15.51%) and the Manchurian mixed forests (12.48%). The proportion of each ecoregion covered by PAs varied. The Manchurian mixed forests had the highly protected level at 36.70%, followed by the southern Korean evergreen forests at 18.40% (moderately high protection) and the central Korean deciduous forests at 15.72% (moderate protection; Table 1). While the area protection ratio and the ecoregion-type protection ratio (Table 1) reflect different aspects of protection effectiveness, they indicate that all ecoregions have protection levels exceeding 10%.
Ecoregion representation and coverage of South Korea’s protected areas. Terrestrial ecoregions (Olson et al. Reference Olson, Dinerstein, Wikramanayake, Burgess, Powell and Underwood2001) were spatially clipped to the national boundary and overlaid with protected area data from the Korean Database of Protected Areas.

Ecoregion coverage (km2) and representation (%) of South Korea’s protected areas (PAs).

Ecological representation and coverage of PAs in the KET map
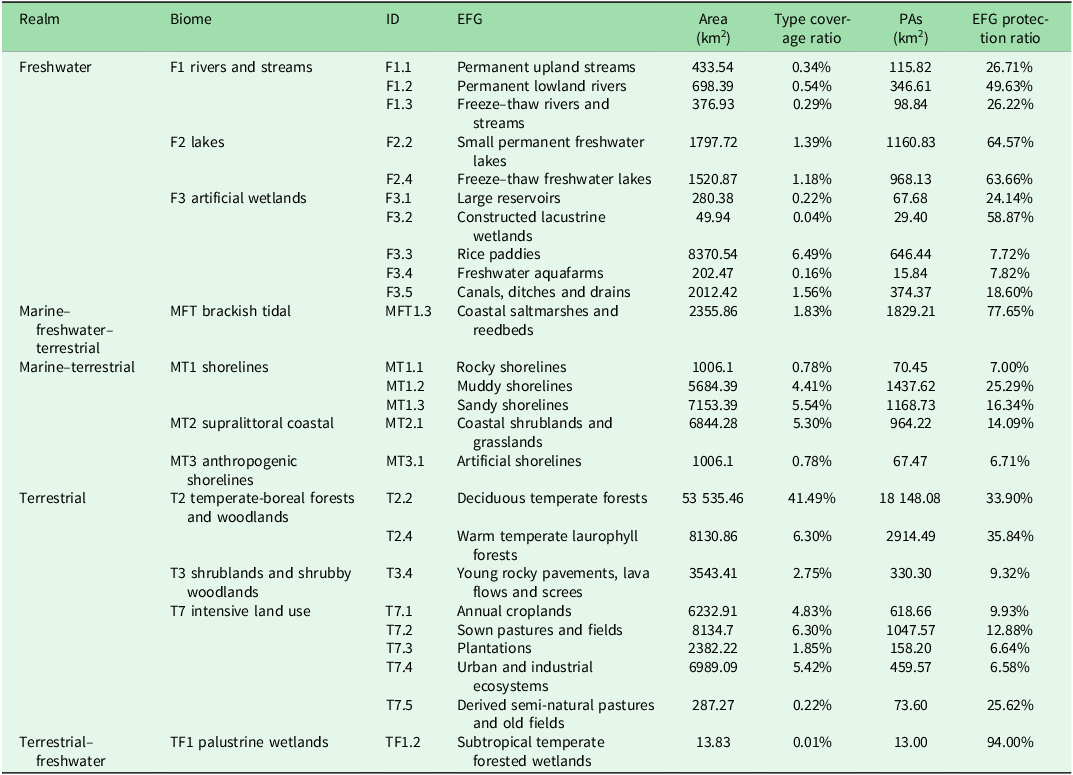
Of the 25 EFGs within South Korea in the KET map (Table 2), T2.2 (deciduous temperate forests) had the highest protection, with 54.79% of the area within PAs, followed by T2.4 (warm temperate laurophyll forests) at 8.80%, MFT1.3 (coastal saltmarshes and reedbeds) at 5.52%, MT1.2 (muddy shorelines) at 4.34%, MT1.3 (sandy shorelines) at 3.53% and F2.2 (small permanent freshwater lakes) at 3.50%, among others (Fig. 2 & Table 2). However, the extent of protection among EFGs in South Korean PAs varies widely. Notably, TF1.2 (subtropical temperate forested wetlands) had the highest level of protection at 94% (13 km2), despite occupying only 0.01% of the country’s area (13.83 km2). This is followed by MFT1.3 at 77.65%, F2.2 at 64.57%, F2.4 (freeze–thaw freshwater lakes) at 64.66% and F3.2 (constructed lacustrine wetlands) at 57.87% protection percentages. The largest EFG in the country, type T2.2, had 33.90% of its area protected (Fig. 2). Of the 25 EFGs, eight groups had over 30% protection (highly protected), six groups had 17% or more but less than 30% protection (moderately high), three groups had 10% or more but less than 17% protection (moderate) and eight groups had <10% protection (Fig. 2). Groups with low protection levels mainly consist of anthropogenic ecosystem types that reflect human influence. These groups with anthropogenic ecosystem types include MT1.1 (rocky shorelines), F3.3 (rice paddies), F3.4 (freshwater aquafarms), T3.4 (young rocky pavements, lava flows and screes), T7.1 (annual croplands), T7.3 (plantations), T7.4 (urban and industrial ecosystems) and MT3.1 (artificial shorelines). The T3.4 type is classified as a natural ecosystem in the IUCN GET map but as an artificial ecosystem in the KET map, as it represents constructed mining areas in South Korea (Sohn et al. Reference Sohn, Won, Jeon, Park, Kim, Han and Song2023).
Ecosystem functional groups (EFGs) in the Korean adapted Ecosystem Typology (KET) map coverage (km2) and representation (%) of South Korea’s protected areas (PAs): coverage and proportion of EFGs in the KET map, and coverage and representation of EFGs in South Korea’s PAs. The KET map used here reclassifies the EFG concepts in the International Union for Conservation of Nature (IUCN) Global Ecosystem Typology (GET) map to fit South Korea’s environment (Sohn et al. Reference Sohn, Won, Jeon, Park, Kim, Han and Song2023).

Percentage of protected areas (PAs) in South Korea by ecosystem functional group (EFG) in the Korean adapted Ecosystem Typology maps. Ratio of the area of each EFG within PAs to the total area of the EFG (left side of panel, EFG protection ratio) and ratio of the area of each EFG in PAs to the total PAs (right side of panel, area protection ratio). The yellow bar indicates <10% protection (low).

Ecological representation and coverage of the PA categories in the KET map
Of 27 PA categories in South Korea (Fig. 3; KDPA 2023), 18 predominantly protect T2.2 (deciduous temperate forests); this is notably the case in the Baekdudaegan Mountain Reserve, of which 94.5% protects the T2.2 type. Additionally, four marine-related PA categories significantly contribute to the protection of the MFT1.3 (coastal saltmarshes and reedbeds). The Natural Monument, Wetland Protected Area and Wildlife Special Protection Area categories focus heavily on protecting the F2.2 type (small permanent freshwater lakes). The Special Island category dedicates 42.21% of its protection efforts to the T2.4 type (warm temperate laurophyll forests), whereas the Environment Conservation Marine Areas primarily protect the MT1.2 type (muddy shorelines), covering 21.50%.
Protection proportions of ecosystem functional groups (EFGs) in the Korean adapted Ecosystem Typology map of South Korea’s protected area (PA) categories. Only the EFGs that occupy the largest percentage of each PA category are included.

The primary EFGs that are protected being largely concentrated within specific types (Fig. S2b & Table S1) could lead to instances of overlapping protection within the same region under different PA categories. The number of South Korea’s PA designations within a single site varies, from 2 to 24 overlapping designations (Fig. S2b). One example is Mount Seorak, which has a high number and area of overlaps among different PA categories (Fig. S2a). Mount Seorak is managed under nine PA categories. The designation as Cheonnyeon Ginyeomul (Natural Monument) number 171 in 1965 laid the foundation for the area to become a Nature Reserve. In 1970, a National Park was created to encompass the PA, and in 1992, part of Mount Seorak – Gyeonggi Gapyeong Seorakmyeon – was designated as a Wildlife Protection Area. In addition, there are overlaps with a Scenic Site (designated in 2013), Jayeon Hwangyeong Bojeon area (Natural Environment Conservation Area, designated in 2018), and others, spanning a range of areas and scopes.
Each EFG is protected by at least 17 PA categories, with each PA category providing varying proportions of protection coverage. EFGs with >50% protection, such as TF1.2, MFT1.3, F2.2, F2.4, F3.2 and F1.2, all had protection levels exceeding 15% for specific PA categories (Figs. 2 & S3). Conversely, the eight EFGs with protection levels below 10%, including F3.3, F3.4, MT1.1, MT3.1, T3.4, T7.1, T7.3 and T7.4, were protected under more than 20 PA categories with less than 1% protection and very few PA categories with more than 1% protection (Figs. 2 & S3); even where many PA categories protect EFGs, the EFGs are likely to be under-represented.
Discussion
While South Korea has achieved its targeted PA area coverage, we found that some ecosystems, primarily anthropogenic ecosystem types, are under-represented. The evaluation of ecological representation can have different results depending on the resolution of the ecosystem typology map used. Here, the KET map showed that certain ecosystem types were less protected than those visible in the ecoregion map. While the ecoregion map classifies South Korea into three biogeographical regions, the KET map considers ecological functions, allowing for a more detailed classification into 25 ecosystem types, including forests, lakes and rivers, wetlands and intensive land-use biomes (Table 2). This detailed classification reveals the desirability of assessing the potential for expanding the protection of eight ecosystem types in South Korea, including seven anthropogenic ecosystems such as F3.3 (rice paddies), F3.4 (annual croplands) and MT3.1 (artificial shorelines), in addition to the natural ecosystem MT1.1 (rocky shorelines). The detailed ecosystem typology helps reduce underestimation or overestimation by distinguishing very small or fragmented areas that might be overlooked at national or regional scales (Keith et al. Reference Keith, Ferrer-Paris, Nicholson, Bishop, Polidoro and Ramirez-Llodra2022).
We found that 18 out of the 25 EFGs in South Korea have moderately high protection levels, with conservation efforts heavily concentrated on the T2.2 type (deciduous temperate forests) covering 41.49% of the country, with c. 54.79% of the group protected. This is attributable to the high biodiversity, low human pressure and rugged terrain of these areas (Jenkins et al. Reference Jenkins and Joppa2009, Fan et al. Reference Fan, Xu, Zang and Ouyang2023). Most of South Korea’s inland PAs are designated as National Parks, Provincial Parks and other PA categories along the Baekdudaegan mountain range, which stretches from the north-east to the south of the peninsula (Fig. S2b). Conversely, areas of lower elevation and experiencing greater human pressure tend to have lower protection levels due to intensive development activities and highly intensive natural resource utilization (Fan et al. Reference Fan, Xu, Zang and Ouyang2023). In South Korea, among EFGs with less than 10% protection, F3.3 (rice paddies), F3.4 (freshwater aquafarms), T3.4 (young rocky pavements, lava flows and screes), T7.1 (annual croplands), T7.3 (plantations) and T7.4 (urban and industrial ecosystems) are broadly distributed in wide plains outside the Baekdudaegan range and are under pressure from human-induced resource utilization. MT1.1 (rocky shorelines) and MT3.1 (artificial shorelines) are other lower protection ratio areas narrowly stretched along the eastern coastline as a transition zone between land and the East Sea. We identified that certain subtypes – such as F3.3 and F3.4; T7.1, T8.3 and T7.4; and MT1.1 and MT3.1 – show substantial spatial overlap. These areas are rich in natural resources and have experienced significant human development (Fig. S1). These findings highlight a bias in the current PAs towards classical conservation targets such as T2.2, leaving eight highly modified EFGs under-represented. Continuing with this approach – while neglecting these modified EFGs found predominantly in plains and coastal areas – risks undermining the effectiveness of future terrestrial space protection in the region. Although frequently overlooked by classical conservation paradigms prioritizing pristine or biodiversity-rich areas, these modified EFGs often harbour considerable biodiversity and provide essential ecosystem services (Hobbs et al. Reference Hobbs, Arico, Aronson, Baron, Bridgewater and Cramer2005). Therefore, the ecosystem-type classification that reflects human influence provides critical insights into the current landscape and helps identify the full spectrum of ecosystems – including widespread, modified types – that require conservation efforts.
The ecosystem representation assessment identifies trends in the types of ecosystems protected by South Korea’s PAs, with a notable concentration of multiple PA categories focused on specific EFGs, particularly T2.2 (deciduous temperate forests; Fig. 2). While this reflects the ecological importance of regions such as Baekdudaegan, it also reveals governance inefficiencies from overlapping management, as multiple government departments independently designate and manage PA categories (Fig. 3). In many cases, different PA categories are designated in the same areas, resulting in administrative redundancies and inefficient resource allocation. For example, Mount Seorak is managed under several PA designations, reflecting its ecological, cultural and social importance; while this strengthens its long-term protection, it also complicates conservation efforts (Fig. S2). To meet international conservation goals and enhance biodiversity, it is essential to expand protection beyond the well-represented areas to include under-represented ecosystems. This includes exploring the conservation potential of anthropogenic ecosystems that perform critical ecological functions, such as rice paddies that support migratory birds or traditionally managed forests that offer both biodiversity and cultural services (Lee et al. Reference Lee, Park and Rhim2000, Hong Reference Hong2017). However, applying the same level of protection to human-influenced ecosystem as to natural ecosystems should be considered carefully. Applying traditional PA models to these ecosystems may lead to socio-economic conflicts with existing land uses, necessitating conservation goals and management approaches that differ from strict preservation (Nagendra Reference Nagendra2008, Hobbs et al. Reference Hobbs, Higgs and Harris2009, Kremen & Merenlender Reference Kremen and Merenlender2018). Therefore, a balanced conservation approach could involve applying protection measures such as OECMs to these areas when they contribute to biodiversity, ensuring that conservation efforts for natural ecosystems are not compromised. Note that our discussion is based on the Level 3 classification system (EFG, the most fine-grained data available), and accumulating finer-scale data could provide additional insights into ecosystem representation.
Alternatives for increasing the representation and conservation of ecological systems
To achieve ecological representation within South Korea’s PAs under Target 3, it is important to focus on expanding protection by exploring the conservation potential of under-represented ecosystems (Fig. 1 & Table 2). The eight EFGs with protection levels below 10% are mainly anthropogenic ecosystems. Many consider human-influenced ecosystems such as rice paddies and croplands environmentally harmful (Tanentzap et al. Reference Tanentzap, Lamb, Walker and Farmer2015) and often in conflict with PA goals that prioritize biodiversity and restrict human activities (Nagendra Reference Nagendra2008). However, there are cases in which certain anthropogenic ecosystems not only provide ecosystem services but also contribute to biodiversity conservation (Thompson et al. Reference Thompson, Crowe and Hawkins2002, Kang et al. Reference Kang, Yoo, Lee, Choi and Lee2008, Hong Reference Hong2017). When these EFG types serve such ecological functions, their protection is not only relevant to Target 3 but also supports Target 10 (sustainable agriculture and aquaculture), Target 11 (ecosystem services) and Target 13 (regarding traditional knowledge). Therefore, understanding the ecological roles of anthropogenic ecosystems within the country is essential for determining whether they provide meaningful ecological functions.
Among the eight under-represented EFGs, F3.3 (rice paddies) is the most prevalent. This type falls under the agricultural ecosystems in the KET map, which also include F3.4 (freshwater aquafarms), T7.1 (annual croplands) and T7.3 (plantations; Ottinger et al. Reference Ottinger, Clauss and Kuenzer2016). These are classified domestically as water-using agriculture types, being broadly distributed except in mountainous regions (Sohn et al. Reference Sohn, Won, Jeon, Park, Kim, Han and Song2023). The conflict between PAs and rice paddies persists, as agricultural countries limit the expansion of PAs and increase farmland conversion within the buffer zones of PAs (Farhadinia et al. Reference Farhadinia, Waldron, Kaszta, Eid, Hughes and Ambarlı2022). South Korea’s agricultural ecosystems, particularly its rice paddies along the west coast, are significant as breeding, wintering and stopover sites for migratory birds. These areas align with the East Asian–Australasian Flyway (EAAF), providing essential habitats and food resources for various waterbirds, including shorebirds (Lee et al. Reference Lee, Park and Rhim2000, Kang et al. Reference Kang, Yoo, Lee, Choi and Lee2008). Recognizing this significant ecological value, 40 sites along South Korea’s west coast have been designated as Key Biodiversity Areas (KBAs). Additionally, seven sites, including the Jeju Batdam Agricultural System and the Geumsan Traditional Ginseng Agricultural System, have been designated as Globally Important Agricultural Heritage Systems (GIAHS). These sites highlight the dual role of traditional agricultural landscapes in supporting both biodiversity and essential ecosystem services such as food production, demonstrating their alignment with Targets 10, 11 and 13 (Fig. S4). Moreover, the March 2024 Act on Restructuring and Supporting the Regeneration of Rural Spaces has begun to categorize rural areas based on development, utilization and conservation purposes. There are, however, still insufficient areas of these ecosystem types designated as PAs. Various development projects, such as tidal flat reclamation, estuarine dam construction and channel dredging in areas such as Heuksan Island and Saemangeum, continue to threaten migratory bird populations (Park et al. Reference Park, Lee, Choi, Heo and An2016). This underscores the importance and urgency of designating PAs for these four agricultural ecosystem types.
Artificial ecosystems can also undergo transformations into ecosystem types with different attributes and organizational processes as existing activities cease (Islebe et al. Reference Islebe, Hooghiemstra, Brenner, Curtis and Hodell1996). In South Korea’s land cover, T7.4 (urban and industrial ecosystems) and T3.4 (young rocky pavements, lava flows and screes) refer, respectively, to urbanized areas (covered by structures) and mining areas. Over time, driven by socio-economic and cultural-spiritual processes, these areas can undergo significant changes in nutrient and energy flow pathways, and, in some cases, they harbour remnants of valuable biodiversity by forming microhabitats (Islebe et al. Reference Islebe, Hooghiemstra, Brenner, Curtis and Hodell1996). Furthermore, these areas can be recognized for their important ecological functions, taking forms such as privately managed temple forests (Thompson et al. Reference Thompson, Crowe and Hawkins2002, Martínez-Tilleria et al. Reference Martínez-Tilleria, Núñez-Ávila, León, Pliscoff, Squeo and Armesto2017). In South Korea, examples of these include greenbelt zones that restrict development by landowners for the purpose of nature conservation, private PAs managed by corporations or foundations and privately owned lands outside of designated PAs that incidentally provide ecological benefits. Among them, examples such as temple forests, former military training grounds and small forests near the Han River are considered to be designated as OECMs (MOE 2024, IUCN 2019). Other EFGs, such as MT1.1 (rocky shorelines) and MT3.1 (artificial shorelines), are not fully represented in the KET map, as only portions within national boundaries were clipped from the original GET classification. This makes it difficult to assess their conservation value, despite their role as important transition zones linking the east coast and inland regions (Steibl et al. Reference Steibl, Sigl, Bräumer, Clauß, Goddemeier and Hamisch2021). Transition zones are significant in conservation planning due to their biogeographical and biodiversity patterns, which consider both adjacent ecosystems. Assessing their conservation value through maps of South Korea’s marine and coastal ecosystems remains an unmet need (Hong Reference Hong2017).
While the governance of PAs reported in the WDPA include government, shared, private and Indigenous/community governance types, South Korea’s PAs are primarily managed by the government (Fig. 3 & Table S1). Yet without sufficient communication between stakeholders, this centralized decision-making system can lead to redundant efforts – for example, independently targeting specific types such as T2.2 within PA categories (Lee et al. Reference Lee, Lee, Sung, Lee, Lee and Kim2013, Huang et al. Reference Huang, Xu, Zang and Du2024). Despite the presence of multiple PA categories, ecosystem types that do not receive focused conservation efforts from a specific PA category tend to be relatively under-protected (Fig. S3). To improve the management and biodiversity protection of these areas, it is crucial to communicate the objectives and management requirements of each PA designation at an early stage, especially during the management planning process (Deguignet et al. Reference Deguignet, Arnell, Juffe-Bignoli, Shi, Bingham and MacSharry2017). This approach ensures that various PA categories encompass a wide range of ecosystem types. Additionally, integrating privately managed areas, such as traditional village forests and temple forests, into the PA system can diversify the governance of national PAs and provide opportunities to include diverse voices in the decision-making process (Hong Reference Hong2017). Therefore, similar PA categories need to be integrated through shared and cooperative governance at various levels, and we need to identify additional OECMs in the private sector.
Future studies should conduct assessments of marine ecosystems to evaluate the representativeness of marine areas and identify regions that are crucial for marine biodiversity. Furthermore, the data used primarily focused on government-managed PAs, so incorporating data from local governments and privately managed areas could enhance the ecological representation of South Korea’s PAs. Addressing these limitations and additional research will improve our understanding of the ecological representativeness of South Korea’s PAs and help set future targets based on our findings. Furthermore, this study presents a national-level application of the IUCN GET for assessing ecosystem representation in PA networks, aligning with GET’s increasing recognition in international biodiversity policy (IUCN 2024). While valuable national classifications exist (e.g., in Myanmar and Colombia; Murray et al. 2019, Etter et al. Reference Etter, Andrade, Nelson, Cortés and Saavedra2020), differing typologies offer limited use in cross-country comparisons. The approach followed in this study could help guide similar efforts in other countries striving to improve ecosystem representation under CBD Target 3.
Conclusion
Compared to the three-ecoregion map, the KET map’s 25 EFGs allowed for a more detailed understanding of ecological representation. While type T2.2 (deciduous temperate forest) has 54.79% PA coverage, eight EFGs – primarily anthropogenic ones such as rice paddies and urban ecosystems – are under-represented. The overlapping management of conservation efforts, specifically for T2.2 in areas such as Mount Seorak, highlights the need for more efficient management strategies.
Our review of the eight under-represented ecosystem types in South Korea identified several areas that, while not meeting the criteria for PAs and often highly human-modified, are recognized and managed by associations or private organizations (e.g., KBA, EAAF). These areas are valued because they deliver conservation outcomes, such as providing critical habitats for threatened migratory birds or maintaining key ecological functions that help reverse biodiversity loss and halt ecosystem degradation. To improve conservation outcomes, these areas need to be considered as potential OECMs. Future research also needs to explore marine ecosystems and privately managed PAs. By addressing these gaps and fostering inclusive governance, South Korea can strengthen its environmental conservation strategies.
Supplementary material
To view supplementary material for this article, please visit https://doi.org/10.1017/S0376892925100088.
Acknowledgements
None.
Financial support
This paper was written with the support of the Korea Environment Industry & Technology Institute (KEITI) through its Technology Development Project for Creation and Management of Ecosystem based Carbon Sinks (RS-2023-00218245) and funded by the Korea Ministry of Environment (MOE).
Competing interests
The authors declare none.
Ethical standards
Not applicable.