1. Mortality Models Across Multiple Populations
Mortality data are typically collected by jurisdictional areas, such as countries and states. As a result, global mortality experience is summarised in dozens of national and sub-national registries, presenting a major data-analysis challenge. The burgeoning Human Mortality Database (HMD, 2018) offers a centralised portal to nearly 40 such datasets, yielding a rich source of cross-national longevity trends.
Significant predictive value can be extracted from joint models of these mortality tables. By aggregating data, one hopes to improve prediction accuracy (through better disentangling of trends vis-a-vis “noise”) and simultaneously reduce model risk by increasing credibility of the forecasts. Moreover, joint models capture information fusion, which is very valuable since mortality data are released asynchronously. With a joint model, one can rely on the newly released data of a related foreign population to update and improve the domestic forecast. Last but not least, joint models are critical for generating forecasts and future scenarios simultaneously across multiple populations. Individual models will tend to be non-coherent, i.e. include scenarios where the joint mortality trends cross over or diverge in unrealistic ways.
Yet few models exist for predictive multi-population longevity analysis beyond two populations. The latter case affords the convenient hierarchy of treating one population as the baseline “index” and then modelling the “spread” between the index and the secondary population. With three or more populations, the conceptual meaning of the multiple resulting longevity spreads becomes fuzzy. Moreover, in the commonly adopted Age–Period–Cohort-style models, multiple populations are treated through decomposition into global- and population-specific factors, implying that the number of factors grows linearly in the number of populations. Since each factor (Age, Period, etc.) contains dozens of parameters, one quickly ends up with hundreds of parameters to be estimated, creating significant computation and statistical inference bottlenecks.
In this article, we investigate a machine learning approach that simultaneously models multiple longevity surfaces within a joint spatial covariance framework. Our approach scales up to
 $\sim 10$
populations, which we treat as a factor covariate, with the respective correlation inferred as part of the model fitting procedure. Specifically, we employ multi-output Gaussian process (MOGP) models, building upon our earlier work in Ludkovski et al. (Reference Ludkovski, Risk and Zail2018) and Huynh et al. (Reference Huynh, Ludkovski and Zail2020) on the use of GPs for longevity predictive analytics. GPs treat age-specific mortality rates as a noisily observed response surface that is learned via the multivariate kriging equations. Embedding multiple populations within a MOGP naturally captures the borrowing of mortality information and the underlying commonality of mortality patterns. Indeed, a MOGP imposes a transparent correlation structure on the co-dependence of mortality rates across populations, disentangling it from the global Age–Year pattern. Moreover, GPs afford a Bayesian perspective, yielding a full uncertainty quantification – including coherent multi-population stochastic scenarios – not just for mortality rates but also for mortality improvement factors.
The GP paradigm brings a flexible non-parametric spatio-temporal structure that treats tasks of data smoothing (aka in-sample prediction) and forecasting (aka out-of-sample prediction) in an internally consistent manner. The vast GP ecosystem has become a centrepiece of probabilistic data science and includes a multitude of extensions, from GP GLMs (to address non-Gaussian observation noise) to Kronecker GP (for faster analysis of gridded data). We refer to Duvenaud (Reference Duvenaud2014), Chu & Ghahramani (Reference Chu and Ghahramani2005), Garrido-Merchán & Hernández-Lobato (Reference Garrido-Merchán and Hernández-Lobato2018) for further discussion of GP modelling with categorical covariates. From the machine learning perspective, the respective ideas of multi-task learning and transfer learning have wide applications (Bonilla et al., Reference Bonilla, Chai, Williams, Platt, Koller, Singer and Roweis2008; Caruana, Reference Caruana1997; Letham & Bakshy, Reference Letham and Bakshy2019).
In the context of mortality modelling, single-population GPs were investigated in Ludkovski et al. (Reference Ludkovski, Risk and Zail2018) and some preliminary multi-population analysis appeared recently in Huynh et al. (Reference Huynh, Ludkovski and Zail2020). Related spatio-temporal methods were investigated by Christiansen et al. (Reference Christiansen, Spodarev and Unseld2015) to capture the spread between individual log-mortality rates and weighted average log-mortality and Debón et al. (Reference Debón, Martnez-Ruiz and Montes2010). Another related analysis of the HMD can be found in Carracedo et al. (Reference Carracedo, Debón, Iftimi and Montes2018) who applied spatio-temporal Markov clustering to detect common patterns of longevity across 26 European countries, see also Antonio et al. (Reference Antonio, Devriendt, de Boer, de Vries, De Waegenaere, Kan, Kromme, Ouburg, Schulteis and Slagter2017). Another way to introduce dependence between populations is through statistical shrinkage within a Bayesian hierarchical model. Raftery et al. (2012) modelled mortality of 160+ countries by first imposing a global hyper-prior over several one-dimensional parameters and then constructing individual Lee–Carter models. A related approach is taken up by WiŚniowski et al. (Reference Wiśniowski, Smith, Bijak, Raymer and Forster2015). This framework also permits to inject additional socio-economic or geo-political covariates to capture the varying degree of dependence (Kleinow & Cairns, Reference Kleinow and Cairns2013; Boonen & Li, Reference Boonen and Li2017).
The strand of literature addressing multi-population extensions of the now-classical Lee–Carter stochastic mortality framework is getting longer. The seminal work by Li & Lee (Reference Li and Lee2005) extended Lee–Carter to two populations, postulating a decomposition of mortality into population-specific plus global Age and Period factors (for a total of
 $2L+2$
factors with L populations). More parsimonious versions were proposed by Kleinow (Reference Kleinow2015) who considered a common Age effect, and Delwarde et al. (Reference Delwarde, Denuit and Guillén2006) who proposed a common Period effect. Enchev et al. (Reference Enchev, Kleinow and Cairns2017) investigated several intermediate cases. Dispensing with country-specific factors allows more interpretability, e.g. in the Kleinow (Reference Kleinow2015) CAE model one may directly compare period effects across countries since these are scaled with the same age parameters. From the other direction, the model of Li & Lee (Reference Li and Lee2005) functionally corresponds to having a single degree of freedom in the evolution of the mortality curve over time. According to Li (Reference Li2013), at least two Age/Period factors are warranted, and accordingly a multi-factor extension was investigated. Note that in our setup mortality curves are non-parametric (i.e. as many degrees of freedom as there are data points). To achieve coherent forecasts with two populations, Hyndman et al. (Reference Hyndman, Booth and Yasmeen2013) considered co-integration, see also the multi-level functional regression approach in Shang (Reference Shang2016). In a similar spirit, D’Amato et al. (Reference D’Amato, Haberman, Piscopo, Russolillo and Trapani2016), Li & Lu (Reference Li and Lu2017), and Guibert et al. (Reference Guibert, Lopez and Piette2019) investigated vector autoregressive approaches to achieve correlation across the multiple Period factors. Alternatively, Chen et al. (Reference Chen, MacMinn and Sun2015) and Wang et al. (Reference Wang, Yang and Huang2015) applied a copula approach to capture the dependence between individual Period factors and Yang & Wang (Reference Yang and Wang2013) considered a vector error correction model. As further extensions, Wang et al. (Reference Wang, Pantelous and Vahid2020) incorporate structural breaks in order to capture time-varying mortality improvement factors and Dong et al. (Reference Dong, Huang, Yu and Haberman2020) apply tensor decomposition to identify the univariate Age, Year and Population factors.
Let us also mention other methods for multi-population mortality, such as those based on hierarchical Buhlmann credibility theory (Tsai & Zhang, Reference Tsai and Zhang2019; Tsai & Wu, Reference Tsai and Wu2020), hierarchical Bayes (Lu et al., Reference Lu, Hanewald and Wang2019) and continuous-time Levy processes (Qin & Jevtic, Reference Qin and Jevtic2016).
To sum up, our main contribution is a statistical methodology to build multi-population longevity models through MOGP. A key innovation is the use of intrinsic coregionalisation model (ICM) kernels to achieve dimension reduction that leads to more efficient models that can gracefully handle two to ten populations. Another innovation is a detailed discussion about how to pool populations to maximise predictive power. The analysis below supersedes the earlier proceedings version in Huynh et al. (Reference Huynh, Ludkovski and Zail2020) that concentrated on descriptive investigation of single-population GPs across HMD datasets and primarily focused on two-population cases with full-rank kernels. As further supplementary material, we also provide an online tutorial with additional animations and visualisations, see https://nhanhuynh46.github.io/MOGPTutorials/.
The rest of the paper is organised as follows. Section 2 describes the MOGP model for multiple-population mortality analysis. Section 3 focuses on how MOGPs can maximise predictive accuracy, while section 4 shows how MOGP is appropriate for coherent forecasting and capturing commonality of mortality experience.
1.1 Motivating multi-population models
Our first motivation for developing multi-population models is to improve predictive accuracy. It is generally accepted that there is strong commonality in mortality experiences of different populations, and therefore that there is an opportunity for data fusion to better capture trends and de-noise raw data. Hence, we wish to build a multi-population model to maximise its “credibility”, or equivalently reduce the mis-specification between the true mortality evolution and the fitted model dynamics that arises due to using limited historical data. The latter idea has several complementary aspects that we now enumerate to foreshadow the methods and results below.
First, data fusion is intrinsically linked to data selection: one should only model populations that are actually dependent; including those that are little-correlated is likely to worsen model fit and forecasting performance. Therefore, multi-population modelling is closely linked to identifying dependence patterns and selecting (i.e. clustering) populations that are most correlated. From a modelling perspective, judicious choice of which populations to aggregate is critical to keeping models tractable and computationally lean – it is beyond the reach of nearly all methods to directly handle the full HMD with 75+ datasets.
Second, data fusion is also important for mitigating model risk, i.e. for fitting the best model. Therefore, successful data fusion is expected to manifest itself in reduced parameter uncertainty. For GPs, this translates into tighter hyperparameter and latent-surface posteriors, affording a transparent visualisation of higher model stability and higher confidence into the predictive forecasts. We emphasise the latter Bayesian concepts and assess our predictive accuracy not simply through the predictive mean (via a mean-squared-error related metric) but also through scoring rules, such as continuous ranked probability score (CRPS) that are based on the quality of the full predictive distribution.
Third, for HMD data in particular, a key problem is to obtain highest-quality contemporary forecasts, i.e. to assess the present-date mortality in a given “domestic” population. Because the database is updated very frequently and asynchronously across different countries, at any given timepoint the database is not rectangular but “notched”, i.e. it ends at different years. For instance, as of February 2020 some countries already have 2018 data added, most have data up to 2017, and a few are still lagging and only have data up to 2016. Using such input data to build the best-feasible prediction of 2019 mortality in say UK is possibly the most common use of HMD, but presents challenges relative to the “classical” time-series models. As we show, GPs are both easily adaptable and internally consistent for this task.
To conclude this section, we reiterate the big picture perspective that underlies the premise of multi-population analysis: because populations are similar – both in their static structure and in their dynamic evolution – one should leverage this similarity to improve predictive analysis. But this must be done in a smart way, keeping in mind computational and statistical considerations and the specific predictive tasks envisioned. We believe that for mortality analysis, a multi-output machine learning framework checks off all these boxes and offers a tractable and scalable way to jointly analyse a collection of two to ten populations.
Data source: We work with mortality data from the HMD (HMD, 2018) which provides the aggregated mortality statistics at the national levels for 40 developed countries across the globe. The HMD applies the same consistent set of procedures (Boe et al., Reference Boe, Winant, Riffe, Barbieri, Wilmoth, Jasilionis, Grigoriev, Jdanov, Shkolnikov and Glei2015) on each population and presently focuses on developed economies where death registrations and census data are available and reliable. For our analysis, we rely on 1-year age groups, concentrating on Ages 50–84 (retirement ages most relevant for predictive actuarial analysis) for both genders and calendar Years 1990–2016. In the models below, we consider various subsets of the following 16 European datasets: Austria (AUT), Belgium (BEL), Czech Republic (CZE), Denmark (DEN), Estonia (EST), France (FRA), Germany (GER), Hungary (HUN), Latvia (LAT), Lithuania (LTU), Netherlands (NED), Poland (POL), Spain (ESP), Sweden (SWE), Switzerland (SUI) and United Kingdom (UK or GBR).
The dataset is organised as a large table. The nth observation for the lth country contains (i) Age and Year as a pair of independent variables,
 $(x_{ag}^n,x_{yr}^n)$
, and (ii) the logarithm of the observed mortality rate,
 \begin{equation} y^n = \log\bigg[\frac{\text{Death counts at $(x_{ag}^n,x_{yr}^n)$}}{\text{Exposed-to-risk counts at $(x_{ag}^n,x_{yr}^n)$}}\bigg]=\log\bigg[\frac{D^n}{E^n}\bigg]\end{equation}
We denote by
 $\mathcal{D}_l =\{(x^n,y^n)\}_{n=1}^N$
the dataset for the lth country.
2. MOGP Models
2.1 GP regression for mortality tables
A GP is an infinite collection of random variables, any finite number of which follows a multivariate normal (MVN) distribution. As such, a GP
 $f \sim GP( m, C)$
is characterised by its mean function m(x) and its covariance structure C(x, x’). This means that for any vector
 $\mathbf{x}=(x^1,\ldots,x^n)$
of n inputs:
 \begin{equation*} f(x^1),\ldots,f(x^n) \sim \mathcal{N}\big(\mathbf{m(x)},\mathbf{C(x,x)}\big)\end{equation*}
where
 $\mathbf{m(x)}=\mathbb{E}[f(\mathbf{x})]$
is the mean vector of size n and
 $\mathbf{C(x,x)}$
is the n-by-n covariance matrix,
 $C(x,x') \,:\!=\, \mathbb{E}[(f({x})-{m(x)})(f({x'})-{m(x')})]$
.
In a GP regression setup, the latent f links the observations or output vector
 $\mathbf{y}=(y^1,\ldots,y^n)$
to the input vector
 $\mathbf{x}$
via:
 \begin{equation} y^i = f(x^i) + \epsilon^i\end{equation}
where
 $\epsilon^i$
is the error term to reflect that we observe only a noisy sample of
 $f(x^i)$
. In our context,
 $x^i$
are the individual cells in a mortality table (so indexed by Age, Year, etc.),
 $y^i$
are observed raw log-mortality rates and
 $f(x^i)$
is the true mortality rate that would materialise in the absence of any random shocks. We assume that observation noise is Gaussian:
 $\epsilon^i \sim \mathcal{N}(0,\sigma^2)$
or
 $\epsilon=(\epsilon^1,...,\epsilon^n) \sim \mathcal{N}(\mathbf{0},\mathbf{\Sigma}=\text{diag}(\sigma^2))$
. It follows that
 $\textrm{Cov}(y^i,y^j) = \textrm{Cov}(f(x^i),f(x^j)) + \sigma^2\delta(x^i,x^j)$
and therefore
 $\mathbf{y} \sim \mathcal{N}( \mathbf{m(x)}, \mathbf{C(x,x) + \Sigma})$
where
 $\delta(x^i,x^j)$
is the Kronecker delta.
GP regression works by applying the Bayesian formalism of assigning a prior distribution to
 $f \sim GP( m, C)$
and using MVN conditioning relative to a dataset
 $\mathcal{D}=(\mathbf{x},\mathbf{y})$
to infer the posterior distribution of f. The Gaussian structure of the prior and the Gaussian structure of (2) together with Bayes’ rule yield a Gaussian posterior
 $p(\mathbf{f|\mathcal{D}}) \propto \text{ }p(\mathbf{f})p(\mathbf{y|x,f})$
:
 \begin{equation*}\begin{aligned} \text{Posterior distribution} &\ = \frac{\text{Prior distribution x Likelihood function}}{\text{Marginal distribution}} \end{aligned}\end{equation*}
The principal objective is to draw prediction about
 $\mathbf{f_*} \equiv f(\mathbf{x_*})$
or future observations
 $\mathbf{y_*} \equiv Y(\mathbf{x_*})$
at new inputs
 $\mathbf{x_*}$
. By construction,
 $\mathbf{y}$
and
 $\mathbf{y_*}$
follow a joint MVN distribution:
 \begin{equation*}\begin{bmatrix} \mathbf{y} \\ \mathbf{y_*} \end{bmatrix} \sim \mathcal{N}\Bigg( \begin{bmatrix} \mathbf{m} \\ \mathbf{m_{*}} \end{bmatrix}, \begin{bmatrix} \mathbf{C+\Sigma} & \mathbf{C(x,x_*)} \\ \mathbf{C(x,x_*)}^T & \mathbf{C_{**}+\Sigma_{**}} \end{bmatrix} \Bigg)\end{equation*}
where
 $\mathbf{C(x,x_*)}$
is the covariance matrix between
 $f(\mathbf{x})$
and
 $f(\mathbf{x}_*)$
,
 $\mathbf{C}_{**}$
is the covariance matrix of
 $f(\mathbf{x}_*)$
,
 $\mathbf{\Sigma_{**}}=\text{diag}(\sigma^2)$
is the noise variance matrix of the test inputs
 $\mathbf{x}_*$
and
 $\mathbf{m_{*}} = m(\mathbf{x_*})$
. The MVN formulas then imply that
 \begin{align}\notag p(\mathbf{y_*|y}) & \sim \mathcal{N}(\mathbf{m_*(x_*),C_*(x_*,x_*)}) \qquad \text{where} \\ \mathbb{E}[\mathbf{y_*|\mathcal{D}}] = \mathbf{m_*(x_*)} &\ = \mathbf{m+C(x,x_*)}^T[\mathbf{C+\Sigma}]^{-1}(\mathbf{y-m}); \end{align}
 \begin{align} \mathbb{V}ar(\mathbf{y_*}|\mathcal{D}) = \mathbf{C_*(x_*,x_*)} &\ = \mathbf{C_{**}+\Sigma_{**}}-\mathbf{C(x,x_*)}^T[\mathbf{C+\Sigma]}^{-1}\mathbf{C(x_*,x)}\end{align}
Note that the posterior variance
 $\mathbf{C_*(x_*,x_*)}$
is equal to the prior variance
 $\mathbf{C_{**}+\Sigma_{**}}$
minus a positive term which reflects the information gained (relative to the prior) from the training data. Furthermore, (3)–(4) are valid for any
 $\mathbf{x}_*$
, i.e. both for in-sample smoothing or for out-of-sample extrapolation.
Covariance function. The kernel C(x, x
′) captures the correlation between mortality rate at a given Age and Year and mortality rates at other coordinates. For example, we expect the mortality for age 70 in 2010 or
 $x^i=(70,2010)$
, to be more correlated with
 $x^j=(69,2011)$
than with
 $x^j=(50,1995)$
. In this paper, we employ the squared-exponential (SE) kernel:
 \begin{equation} \tilde{C}(x^i,x^j)= \eta^2\textrm{exp}\bigg[-\frac{(x^i_{ag}-x^j_{ag})^2}{2\theta_{ag}^2}-\frac{(x^i_{yr}-x^j_{yr})^2}{2\theta_{yr}^2}\bigg] \end{equation}
When
 $x^i \approx x^j$
, the covariance reaches its maximum value
 $\eta^2$
; when
 $x^i$
and
 $x^j$
are far apart,
 $\tilde{C}( x^i,x^j) \approx 0$
. This feature of expressing the dependence structure through a spatial perspective is central to GPs and is controlled by the hyperparameters
 $\theta_{ag}$
and
 $\theta_{yr}$
in (5) that are called characteristic length-scales. The length-scales determine how much influence an observation has on others in the Age and Year dimensions, respectively. Note that
 $\theta_{ag}$
– length-scale for Age – and
 $\theta_{yr}$
– length-scale for Year – are not comparable. An important aspect that influences the goodness-of-fit of a GP model is its spatial smoothness. The SE covariance kernel (5) makes the mortality curves infinitely differentiable in both Age and Year dimensions (note that the GP is defined over
 $x \in \mathbb{R}_+^2$
and so provides a continuous interpolation of the observed data gridded by year). This will be exploited below for computing mortality improvement factors. Moreover, the length-scales
 $\theta$
affect the qualitative nature of the fitted
 $m_*(\cdot)$
. When length-scales are too large, the fitted curves are over-smoothed and the influence of individual data points attenuates (Rasmussen & Williams, Reference Rasmussen and Williams2005). As a result, there is less flexibility in
 $m_*(\cdot)$
; to compensate, the estimated observation noise is increased and the model under-fits. In contrast, too small length-scales indicate over-fitting of the spatial dependence, generating high-frequency oscillations in the fitted
 $m_*(\cdot)$
and low observation noise
 $\sigma^2$
.
2.2 MOGP kernels
The idea of commonality in mortality experiences is equivalent to the existence of global longevity trends. In the context of a spatio-temporal model, it implies an underlying shared covariance structure. This can be easily verified visually or statistically, see Huynh et al. (Reference Huynh, Ludkovski and Zail2020) for comparison of 10+ European countries available in HMD where we observe both similar fitted mortality dynamics (e.g. similar mortality improvement curves over time) and similar estimated GP covariance hyperparameters.
Let L be the number of different populations considered. To jointly model the L different outputs,
 $\{f_l\}_{1\leq l \leq L}$
we correlate them using the framework of MOGPs which was introduced in geostatistics under the name of multivariate kriging or co-kriging (Chiles & Delfiner, Reference Chiles and Delfiner1999; Hoef & Barry, Reference Hoef and Barry1998). The aim of co-kriging is to estimate the under-sampled variables using spatial correlation with other sampled variables.
The vector-valued latent response over the Age–Year input space is defined as:
 \[\mathbf{f(x)}=(f_1(x^1),\ldots,f_1(x^N),\ldots,f_L(x^1),\ldots,f_L(x^N))=(f_1(\mathbf{x}),\ldots,f_L(\mathbf{x}))\]
where the functions
 $\{f_l\}_{l=1}^L$
are the log-mortality surface for the corresponding population l. Similar to single-output GP (SOGP), MOGP assumes that the vector-valued
 $\mathbf{f}$
follows a GP:
 \[\mathbf{f} \sim GP(\mathbf{m,C})\]
where
 $\mathbf{m} \in \mathbb{R}^{LN \times 1}$
is the mean vector whose elements
 $\{m_l(\mathbf{x})\}_{l=1}^L$
are the mean functions of each output, and
 $\mathbf{C} \in \mathbb{R}^{LN \times LN}$
is the fused covariance matrix.
Populations are treated as categorical input, encoded via L additional input dimensions with 0/1 encoding. Thus, the input vector for the nth observation in the joint model is
 $x^n=(x^n_{ag},x^n_{yr},x^n_{pop,1},\ldots,x^n_{pop,L})$
, where
 $x^n_{pop,l}=\mathbbm{1}_{\{\text{population}=l\}}$
are indicators, set to 1 if and only if the nth observation is from population l. We denote by
 $N_l$
the number of Age–Year inputs for population l. If all L populations have the same set of inputs and
 $N_1=\ldots=N_L=N$
, the dataset is said to be isotropic.
To construct the fused
 $\mathbf{C}$
, one approach is to take the product between a kernel for the Age–Year covariates
 $x_{ag}, x_{yr}$
and a kernel for the categorical ones (Qian et al., Reference Qian, Wu and Jeff Wu2008; Roustant et al., Reference Roustant, Padonou, Deville, Clément, Perrin, Giorla and Wynn2018). Let:
 \begin{align} \Gamma_{(l_1,i),(l_2,j)} &\ = \textrm{exp}\bigg[-\theta_{l_1,l_2}\delta_{l_1,l_2}^{ij}\bigg] \text{where }\quad l_1, l_2 \in \{1, \ldots,L\} \end{align}
with
 $$\delta _{{l_1},{l_2}}^{ij} = \left\{ {\matrix{
1 \hfill & {i{\rm{th}}\;{\rm{and}}\,j{\rm{th}}\;{\rm{observation}}\;{\rm{come}}\;{\rm{from}}\;{\rm{populations}}\;{l_1}\;{\rm{and}}\;{l_2};} \hfill \cr
0 \hfill & {{\rm{otherwise}}} \hfill \cr
} } \right.$$
Note that
 $\delta_{l_1,l_2}^{ij} = 1_{\{ x^i_{l_1} \neq x^j_{l_1}\}} \cdot 1_{\{ x^i_{l_2} \neq x^j_{l_2} \} }$
is symmetric in i and j.
Then, the covariance between input rows
 $x^i$
and
 $x^j$
is set as follows:
 \begin{align} C(x^i,x^j) &\,:\!=\, \eta^2 \textrm{exp}\Bigg[-\frac{(x^i_{ag}-x^j_{ag})^2}{2\theta_{ag}^2}-\frac{(x^i_{yr}-x^j_{yr})^2}{2\theta_{yr}^2}\Bigg]\prod_{\{l_1,l_2\} }\textrm{exp}\Bigg[-\theta_{l_1,l_2}\delta_{l_1,l_2}^{ij}\Bigg] \\ &\ = \begin{cases} \tilde{C}_{i,j} & \text{if observations are from the same population}; \\ \\[-7pt] \tilde{C}_{i,j} \Gamma_{(l_1,i),(l_2,j)} & \text{if observations are from populations } l_1, l_2 \notag \end{cases}\end{align}
When observations are from the same country, the covariance between the ith and jth observation is the same as in a SOGP model, cf. equation (5). Intuitively,
 $\Gamma_{l_1,l_2} <1$
discounts the covariance when observations are from different populations and is driven by the hyperparameter
 $\theta_{l_1,l_2}$
: large value of
 $\theta_{l_1,l_2}$
implies low correlation
 $r_{l_1, l_2} \,:\!=\, \textrm{exp}\big(-\theta_{l_1,l_2}\big)$
between the two populations.
Two important assumptions are made in equation (7). First, there is separability (Alvarez et al., Reference Alvarez, Rosasco and Lawrence2011) between the cross-population covariance and the covariance over the Age–Year inputs. Second, observations across L populations share the same spatial covariance kernel. This assumption is useful to examine the commonality in the mortality across populations via the length-scales in Age and Year dimensions. It can be thought of as full statistical shrinkage of the individual population covariances towards a common baseline, cf. section 4.1 below.
We note that unlike the Li & Lee (Reference Li and Lee2005) framework and its extensions that explicitly assume a common factor shared by all populations, the GP framework is more similar to co-integration frameworks that postulate statistical dependence across
 $f_\ell$
’s. In that sense, GP modelling is more amenable to handling larger collections of populations where more complex mortality clustering may be present, see section 3.1.
2.3 Coregionalised kernels
Estimating cross-population covariance in (7) requires fitting
 $L(L-1)/2$
parameters
 $\theta_{l_1, l_2}, 1 \le l_1 \le l_2 \le L$
which imposes challenges in both statistical and computational aspects when modelling MOGP with many outputs (e.g.
 $L \geq 4$
). An attractive dimension reduction approach to keep the number of correlation parameters low is the ICM (Alvarez et al., Reference Alvarez, Rosasco and Lawrence2011). In ICM, each output
 $f_l$
is assumed be a linear combination of independent latent GPs. Let
 $u_1(\mathbf{x}),\ldots,u_Q(\mathbf{x})$
be independent latent functions each from a GP prior with covariance kernel
 $C^{(u)}(\mathbf{x,x'})$
. The modelled outputs
 $f_l$
are linear combinations of these Q latent factors:
 \begin{equation} f_l(\mathbf{x}) = a_{l,1}u_1(\mathbf{x}) + \ldots + a_{l,Q}u_Q(\mathbf{x}) = \sum_{q=1}^Q a_{l,q}u_q(\mathbf{x})\end{equation}
where
 $a_{l,q}$
’s are the factor loadings. Let
 $\mathbf{a}_q=(a_{1,q},\ldots,a_{L,q})^{T}$
be the vector representing the collection of linear coefficients associated with the qth latent function across the L outputs, so that
 $ \mathbf{f(x)} = \sum_{q=1}^Q \mathbf{a}_qu_q(\mathbf{x})$
. It follows that the covariance for
 $\mathbf{f(x)}$
is
 \begin{align} \mathbf{C}(x,x') = \textrm{Cov} \left(\mathbf{f(x)},\mathbf{f(x')} \right) & = \textrm{Cov}\bigg(\sum_{q=1}^Q \mathbf{a}_qu_q(\mathbf{x}),\sum_{q=1}^Q \mathbf{a}_qu_q(\mathbf{x'})\bigg) \notag\\ & = \bigg(\sum_{q=1}^Q \mathbf{a}_q\mathbf{a}_q^T\bigg) \otimes \textrm{Cov} \left(u_q(\mathbf{x}),u_q(\mathbf{x'}) \right) \notag \\ & = AA^T \otimes C^{(u)}(\mathbf{x,x'}) \end{align}
where matrix
 $A = (\mathbf{a}_1,\ldots,\mathbf{a}_Q)$
and
 $\otimes$
is the Kronecker matrix product. Re-parametrising by
 $B\,:\!=\,AA^T$
, (9) can be expressed as the Kronecker product between the cross-population covariance
 $B \in \mathbb{R}^{L \times L}$
and the covariance over the Age–Year inputs
 $\mathbf{C}^{(u)} \in \mathbb{R}^{N \times N}$
:
 \begin{equation} \mathbf{C}=\textrm{Cov}(\mathbf{f(x),f(x')}) = B \otimes \mathbf{C}^{(u)}\end{equation}
The coregionalisation matrix B has rank Q. Under ICM, the number of hyperparameters in the cross-population covariance is reduced from
 $L(L-1)/2$
to
 $Q \times L$
. Hence, taking
 $Q < L/2$
allows to reduce the hyperparameter space and alleviate the computational budget compared to the “full rank” setup.
ICM is a special form of the linear coregionalisation model (LCM) (Alvarez et al., Reference Alvarez, Rosasco and Lawrence2011). In LCM, the independent latent functions are from different GP priors to capture all possible variability from multiple outputs. Its application is beyond the scope of this paper. Notably, the assumption in ICM that all L populations share the common spatial covariance suits our interest in the inference of joint length-scales in Age and Year dimensions. The computational complexity required in ICM is greatly simplified due to the properties of the Kronecker product. Finally, ICM allows the process variance
 $\eta^2_l$
to vary by populations, i.e., the lth element in the diagonal in B is the process variance for population l. This further bolsters the flexibility in MOGP to excel in out-of-sample forecasts.
The Kronecker decomposition in (10) is also highly useful to speed up the overall fitting. The most expensive step in building a MOGP is solving for the inverse of the covariance matrix
 $\mathbf{C}$
that shows up in the log-likelihood function. Indeed, inverting this
 $LN \times LN$
matrix is computationally expensive even for modest values of L and N. Since the inverse of the Kronecker product is equal to the product of the respective inverses:
 $\big(B \otimes C^{(u)}\big)^{-1} = B^{-1} \otimes \big(C^{(u)}\big)^{-1}$
, the ICM structure reduces the computational complexity from
 $\mathcal{O}( (LN)^3 )$
to
 $\mathcal{O}( L^3 + N^3 + LN)$
. In our experience, this translates to a factor of 2–4 speed-up in computational time, allowing us to scale up to 10–12 populations. We emphasise that the overall MOGP (and ICM) structure is completely agnostic to L, so that exactly the same numerical method is applied to handle
 $L=2$
populations or
 $L=10$
.
Selecting ICM rank
Q
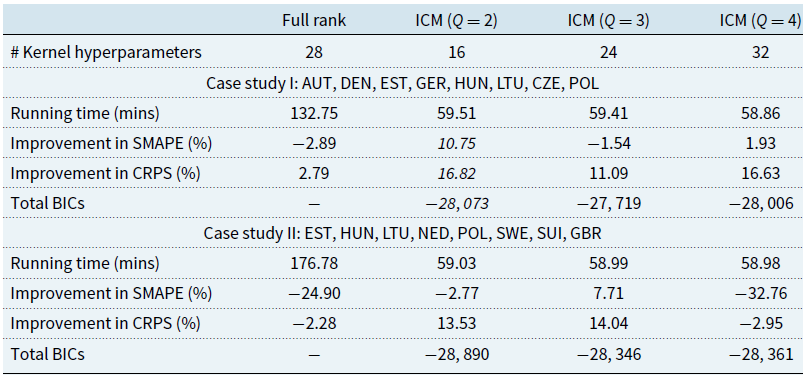
. Because Q is not one of the hyperparameters to be optimised, we exploit the Bayesian information criterion (BIC) to select the value of Q for the most parsimonious models. To illustrate the role of the rank Q of an ICM kernel, Table 1 compares several MOGP models with different
 $Q=2,3,4$
. We consider two case studies, both with
 $L=8$
but with different constituent populations. First, we note the remarkably faster training time (3-time speedup) in ICM relative to a full-rank kernel; notably the speedup is independent of Q and is driven by the Kronecker matrix algebra. Second, we note that most ICM models have better predictive performance (see sections 2.7 and 3.1 below for explanation of symmetric mean absolute percentage error (SMAPE) and CRPS) than the kernel from (7). Third, BIC criterion suggests that
 $Q=2$
is the preferred model in both cases. Note that there are only
 $2L = 16$
hyperparameters in the resulting ICM kernel, almost twice as few as
 $L(L-1)/2 = 28$
hyperparameters in the respective (7).
Non-rectangular datasets. We have discussed the use of ICM for isotropic data. The ICM framework can be extended to deal with partially heterotropic data where only a portion of L inputs are available and which arises in HMD due to missing data especially at the most recent years. Let M’ be the number of distinct inputs across L populations and
 $M = N_1+\ldots+N_L$
be the number of observations in training data. We consider the setting that
 $M' < ML$
so that for some inputs not all L outputs are observed. Define the vector-valued “complete data” function
 $\mathbf{f(x)}$
, with
 $\mathbf{f(x)} \in \mathbb{R}^{LM' \times 1}$
. We further introduce
 $\mathbf{f}^o\mathbf{(x)}$
as the vector-valued function corresponding to the observed outputs,
 $\mathbf{f}^o\mathbf{(x)} \in \mathbb{R}^{M \times 1}$
. The relation between
 $\mathbf{f(x)}$
and
 $\mathbf{f}^o\mathbf{(x)}$
is formulated through the “communication” matrix S,
 $\mathbf{f}^o\mathbf{(x)} = S^T\mathbf{f(x)}$
, where
 $S \in \mathbb{R}^{LM' \times M}$
. The column vectors in S are orthonormal with values of 0 and 1 to eliminate the unobserved outputs, see Skolidis & Sanguinetti (Reference Skolidis and Sanguinetti2011). Applying linear transformation to a MVN vector, we can then identify the distribution of
 $\mathbf{\mathbf{f}^o\mathbf{(x)}}$
as a GP with covariance:
 \[\textrm{Cov}(\mathbf{f}^o\mathbf{(x)},\mathbf{f}^o\mathbf{(x')})=S^T \textrm{Cov}(\mathbf{f(x)},\mathbf{f(x')})S = S^T(B \otimes K)S\]
recovering the Kronecker structure
2.4 GP hyperparameters
To implement a GP model requires specifying its hyperparameters. Note that actual inference reduces to linear-algebraic formulas in (12)–(13), and the modelling task is to learn the spatial covariance, namely the mean and kernel functions.
Comparison between full-rank and ICM MOGP models. Improvement in SMAPE and CRPS uses Hungary as the target population and compares MOGP with respect to SOGP Hungary model. The reported percentages are averages over 1-year ahead Hungarian mortality forecasts for Ages 70–84 based on three training sets: 1990–2013 (predict 2014), 1990–2014 (predict 2015) and 1990–2015 (predict 2016) for same Ages 70–84. Best metrics are in italics

2.4.1 Mean function
To capture the long-term longevity features, such as higher mortality at higher ages, we fit a parametric prior mean:
 \[m(x)=\beta_0+\sum_{j=1}^p \beta_jh_j(x)\]
where
 $h_j$
’s are given basis functions and the
 $\beta_j$
’s are unknown coefficients. The coefficients
 $\boldsymbol{\beta}=(\beta_1,\ldots,\beta_p)^T$
are estimated simultaneously with other hyperparameters. Let
 $\mathbf{h}(x)=\big(h_1(x), \ldots,h_p(x)\big)$
,
 $\mathbf{H}=\big(\mathbf{h}(x^1),\ldots,\mathbf{h}(x^N)\big)$
and
 $\mathbf{D=(C+\Sigma)^{-1}H}$
, then the posterior mean of
 $\boldsymbol{\beta}$
along with the predicted posterior mean
 $m_*(x_*)$
and respective variance
 $s_*^2(x_*)$
for a new input
 $x_*$
are
 \begin{align} \hat{\boldsymbol{\beta}} &\ =(\mathbf{H}^T\mathbf{D})^{-1}\mathbf{H}^T\mathbf{(C+\Sigma)}^{-1}\mathbf{y}; \end{align}
 \begin{align} m_*(x_*) &\ = \mathbf{h}(x_*)^T\hat{\boldsymbol{\beta}}+\mathbf{c}(x_*)^T\mathbf{(C+\Sigma)}^{-1}(\mathbf{y-H}\hat{\boldsymbol{\beta}}); \end{align}
 \begin{align} s^2_*(x_*) &\ = C(x_*,x_*)+ (\mathbf{h}(x_*)^T -\mathbf{c}(x_*)^T\mathbf{D})^T(\mathbf{H}^T\mathbf{D})^{-1} (\mathbf{h}(x_*)^T-\mathbf{c}(x_*)^T\mathbf{D})\end{align}
We note that the mean and kernel functions interact: choosing the mean function is analogous to de-trending, and choosing the covariance function is analogous to modelling the residuals. An informative mean function will imply that the residuals are smaller (lower
 $\eta^2$
) and de-correlated (small
 $\theta$
’s) compared to assuming a constant mean, which will lead to high
 $\eta^2$
and larger
 $\theta$
’s.
Within a multi-population model, we use a linear mean function to take into account the different trends across populations:
 \begin{equation} m(x^n)=\beta_0+\beta_1^{ag}x^n_{ag}+\sum_{l=2}^{L} \beta_{pop,l} x^n_{pop,l}\end{equation}
Analogous to the coefficients of categorical covariates in regression,
 $\beta_{pop,l}$
can be interpreted as the mean difference between log-mortality in population l and the baseline. Note that (14) implies the same shared Age structure – mortality rates rising exponentially in
 $x_{ag}$
with slope
 $\beta_1^{ag}$
in all populations.
2.4.2 Observation likelihood
We assume a constant observation noise within each population
 $\sigma_l = \textrm{StDev}(\epsilon^i)$
for all i in (2) where
 $x^i_{pop,l} = 1$
. This accounts for heterogeneous characteristics when observations from multiple populations are combined, in particular
 $\sigma_l$
is smaller for larger populations (Huynh et al., Reference Huynh, Ludkovski and Zail2020). The
 $\sigma_l$
’s are estimated via maximum likelihood or Markov Chain Monte Carlo along with all other hyperparameters. While assuming homogeneity of noise variance in terms of Age and Year is not entirely realistic, based on the discussion in Ludkovski et al. (Reference Ludkovski, Risk and Zail2018), the impact of more complex observation models is minimal. A common alternative is to assume a Poisson likelihood; however it is well known that mortality data are overdispersed, so a Poisson parametrisation is also mis-specified.
2.4.3 Estimating the parameters
In single-population GP, the set of hyperparameters is
 $\Theta = (\theta_{ag},\theta_{yr},\eta^2,\sigma^2, \boldsymbol{\beta})$
. We can learn values of the hyperparameters via optimisation of the marginal likelihood function which is the integral of the likelihood times the prior:
 $p(\mathbf{y|x},\Theta)=\int p(\mathbf{y|f},\Theta)p(\mathbf{f|x},\Theta)d\mathbf{f}$
. Since
 $p(\mathbf{y|x},\Theta)=\mathcal{N}(\mathbf{m,C+\Sigma})$
and if we assume the mean function is known or fixed, the log-likelihood of the marginal is simply a MVN density:
 \begin{equation}\log p(\mathbf{y|x},\Theta) = -\frac{1}{2}\mathbf{y}^T(\mathbf{C+\Sigma})^{-1}\mathbf{y}-\frac{1}{2}\log |\mathbf{C+\Sigma}|-\frac{N}{2}\log(2\pi)\end{equation}
Thus, we have to solve a system of nonlinear equations to maximise (15) which yields the maximum likelihood estimate (MLE). We implement SOGP fitting via the function km() from the package DiceKriging (Roustant et al., Reference Roustant, Ginsbourger and Deville2012) in R. That package carries out MLE of
 $\Theta$
using a genetic optimisation algorithm. In MOGP with ICM kernel, the hyperparameters are
 $\Theta = (\theta_{ag}, \theta_{yr}, (a_{l,q}), (\sigma^2_l), \boldsymbol{\beta})$
. We use the R package kergp (Deville et al., Reference Deville, Ginsbourger and Roustant2019) to carry out the respective MLE via Kronecker decompositions.
2.5 Bayesian GP regression
The GP hyperparameters summarise the covariance structure of the fitted mortality model. The MLE method provides a point estimate
 $\Theta_{MLE}$
of that structure, i.e. a “best guess” of a GP surface that fits the data. Uncertainty quantification is a major component of our analysis, in particular in assessing how similar or different are the various populations. To this end, we aim to quantify model risk, i.e. the range of GP models that are consistent with the data via a Bayesian formulation. The Bayesian GP starts with a prior on
 $\Theta$
and then integrates out the likelihood of the observed data to obtain the posterior distribution of the hyperparameters. A point estimate of
 $\Theta$
is additionally obtained from the maximum a posteriori (MAP) hyperparameters,
 $\Theta_{MAP} = \textrm{argmax}_{\Theta} \sum_i\log p(y_i|\Theta) p(\Theta)$
. In fact, MLE can be viewed as a special case of MAP with improper uniform priors. In our analysis, we employ weakly informative priors to minimise influence of a priori assumptions (so that the data speaks for itself) but still regularise inference by keeping hyperparameters within reasonable ranges.
In practice, computing the posterior density
 $p(\Theta|\mathcal{D})$
requires to evaluate an intractable multidimensional integral. MCMC algorithms bypass this challenge by drawing samples
 $\Theta^{(1)},\Theta^{(2)}, \dots,\Theta^{(M)}$
from the posterior. Traditionally, MCMC sampling for GP models was challenging due to strong correlation among the hyperparameters. Recently, powerful new techniques, in particular Hamiltonian Monte Carlo (HMC), have been developed to overcome this challenge. We implement Bayesian GP using Stan (Carpenter et al., Reference Carpenter, Gelman, Hoffman, Lee, Goodrich, Betancourt, Brubaker, Guo, Li and Riddell2017) that is built upon efficient HMC. Stan is a free, open-source software, written in C++ language, and has risen to be one of the most efficient toolboxes to perform Bayesian inference and optimisation for statistical models.
Following Stan recommendations, we standardise the input covariates by subtracting the mean and dividing by the standard deviation,
 $x^i_{ag,std}\,:\!=\,(x^i_{ag}-\mu_{\mathbf{x}_{ag}})/\sigma_{\mathbf{x}_{ag}}$
to reduce the autocorrelation between the hyperparameters and thus increase the efficiency in the MCMC chains. HMC in Stan further helps to cope with this autocorrelation. Stan returns a set of posterior MCMC samples for
 $\pmb{\beta}$
and
 $\Theta$
based on standardised data, so we then have to convert these values back to the original scales. For instance, the sampled hyperparameters
 $\beta^{std}_\cdot$
of the linear mean function are transformed back by:
 \begin{equation*}\begin{aligned} m(x^i) & =\beta_0+\beta_1^{ag}x_{ag}^i =\beta_0+\beta_1^{ag}(x_{ag,std}^i\sigma_{\mathbf{x}_{ag}}+\mu_{\mathbf{x}_{ag}}) \\ & = \big(\beta_0+\beta_1^{ag}\mu_{\mathbf{x}_{ag}}) + \beta_1^{ag}\sigma_{\mathbf{x}_{ag}}x_{ag,std}^i \\ \end{aligned}\end{equation*}
Thus,
 $\beta_1^{ag}=\frac{\beta_1^{ag,std}}{\sigma_{\mathbf{x}_{ag}}}$
and
 $\beta_0=\beta_0^{std}-\bigg(\frac{\beta_1^{ag,std}}{\sigma_{\mathbf{x}_{ag}}}\bigg)\mu_{\mathbf{x}_{ag}}$
; in similar fashion, we can transform the length-scales in the covariance kernel:
 $\theta_{ag}=\sigma_{\mathbf{x}_{ag}}\theta_{ag}^{std}$
and
 $\theta_{yr}=\sigma_{\mathbf{x}_{yr}}\theta_{yr}^{std}$
.
2.5.1 Bayesian versus MLE MOGP
To illustrate uncertainty quantification of a MOGP using a Bayesian Stan framework, we build a joint model on four Male populations from Denmark, France, Sweden and UK. The MOGP model uses the full-rank kernel (7) trained on Ages 70–84 and Years 1990–2012. For Bayesian hyper-priors we take
 $\beta_0 \sim \mathcal{N}(-4,0.5)$
,
 $\beta_1^{ag} \sim \mathcal{N}(0,0.5)$
. Inverse-Gamma priors are chosen for the covariance hyperparameters:
 $\theta^{std}_{ag} \sim \text{Inv-Gamma}(9,12)$
,
 $\theta^{std}_{yr} \sim \text{Inv-Gamma}(9,12)$
which ensures that 99% of the respective prior is concentrated between 0.01 and 3.3 (Betancourt, Reference Betancourt2017). For the process variance, we take
 $\log\eta^2 \sim \mathcal{N}(-3,1)$
, and for observation noise
 $\sigma^2 \sim \mathcal{N}_+(0,0.5)$
. Finally, for the population length-scales in (7), we use
 $\log \theta_{l_1,l_2} \sim \mathcal{N}(-1,1)$
for all
 $l_1, l_2$
. (Implementing a Stan model for ICM kernels is beyond the scope of this work.)
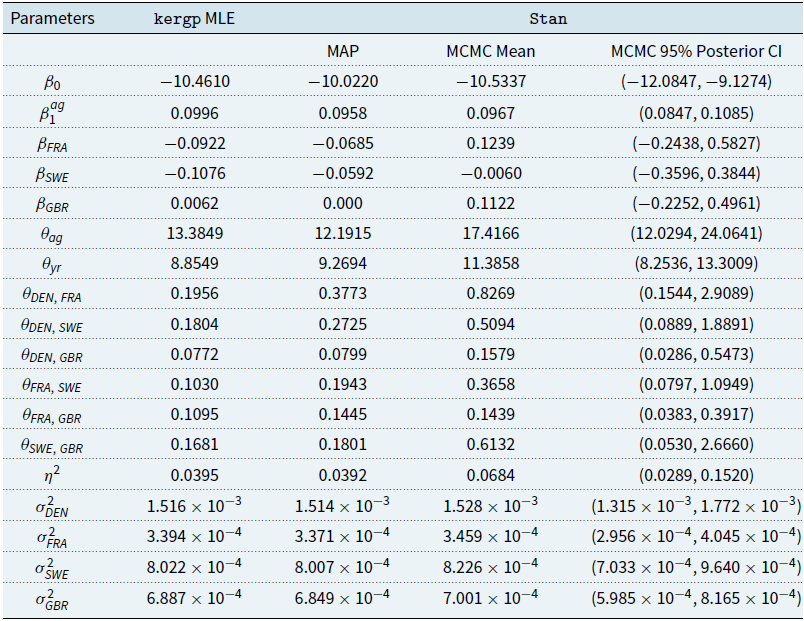
Table B.1 in the Appendix reports all the resulting hyperparameters using the kergp engine in R and the Stan HMC. We observe that all MLE fits are within the 95% posterior credible intervals from the Stan model. Also, the 95% credible interval for
 $\beta_1^{ag}$
confirms the significance of the linear effect of Age. Treating Denmark as the baseline country in the mean function, the 95% CIs of all coefficients
 $\beta_{pop,l}$
’s contain 0, implying that the differences in mortality between Denmark and other populations are not statistically significant. This indicates that there is no clear difference in the respective mortality experience which is intuitive since all populations are from developed countries within the same geographic area.
2.6 Kernel selection
The choice of the kernel family is the centrepiece of GP modelling. In this article, we employ the SE kernel, but manifold alternatives exist. Investigating which kernel is best is beyond the scope of this paper which focuses on how to capture the multi-population aspect, while kernel selection is best analysed within a single-population setting. Indeed, our main construction in (7) relies on multiplying the single-output kernel
 $\tilde{C}$
with the cross-population covariance structure
 $\Gamma$
, so that one can straightforwardly substitute any
 $\tilde{C}$
.
To this end, let us briefly discuss three useful ways to do so. First, one may consider other kernel functions, such as the Matérn family (Rasmussen & Williams, Reference Rasmussen and Williams2005); in particular Matérn-5/2 is a common default choice in a machine learning context. Compared to SE which yields infinitely differentiable
 $m(\cdot)$
, Matérn-5/2 gives predictive means that are only twice differentiable. In particular, this implies that the respective MI would be just once-differentiable and might exhibit higher-order discontinuities. Empirically, that leads to more “wiggly” fits that visually fit the historical data closer. Because mortality is expected to change slowly and smoothly, such behaviour might not be desirable, although a comprehensive analysis is needed to assess which kernel works better.
Second, one may employ composite kernels, i.e. go beyond the simple form of the SE kernel through adding and multiplying several covariance functions. We refer to Duvenaud (Reference Duvenaud2014) for a comprehensive guide. For instance, one may embed a linear trend in Age directly inside the covariance function by taking
 \begin{align}\tilde{C}(x^i,x^j) = \alpha^2_0 + \alpha^2_{ag}x^{i}_{ag}x^{j}_{ag} + \eta^2\textrm{exp}\bigg[-\frac{(x^i_{ag}-x^j_{ag})^2}{2\theta_{ag}^2}-\frac{(x^i_{yr}-x^j_{yr})^2}{2\theta_{yr}^2}\bigg]\end{align}
This allows to set the priors of the mean parameters within the covariance kernel.
Third, one may design custom covariance functions that target special features of mortality surfaces. For example, it is well known that many populations exhibit a birth cohort effect, whereby mortality is a function not just of Age and Year, but also of Birth Year = Year
 $-$
Age. Thus, one could consider a kernel that takes incorporates dependence on Birth Year. One example is
 \begin{align}\tilde{C}(x^i,x^j)= \eta^2\textrm{exp}\bigg[-\frac{(x^i_{ag}-x^j_{ag})^2}{2\theta_{ag}^2}-\frac{(x^i_{yr}-x^j_{yr})^2}{2\theta_{yr}^2}-\frac{(x^i_{yr}-x^i_{ag}-x^j_{yr}+x^j_{ag})^2}{2\theta_{bc}^2}\bigg]\end{align}
This would work exactly like the analysis below, except one must fit three length-scale hyperparameters
 $\theta$
. Note that because the covariates enter into the covariance function nonlinearly, there is no issue with parameter identification.
As mentioned, all the above generalisations would be computationally trivial to add. Some effort might be necessary to obtain the analytic expressions for mortality improvement (MI, i.e. the gradient of
 $\tilde{C}$
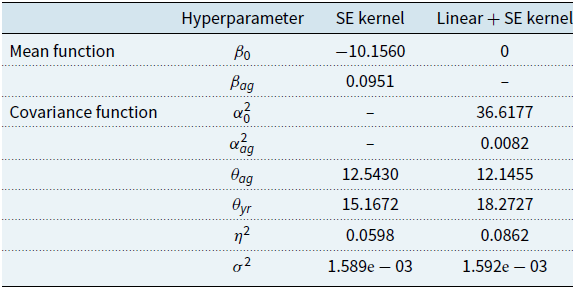
). Rigorous model selection would require to focus on a given performance metric (such as SMAPE) and would also need to account for the varying model complexity. Appendix C provides illustrations of employing alternative kernel families, namely a Matern-5/2 kernel, an additive linear + SE kernel and the Birth Cohort kernel from (17). Based on numerical experiments, we find that all the above modifications play a second-order role in the quality of the model.
2.7 Performance metrics
To assess model performance we employ two metrics. First, we consider out-of-sample predictive accuracy, comparing realised future mortality to its mean model forecast. The most common choice is root mean squared error (RMSE); however RMSE is highly sensitive to outliers and also to the fact that mortality errors will be necessarily larger at higher Ages due to smaller exposed cohorts. To remedy this, we employ the mean absolute percentage error (MAPE) metric, specifically its symmetric (SMAPE) version that corrects for the tendency of MAPE to put heavier penalties on over-estimating the observations (Armstrong & Collopy, Reference Armstrong and Collopy1992; Makridakis, Reference Makridakis1993):
 \begin{equation} \text{SMAPE} \,:\!=\, \frac{100}{M} \sum_{i=1}^M \frac{|y^i_*-m_*(x^i_*)|}{(|y^i_*|+|m_*(x^i_*)|)/2}\end{equation}
where
 $y^i_*$
is the realised observed value at test input
 $x_*^i$
and
 $m_*(x^i_*)$
is the predicted log-mortality rate by the model. Unlike the squared errors, SMAPE is a scale-independent measure that is convenient to compare across different datasets.
In addition to SMAPE, we also use the CRPS metric to assess the quality of the probabilistic forecasts produced by a MOGP. Indeed, one of the major benefits of GP-based mortality models is a full distribution for future observations
 $y_*(x_*)$
which allows a more detailed uncertainty quantification beyond just looking at the predictive mean
 $m_*(x_*)$
. CRPS is an example of a proper scoring rule and is defined as
 \begin{equation} \text{CRPS}(F,y_*) \,:\!=\, \int_{\mathbb{R}}\left(F(z)-\mathbbm{1}_{\{z \geq y_* \}} \right)^2 \, dz\end{equation}
where F is the predictive (cumulative) distribution and
 $y_*$
is the realised outcome. Averaging over many outcomes, CRPS can be interpreted as the squared difference between the forecasted and the empirical cumulative distribution functions. In particular, CRPS penalises both bias and excessive predictive variance. A model with lower mean CRPS is judged to be better.
Mortality improvement factors. A common way to interpret a mortality surface is via the (annual) mortality improvement factors which measure longevity changes year-over-year. In terms of the observations, the raw annual percentage mortality improvement is
 $1-\frac{\exp\big(y(x_{ag};x_{yr})\big)}{\exp\big(y(x_{ag};x_{yr}-1)\big)}$
. The smoothed improvement factor is obtained by replacing y’s by the GP model posterior
 $m_{*}$
’s:
 \begin{equation} \partial m^{GP}_{back}(x)\,:\!=\,\Bigg[1-\frac{\exp(m_{*}(x_{ag};\ x_{yr}))}{\exp(m_{*}(x_{ag};\ x_{yr}-1))}\Bigg]\end{equation}
3. Maximising Predictive Accuracy through Joint Modelling
We begin our illustrations by showcasing the improved predictive accuracy available from fusing data from two populations. Our first case study includes Male mortality modelling across Sweden and Denmark (
 $l=1$
: Denmark and
 $l=2$
: Sweden). The two countries share similar demographic characteristics and are Nordic neighbours. Our mean function takes into account the separation in mortality between Denmark and Sweden:
 \begin{equation} m(x^n)=\beta_0+\beta_1^{ag}x^n_{ag}+ \beta_{pop,2} x^n_{pop,2}\end{equation}
Analogous to a coefficient of categorical covariates in regression,
 $\beta_{pop,2} \equiv \beta_{SWE}$
can be interpreted as the mean difference between log-mortality in Sweden and in the baseline country, Denmark. Our second case study looks at joint Male/Female modelling for Denmark; in that case
 $\beta_{pop,2} \equiv \beta_{FEM}$
is the mean difference between female log-mortality and male log-mortality.
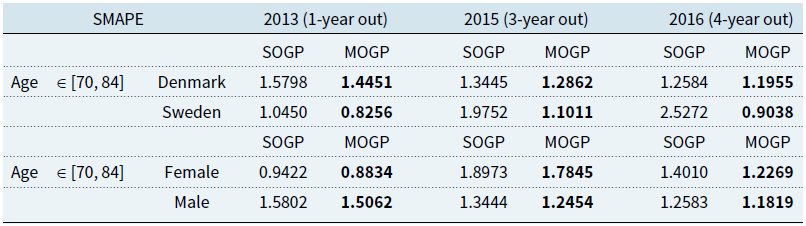
Prediction accuracy via SMAPE for SOGP and two-population full-rank models. The test set is Ages 70–84 in Years 2013, 2015 and 2016

Figure 1 shows the raw observations together with the GP-based predictive intervals for the first case study. Specifically, we plot the 95% predictive credible bands for
 $y_*(x_*)$
for three representative ages. The forecast period includes both in-sample (1990–2012) and out-of-sample (2013–2020). We observe that while for Denmark the differences between SOGP and MOGP forecasts are very slight, in Sweden the two forecasts differ noticeably out-of-sample. Table 2 compares the predictive accuracy between the models and indicates that the MOGP forecast is more accurate (smaller SMAPE) in both populations.
95% credible intervals for observed log-mortality
 $y(x_*)$
across the individual SOGP and full MOGP models. Top row: Denmark Males; bottom row: Sweden Males. Up to 2011, the smoothed mortality curves and CIs are essentially identical.

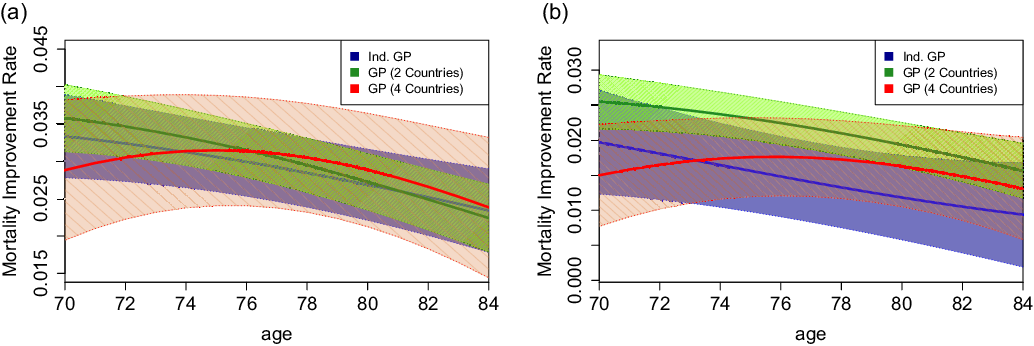
To highlight further differences between SOGP and full MOGP, Figure 2 examines the respective predicted annual mortality improvement factors
 $\partial m^{GP}_{back}(x)$
. We compare SWE and DEN SOGPs against a two-population DEN+SWE MOGP, and a four-population DEN+FRA+GBR+SWE MOGP model, cf. Table B.1 in the Appendix. Large
 $\theta_{ag}$
length-scales in SOGP models lead to essentially linear improvement rate factors (blue curves). In the SWE + DEN MOGP (green curves), the Age length-scale decreases and
 $s_*(x_*)$
falls, so the improvement rate factors become more Age-dependent and with tighter credible bands. This effect becomes even stronger with four populations. The corresponding smoothed curves (coloured in red) are quite nonlinear, and in particular imply that improvement at young Ages (
 $<60$
) has slowed dramatically. This illustrates that a joint model is better able to distinguish between signal and “noise” and therefore pick up divergent changes in mortality faster, while a single-population model would often smooth latest changes away.
3.1 Selecting populations for a joint model
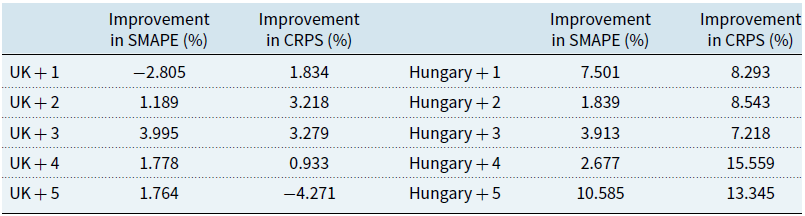
Intuitively, incorporating more information from different populations through a MOGP ought to produce more accurate predictions and reduce predictive uncertainty. To visualise how increasing L affects the changes in SMAPE and CRPS, Table 3 reports the 3-year average improvement in these metrics as L varies from 2 to 6. (ICM ranks
 $Q=Q(L)$
were selected each time using BIC.) Overall, we observe that information fusion is very helpful for Hungary, but not as much for UK. This links to the respective credibility of the target populations: observation noise
 $\sigma_l^2$
is large in Hungary but low in UK, so additional data will benefit the former more.
Prediction quality via 3-year average improvement in SMAPE and CRPS in ICM models with
 $L=2,\ldots,6$
populations. The baseline models are SOGP for UK and Hungary, respectively

Comparison of annual mortality improvement factors between different joint models. Besides the mean improvement factors
 $\partial m^{GP}_{back}(ag;2012)$
(20) for Ages
 $70,\ldots,84$
, we also show the respective 95% posterior credible band. (a) Denmark Males. (b) Sweden Males.

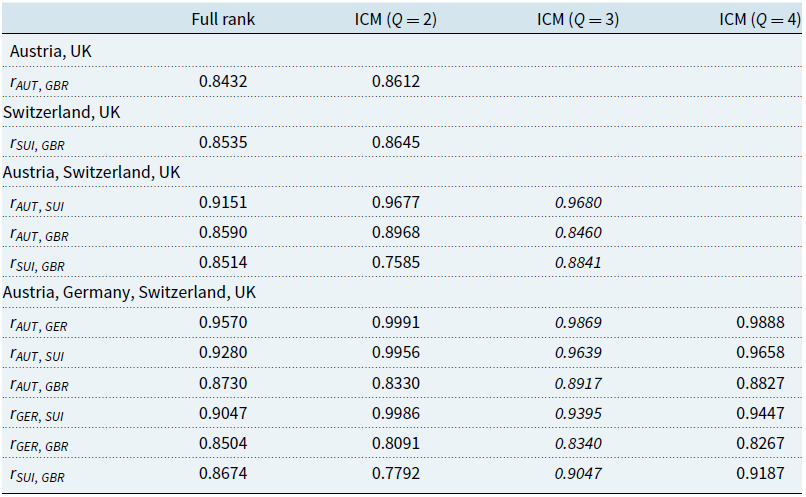
From a complementary perspective, Table 4 shows how the inferred cross-population correlations change as we add a new populations. We report results both for a full-rank MOGP and for ICM with
 $Q=2,3,4$
. We observe that the correlation matrix is generally stable, although some correlations can be quite different moving from one rank to another. In the AUT-SUI-GBR model, the correlation between Switzerland and UK is
 $r_{SUI,GBR}=0.76$
when
 $Q=2$
, but rises to 0.88 when
 $Q=3$
. We further note a broad agreement between the correlation structure learned with an ICM and full-rank MOGP kernels.
Cross-corelation among two to four populations in MOGP models. All models are fitted on Ages 70–84 and reported values are averages over 3 training sets covering 1990 through 2014–2016. Italics indicate the ICM model with the smallest BIC

The factor loadings (
 $a_{l,q}$
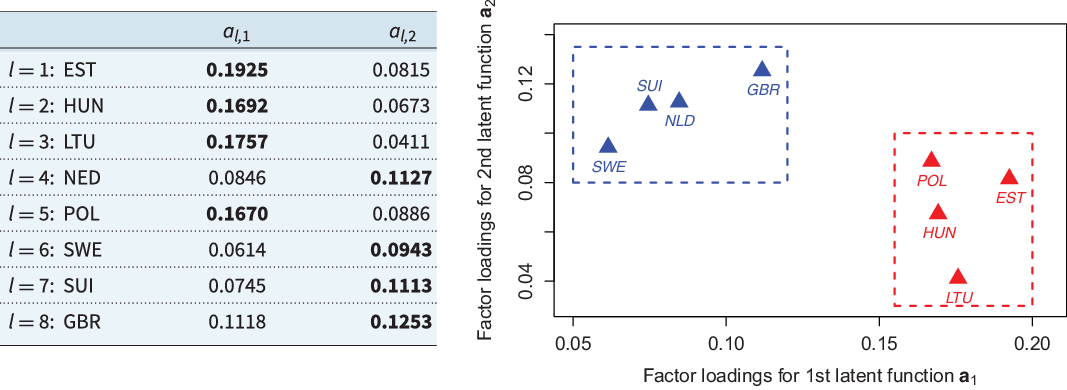
’s) in ICM provide insight regarding the dependence patterns across populations. The interpretation of ICM loadings is analogous to principal component analysis when attempting to describe the data through independent transformed latent functions. For example, we consider factor loadings in case study II in Table 1. The best ICM kernel has rank
 $Q=2$
suggesting that two latent factors are sufficient to explain variation over the eight countries considered. In fact, the first latent component is strongly correlated with Eastern-Central European countries while the second factor is the major contributor to the Western European population. This interpretation helps us identify two well-separated clusters among these eight countries, visualised in Figure 3 by plotting the ICM loadings
 $a_{l,2}$
against
 $a_{l,1}$
. Note that these factor loadings can be translated into correlation and imply that Hungary is more correlated with members in the same cluster and less correlated with Western European populations.
Factor loadings
 $a_{l,q}$
in the eight-population ICM with
 $Q=2$
in Table 1 – Case study II. The factor with the higher loading for each country is bolded in the Table on the left.

3.2 Incorporating latest data from other populations
In HMD, the reported data from different countries arrive non-synchronously. Indeed, the last available year of data varies from one country to another. The prevailing approach is to consider the time period that is common to all countries that are being modelled. This implies that the most recent observations may be dropped for some countries. Of course, such recent data are in fact the most informative for picking up new insights about the present longevity trend. Note that the HMD datasets are updated continuously, so that which datasets have the latest observations changes dynamically over time.
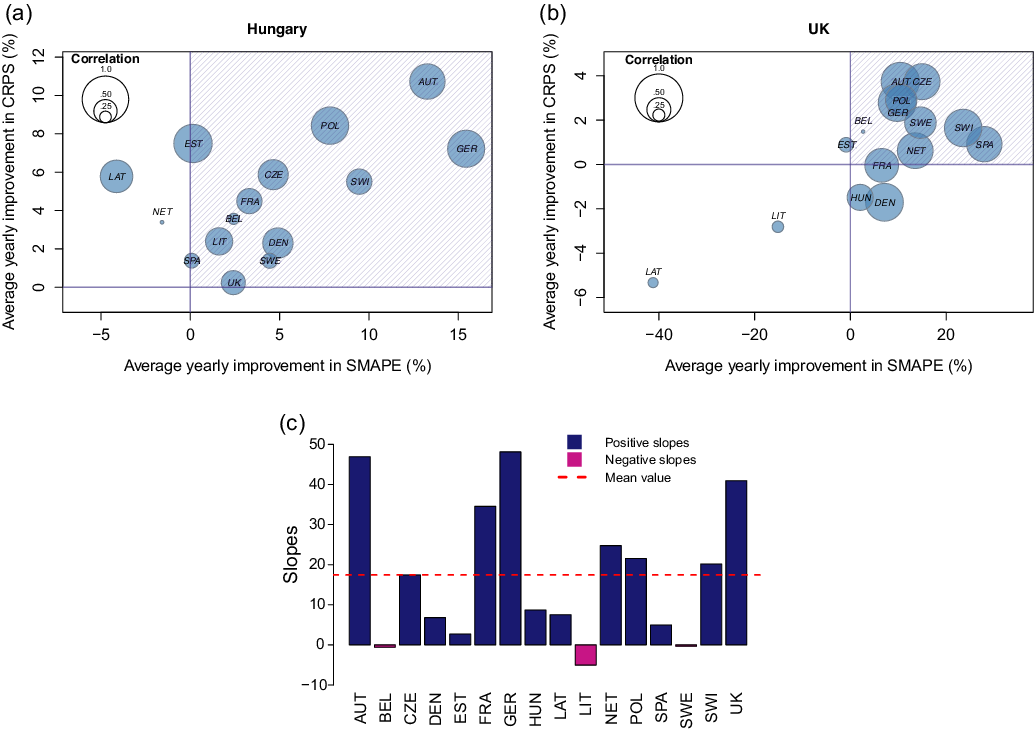
Prediction improvements for Hungarian and UK Males and the impact of cross-correlation on the improvement in SMAPE across 16 European national populations. (a) Hungary:
 $\sigma^2_l = 2.083\times 10^{-3}$
. (b) UK:
 $\sigma^2_l=6.834\times 10^{-4}$
. (c) Linear slope of improvement in SMAPE versus correlation.

To assess the value of information fusion and its link to population cross-correlation, we investigate the improvement in prediction in MOGP over SOGP. To do so, we set up a “notched” two-population training set where the foreign population has one more year of data and the assessment is based on one-year-ahead prediction for the domestic target population. Note that such “notch” extrapolation is not possible in the Lee–Carter framework that requires rectangular datasets. All ICM MOGP models take
 $L=2$
and are fitted on Ages 70–84 in three different time frames: period 1990–2013/2014 for 2014 forecast, 1990–2014/2015 for 2015 forecast and 1990–2015/2016 for 2016 forecast. The comparator training datasets for SOGP models did not have mortality information in the calendar year of forecast (e.g. training on 1990–2013 for 2014 forecast). We report the resulting 3-year average percent improvement in CRPS and SMAPE between MOGP and SOGP. The positive average improvement is equivalent to MOGP models having smaller SMAPE and CRPS.
Figure 4 displays the improvement in SMAPE and CRPS of two-population MOGPs versus SOGP. We plot the results against the correlation
 $r_{l_1, l_2}$
between the two populations modelled in MOGP and consider two randomly chosen target populations: Males in Hungary and Males in UK. Shaded regions indicate which MOGP models have both SMAPE and CRPS values less than the baseline. We observe that joint modelling generally yields higher improvement in Hungary compared to UK which is driven by the former’s relatively smaller population which translates into larger
 $\sigma_l$
and more opportunity for information fusion. Thus, for UK the single-population model is often competitive in its forecasting performance with a two-population MOGP.
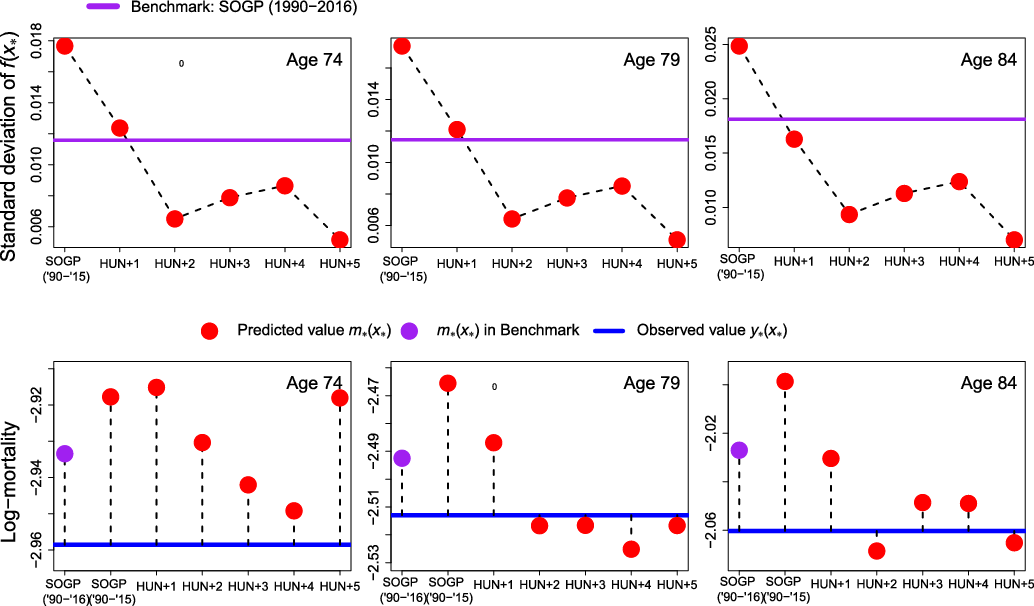
Comparison of prediction accuracy for 2016 log-mortality of Hungarian Males between different ICM-MOGP models with “notched” setup. Top row: standard deviation of
 $f(x_*)$
; bottom row: distance between predicted mean
 $m_*(x_*)$
and the observed value
 $y_*(x_*)$
.

The above discussion suggests that fusing highly correlated populations is better for predictive accuracy. To confirm this hypothesis, Figure 4(c) summarises the relationship between SMAPE improvement and correlation
 $r_{l_1,l_2}$
. We used all 16 populations as targets and built
 $16 \times 15$
two-population MOGPs to record the resulting MOGP-SOGP improvements in SMAPE like in the right and middle panels. For each target population, we then fitted a linear regression model treating the 3-year average improvement in SMAPE as the dependent outcome and the correlation as the independent variable: SMAPE CHANGE
 $= b_0 + b_1 r_{l_1, l_2}$
. Figure 4(c) displays the resulting slopes
 $b_1$
across the 16 populations. Positive
 $b_1$
implies that higher correlation leads to lower SMAPE, i.e. higher predictive accuracy. The mean value of the
 $b_1$
-slopes is highly positive and is around 20%. These empirical features suggest that one should indeed focus on aggregating related populations and discard unrelated ones. This is consistent with the results in Table 1 earlier. Most populations in Case Study II are less correlated with Hungary compared to Case Study I and as a result the SMAPE improvement in Case Study I is higher (10.75%) compared to Case Study I (
 $-2.77\%$
).
Moving beyond two populations, in Figure 5, we illustrate predictive gains for Hungarian Males due to incorporating most recent foreign data. This complements Table 3 that considered an isotropic dataset, with a notched setup instead. Our benchmark is a Hungary Males SOGP model fitted on 1990–2016. We then drop 2016 Hungary observations, but augment with 1990–2016 data from other countries and perform 1-year-out extrapolation to forecast 2016 Hungary mortality. These models are labelled as “HUN+1”, “HUN+2”, etc., to indicate the number of foreign populations considered. The top panels of Figure 5 visualise increasing forecast credibility, namely lower
 $s_*(x_*)$
, for Hungary as more and more correlated data are added. In fact, we see that a MOGP 1-year-out prediction with 3+ populations is more credible than direct smoothing of realised 2016 Hungary experience. As expected, we observe that credibility gains flatten out as L continues to grow and available information is saturated. The bottom panels of Figure 5 display the prediction errors
 $m_*(x_*)-y_*(x_*)$
relative to realised 2016 Hungary experience. Again, we see that higher L tends to generate less bias in prediction, confirm the earlier SMAPE analysis for isotropic case studies. Due to the strong observation noise, the pattern for a specific cell
 $x_*$
can be erratic, although in nearly all cases, MOGP easily beats out the plain SOGP. To conclude, borrowing latest information from nearby highly correlated populations is essentially as good as having the latest domestic data, and is significantly better than just using the available domestic data.
Remark: In Figure 5 (and earlier in Table 3), we add populations based on their correlation to the target population, i.e. we pool through estimated
 $\theta_{l_1,l_2}$
. In Appendix A, we discuss a simpler alternative based on comparing mean functions that capture historical mortality trends and then running a hierarchical clustering method.
4. Further Features of MOGP Models
4.1 Improved hyperparameter estimation
To illustrate the commonality in mortality experience in related populations, we perform Bayesian GP on four developed Western European countries: Sweden, Denmark, France and UK. Figure 6 shows the inferences of the length-scales for Age and Year along with MLE estimations when fitting SOGP models for each population versus jointly modelling them as groups of two, or jointly as all four together. The figures visualise how joint GP models produce tighter hyperparameter posteriors. For example, the posterior mean of
 $\theta_{ag}$
in Denmark is relatively large and its credible bands are wide compared to the other three countries (Figure 6(a)). However, once we pair Denmark with either Sweden, UK or France (Figure 6(a) – light blue, light green and purple CIs respectively), the credible bands of
 $\theta_{ag}$
become narrower and in the more reasonable range of
 $\theta_{ag} \in [15,30]$
. This effect is even further amplified when taking all four countries together. The underlying concept is that the more populations are added into the model, the closer we get at discovering the “universal” representation of mortality pattern. In Figure 6, the four-population MAP estimates of the length-scales (dashed horizontal lines) intersect with a majority of CIs suggesting that there is indeed a common covariance structure which is gradually revealed as we increase the training dataset. We also remark that the MLE estimates fall within the 95% posterior credible intervals from the Stan model indicating that Bayesian inference works properly.
Stan MCMC posteriors of the length-scales
 $\theta$
for Age and Year across populations and joint models with different groupings. The
 $+$
’s indicate the respective MLE estimates from a kergp model. The dashed lines indicate the MCMC MAP estimate from the four-population full-MOGP model. (a) Length-scale in the Age dimension. (b) Length-scale in the Year dimension.

This also highlights the ability of joint models to better estimate the hyperparameters by utilising multiple datasets. It is known that GPs might have difficulties in estimating length-scales, for example due to the likelihood function (15) being highly multi-modal, or conversely very flat around its maxima. Providing more data is one remedy. As discussed in Huynh et al. (Reference Huynh, Ludkovski and Zail2020), some SOGP will over- or under-smooth data while pooling data across multiple populations achieves shrinkage towards the global hyperparameter mean and provides a better fit.
4.2 Coherent mortality forecasts
Fitting GP models for individual populations tends to generate divergent long-term forecasts that are inconsistent with historical patterns. MOGP models do not have this limitation and maintain the historical characteristics observed in the data into the future. Namely, in MOGP models, the long-term forecast is driven by the prior of f, and specifically by the mean function
 $m(\cdot)$
. Thus, the relative differences in mortality between populations are controlled through the choice of
 $m(\cdot)$
, so that different ways of achieving coherence are transparent to the modeller. For the linear mean function in (14), the population coefficients
 $\beta_{pop,l}$
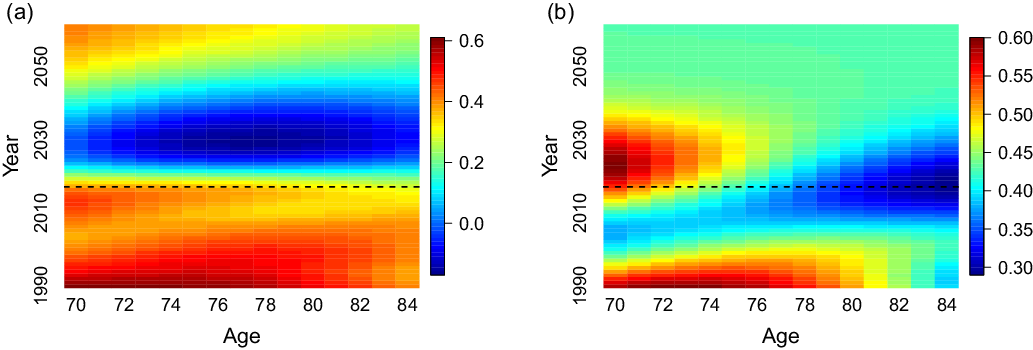
serve this purpose and represent the long-term spread between same-Age log-mortality rates. To illustrate the above, consider mortality differences due to gender. Women outlive men by 7 years on average in developed countries (United Nations, 2011). Modelling mortality for each gender separately fails to take into account this interdependence and tends to result in divergent and implausible long-run forecasts even if the same fitting procedure is applied. The heatmaps in Figure 7 display the projected Male–Female differences in log-mortality for Denmark; single-population models on the left imply that as early as 2030, Males will have lower mortality than females. In contrast, the MOGP forecast in the right panel is coherent: Females are projected to maintain higher longevity and historical patterns slow dissipate over time to the long-term gap of
 $\beta_{pop,2}-\beta_{pop,1} = 41.5\%$
between same-age Male and Female mortality.
Forecasted mean difference between Danish Male and Female mortality over 1990–2060. Training set was Ages 70–84 and Years 1990–2016 (edge of training set indicated by the dashed lines). (a) Male/Female difference in log-mortality in Denmark using individual (SOGP) models. (b) Male/Female difference in log-mortality in Denmark using a joint (full-rank MOGP) model.

Figure 8 shows the log-mortality and annual mortality improvement rates for Males aged 70 across seven European populations (indicated by colours), in the period from 1990 to 2060. We build a seven-population MOGP based on three different scenarios for m(x):
-
1. Zero long-term mortality improvement, captured by the linear mean function
 $m(x^n)=\beta_0+\beta_1^{ag}x^n_{ag}+\sum_{l=2}^{L} \beta_{pop,l} \big(x^n_{pop,l}\big)$
(dashed lines). All mortality improvement factors converge to zero (right panel) and the long-run mortality differences are summarised by the
$\beta_{pop,l}$
coefficients.
-
2. Long-term mortality improvement based on a historical pattern (thin solid curves). This is encapsulated via
$ m(x^n)=\beta_0+\beta_1^{ag}x^n_{ag}+\beta_1^{yr}x^n_{yr}+ \sum_{l=2}^{L} \beta_{pop,l} x^n_{pop,l}$
. In the long-run
$\partial m^{GP}_{back}(.;yr) \to \beta_1^{yr}$
(about 2% annual); again
$\beta_{pop,l}$
determine the long-run relative difference in longevity of different populations. -
3. Long-term mortality improvement based on expert judgement (thick solid lines). We again use
$m(x^n)=\beta_0+\beta_1^{ag}x^n_{ag}+\beta_1^{yr}x^n_{yr}+ \sum_{l=2}^{L} \beta_{pop,l} \big(x^n_{pop,l}\big)$
, but this time the
$\beta_1^{yr}$
coefficient is picked by the modeller and for illustrative purposes fixed at 1% to reflect recent slowdown in global MI. Since it is not possible to fully extrapolate the future longevity trends from past data, it is appropriate to use expert opinions about future mortality (Booth & Tickle, Reference Booth and Tickle2008).


Long-term mortality forecasting over years 1990–2060. The models are based on ICM kernel with
 $Q=3$
and are trained using Ages 70–84 and Years 1990–2016 over seven Male populations: Austria, Denmark, Germany, Netherlands, Sweden, Switzerland and UK. Dashed lines indicate the boundary between in-sample and out-of-sample forecasts. (a) Predicted log-mortality rate. (b) Annual mortality improvement factors.

We observe that the choice of
 $m(\cdot)$
has minimal impact on in-sample forecasts that are largely driven by the training data covering 1990–2016. On the other hand, the long-term levels of mortality improvement are completely driven by
 $m(\cdot)$
. Finally, for short-term extrapolation (roughly 2016–2025 in the Figure, reflecting the fitted Year length-scale
 $\theta_{yr} \simeq 10$
) the forecasts blend information from the training set and from
 $m(\cdot)$
. Note that in this example some of the individual mortality curves may cross, i.e. the relative order of longevity in different populations may change over time (such as Denmark surpassing Germany’s longevity) due to higher recent improvement rates. Nevertheless, we see a very strong coherence so that mortality rates across populations all move roughly in unison over time, matching our intuition about the persistent commonality of their future mortality experiences.
Remark: As noted throughout our analysis, the GP framework is based on exploiting the spatial correlation between data points. This data-driven nature of our model makes it not well-suited for long-range forecasts. The long-term prediction from the GP converges to its prior mean as the correlation between the historical training data and the future data points that are decades apart declines to zero. This de-correlation also leads to very high forecast uncertainty. With this in mind, the primary usage of our models is for “nowcasting” and medium-term (less than 10 years) uncertainty quantification of joint longevity experiences. Accurate short-term projections have been important for instance in the context of quantifying COVID-19 excess deaths, see https://nhanhuynh46.github.io/MOGPTutorials/SOGP_Covid19.html.
5. Conclusion
We have developed and investigated stochastic multi-population mortality models based on MOGP regression. In our approach, cross-population dependence is captured via spatial correlation that overlays the Age–Year structure. This yields a unified approach for any number of populations L; moreover, the proposed coregionalisation kernels allow to leverage the Kronecker structure and incorporate dimension reduction for the underlying cross-population factors. Our analysis of HMD data suggests that the MOGP approach is well-suited to selectively fuse mortality experience from similar datasets, where similarity can be interpreted through the spatial GP correlations
 $r_{l_1,l_2}$
. On the one hand, we find that pooling disparate populations can be counter-productive (since MOGP relies on the assumption of homogeneous Age–Year covariance pattern); on the other hand, pooling can indeed yield significant improvement in predictive accuracy, especially in smaller populations with low credibility.
Looking ahead, it would be worthwhile to investigate large-scale models, e.g. based on the full HMD database of 40 countries and 2 genders. This requires additional modelling infrastructure as the presented approach becomes computationally expensive for
 $L \gg 10$
populations (more than
 $N \gg 5,000$
total cells). There is currently a very active and ongoing progress on large-scale GP models especially for gridded data like in HMD, see, e.g., Flaxman et al. (Reference Flaxman, Gelman, Neill, Smola, Vehtari and Wilson2015). A different avenue of future research would be to systematically explore the best spatial covariance structures, as encapsulated by the kernel function
 $\tilde{C}(x, x')$
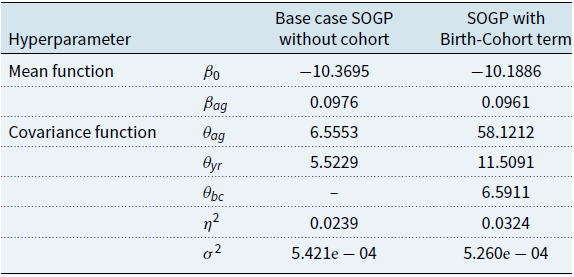
. In this paper, we focused on only using the SE kernel and standard Age- and Year-effects. It is feasible to consider further dependence formats, e.g. Birth Cohort effect (see Appendix C and Figure C.1 below), and other kernel families, such as the Matérn (Ludkovski et al., Reference Ludkovski, Risk and Zail2018). A third direction would be to revisit the observation variance assumption via GLM (generalised linear model) GP formulations.
Acknowledgement
We thank the anonymous referees and the associate editor for many useful suggestions. We also thank Howard Zail for several informative discussions. Ludkovski is partially supported by NSF DMS-1821240.
Appendix A. Clustering by Mortality Trends
In Section 3.1, we constructed multi-population MOGPs by first generating a large set of two-population models and then utilising the respective correlations
 $r_{l_1,l_2}$
to select the datasets that are most correlated to the target population. We also investigated a simpler alternative for deciding which populations to pool based on the similarity in their mortality trends. This approach does not require construction of any preliminary MOGPs and instead only looks at the GP mean function
 $m(\cdot)$
. Namely, we first estimate the shape of mortality for each population l via a linear mean function:
 $m_l(x)=\beta_{0,l} +\beta_{1,l}^{ag}x_{ag}+\beta_{1,l}^{yr}x_{ag}$
. We then calculate the root-integrated squared distance between
 $m_{l_1}(\cdot), m_{l_2}(\cdot)$
based on the given test set
 $x_{ag} \in \{50,\ldots,84\}$
and
 $x_{yr} \in \{1990,...,2012\}$
:
 \begin{align} D_{l_1,l_2} & =\sqrt{\int_{1990}^{2012}\int_{50}^{84}\bigg[(\beta_{0,l_1}-\beta_{0,l_2})+(\beta_{1,l_1}^{ag}-\beta_{1,l_2}^{ag})x_{ag} +(\beta_{1,l_1}^{yr}-\beta_{1,l_2}^{yr})x_{yr}\bigg]^2dx_{ag}dx_{yr}}. \end{align}
Dendrograms from hierarchical clustering of 32 HMD populations using the D-metric in (A.1). (a) Complete linkage. (b) Single linkage.

The above metric is employed within a hierarchical clustering method based on a specified dissimilarity measure. Figure A.1 displays the dendrograms extracted from hierarchical clustering of 32 populations (16 countries
 $\times$
{Male, Female}) via two different measures of dissimilarity: single linkage and complete linkage. We note that the resulting clusters naturally tend to separate males and females, reflecting the latter’s lower mortality. We also observe a strong geographic influence, so that neighbouring countries with similar demographics are indeed clustered together. The dendrogram could be used agglomeratively to build a MOGP. For example, using Hungary as the target population, Figure A.1 suggests first adding Estonia, then Lithuania, Latvia, etc. We find that this method is often as efficient as clustering by cross-population correlation, although going up the linkages often calls for fusing of two clusters, i.e. it is not designed for increasing L 1-by-1.
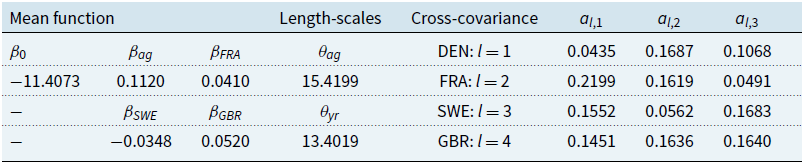
Appendix B. Fitted MOGP Hyperparameters Across Full-Rank and ICM Kernels and MLE/Bayesian Methods for the DEN-FRA-SWE-GBR Case Study
Cross-population correlation matrices. In the full-rank kernel (7), the correlation coefficient is
 $r_{l_1,l_2}\,:\!=\,\exp{(-\theta_{l_1,l_2})}$
. In the ICM model, the cross-covariance is
 $B = A A^T$
with the diagonals
 $B_{l,l}$
interpreted as the process variance of
 $f_l$
, from which we can similarly extract
 $r_{l_1,l_2}$
’s. Using {Denmark, France, Sweden, UK}
 $\equiv \{1,2,3,4\}$
we find that
 \begin{align*}\begin{bmatrix} r_{21} & & \\[2pt] r_{31} & \quad r_{32} & \\[2pt] r_{41} & \quad r_{42} & \quad r_{43} \\ \end{bmatrix} & = \begin{bmatrix} 0.82 & & \\[2pt] 0.83 & \quad 0.90 & \\[2pt] 0.93 & \quad 0.90 & \quad 0.84 \\ \end{bmatrix} \text{for full rank; and }\\[2pt] &= \begin{bmatrix} 0.75 & & \\[2pt] 0.73 & \quad 0.84 & \\[2pt] 0.96 & \quad 0.98 & \quad 0.89 \\ \end{bmatrix} \text{ for ICM}.\end{align*}
Hyperparameter estimates based on maximum likelihood (kergp) and maximum a posteriori probability (Stan), along with MCMC summary statistics using a joint mortality model across four countries: Denmark, Sweden, France and UK. Training set contains Males aged 70–84 during Years 1990–2012. Denmark used as baseline population in the mean function

Appendix C. Alternative Kernel Families
In this Appendix, we illustrate selecting alternative kernel families for the GP model as discussed in Section 2.6. Figure C.1(a) and (b) compares employing a Matérn-5/2 kernel instead of the squared exponential one. Namely, we replace the kernel definition with
 \[C(x,x')=\eta^2\prod_{k \in \{ag,yr\}} \left(1 + \frac{\sqrt{5}}{\theta_k}|x_k - x'_{k}| + \frac{5}{3\theta^2_{k}}(x_k - x'_{k})^2\right) e^{-\frac{\sqrt{5}}{\theta_{k}}|x_k - x'_{k}|}\]
Illustration I: Comparing a GP model with a Matérn-5/2 covariance kernel vis-a-vis one with a squared-exponential kernel. We show mortality rates and improvement rates for Danish Males. Both models are fitted via the ICM approach and use four populations from Denmark, France, Sweden and UK; Males, Ages 70–84 and Years 1990–2016. Illustration II: Heatmap of the predicted mortality improvement rates using a squared exponential kernel without and with a Birth–Cohort term (17) for UK Males. The single-population model is fitted on Ages 50–84 and Years 1990–2016. Effect of alternative covariance kernel specifications on the GP model output. (a) Mortality rates for Danish Males. (b) YoY improvement rates for Danish Males. (c) Base case (no Cohort). (d) With Birth-Cohort.

The results are illustrated via the smoothed mortality rates and the respective improvement rates for Danish Males. We observe that the Matérn-5/2-based fit hews closer to the historical data which leads to more “rough” mortality improvement factors. Otherwise, the differences are mild.
Table C.2 illustrates the impact of implementing a composite kernel, namely the sum of a linear kernel and a SE kernel in (16), see section 2.6. We again consider Male mortality in Denmark within a single-population setup. The selected composite kernel is functionally equivalent to an SE kernel with a linear trend function (Duvenaud, Reference Duvenaud2014), although the obtained results differ slightly since the optimised marginal likelihood functions are not algebraically the same. We do observe essentially the same results (they are visually identical which is the reason for not including a plot). Note that in Table C.2 the hyperparameters associated with the linear kernel,
 $\alpha_0^2$
and
 $\alpha_{ag}^2$
, can be thought as the priors of the intercept and the slope in Age, respectively. In contrast, with a parametric mean function,
 $\beta_0$
is interpreted as the intercept and
 $\beta_1$
as the linear trend in Age.
Section 2.6 also briefly discussed the potential to incorporate Year-of-Birth term into the covariance structure to capture cohort effects, cf. (17). Cohort effects manifest themselves in diagonal features on an Age–Year heatmap, see Figure C.1(c)–(d) where we illustrate with data for UK Males Ages 50–84 and Years 1990–2016. In the figure, we display model-predicted mortality improvement rates covering the in-sample cells, as well as forecasting out to year 2025. The bottom left panel (c) uses the base SE kernel without a Birth–Year term; one can clearly see several diagonal patterns for birth cohorts circa 1930, c. 1957 (both of which enjoyed larger than average MI) and c. 1965 (which is experiencing negative MI).
MOGP with rank
 $Q=3$
ICM kernel for Males in Denmark, France, Sweden and UK. The training dataset contains Ages 70–84 and Years 1990–2012

Comparison between the hyperparameters from fitting a fused kernel vis-a-vis a composite Linear+SE kernel (16) for a SOGP model for Danish Males, Ages 70–84 and Years 1990–2016

To explicitly capture these features, in the bottom-right panel (d) we construct the same heatmap but now with covariance kernel C(x, x’) of the form (17). While the in-sample patterns remain the same (as they should, being primarily data-driven), we can spot differences in terms of out-of-sample forecasts. The Cohort-GP model makes the historical cohort trends persist into the future; for example it makes the longevity of the post-1945 cohort to continue to be materially worse than the World War II generation (extreme top-right corner), while the no-Cohort model expects longevity deterioration in the 2020s across all cohorts.
Adding a Birth-year term to C(x, x’) changes all the GP hyperparameters, especially the length-scales, cf. Table C.3. Since (17) has a product of three terms rather than two as before, to maintain a similar correlation between a given x, x’, each length-scale is attenuated. Thus,
 $\theta_{yr}$
more than doubles from
 $\approx 5.5$
to
 $\approx 11.5$
, while
 $\theta_{ag}$
increases even more dramatically from
 $\approx 6.5$
to
 $\approx 58$
when a Birth-Cohort term is included. The estimated Birth–Cohort length-scale,
 $\theta_{bc} \approx 6.6$
, indicates that the typical “generation” spans about 7 birth–years, e.g. 1939–1945, 1965–1972. As expected, the change should have minimal impact on the GP mean function or the variance parameters
 $\eta^2, \sigma^2$
.
GP hyperparameters for fitting a covariance kernel with Birth–Cohort term (17) for a SOGP model for UK Males, Ages 50–84 and Years 1990–2016