Introduction
Human population growth continues to increase exponentially, particularly in Africa (Cohen Reference Cohen1995, Estrada Reference Estrada2016, Henn et al. Reference Henn, Cavalli-Sforza and Feldman2019), exacerbating the rates at which natural habitats are transformed into anthropogenic landscapes (Laurance et al. Reference Laurance, Sayer and Cassman2014). This has resulted in significant declines in biodiversity and abundance of species worldwide (Vitousek et al. Reference Vitousek, Mooney, Lubchenco and Melillo1997, Tilman et al. Reference Tilman, Fargione, Wolff, D'Antonio, Dobson, Howarth, Schindler, Schlesinger, Simberloff and Swackhamer2001, Sánchez-Bayo and Wyckhuys Reference Sánchez-Bayo and Wyckhuys2019, Piano et al. Reference Piano, Souffreau, Merckx, Baardsen, Backeljau, Bonte, Brans, Cours, Dahirel, Debortoli and Decaestecker2020). As a result, habitat patch sizes are generally decreasing and becoming isolated creating more edges/ecotones (where two adjacent ecosystems overlap) (Burkey Reference Burkey1995, Fahrig Reference Fahrig1997, Reference Fahrig2003, Haddad et al. Reference Haddad, Brudvig, Clobert, Davies, Gonzalez, Holt, Lovejoy, Sexton, Austin, Collins and Cook2015), resulting in reduced animal residency within fragments and isolated patches, and therefore, less recolonisation of fragments because of limited dispersal opportunities between them (Fahrig Reference Fahrig1997, Collinge Reference Collinge2009, Fahrig Reference Fahrig2003, Haddad et al. Reference Haddad, Brudvig, Clobert, Davies, Gonzalez, Holt, Lovejoy, Sexton, Austin, Collins and Cook2015, Hanski Reference Hanski2015).
Natural forest habitat supports a high proportion of biodiversity in South Africa (Geldenhuys and MacDevette Reference Geldenhuys, MacDevette and Huntley1989). Forests patches in South Africa are naturally fragmented, but anthropogenic activities, such as deforestation for agricultural land use and urbanisation, have further disconnected these landscapes, exacerbating fragmentation effects (Cromsigt et al. Reference Cromsigt, Kuijper, Adam and Beschta2013, Jain et al. Reference Jain, Ahmed and Sajjad2016). This causes significant declines in habitat heterogeneity (Bregman et al. Reference Bregman, Sekercioglu and Tobias2014), resulting in loss and change in forest species composition (Fahrig Reference Fahrig2003). Several studies have shown a positive relationship between species diversity and habitat heterogeneity (Gaston Reference Gaston2000, Tews et al. Reference Tews, Brose, Grimm, Tielbörger, Wichmann, Schwager and Jeltsch2004, Ehlers Smith et al. Reference Ehlers Smith, Si, Ehlers Smith, Kalle, Ramesh and Downs2018a). Edge effects become more pronounced as fragments become smaller and more degraded, as interior structures become eroded (Magnago et al. Reference Magnago, Magrach, Barlow, Schaefer, Laurance, Martins and Edwards2017, Ruete et al. Reference Ruete, Snäll, Jonsson and Jönsson2017, Malcolm et al. Reference Malcolm, Valenta and Lehman2017). This process results in the decline of suitable habitat for interior specialists, which influences species composition, resulting in more generalists occupying the forest fragments compared with specialist species, because generalists have broader niches, and ultimately results in the decline of some ecosystem services (Şekercioğlu et al. Reference Şekercioğlu, Daily and Ehrlich2004).
These pressures from loss of habitat and fragmentation lead to the extinction of some species. Many species now survive at such low densities that they can be considered nearly functionally extinct (Janzen Reference Janzen2001). Specialist species with narrow feeding niches may be less likely to make use of resources in the habitats that surround fragments than generalist species with broad feeding niches (Lees and Peres Reference Lees and Peres2008, Vetter et al. Reference Vetter, Hansbauer, Végvári and Storch2011, Newbold et al. Reference Newbold, Butchart, Şekercioğlu, Purves and Scharlemann2012, Olivier and Van Aarde Reference Olivier and Van Aarde2017). Species with different dispersal capabilities may respond differently to habitat fragmentation and habitat loss (Andren Reference Andren1994, Steffan-Dewenter and Tscharntke Reference Steffan-Dewenter and Tscharntke2000), with broader range dispersers displaying less sensitivity to fragmentation (Liao et al. Reference Liao, Bearup and Blasius2017, Ehlers Smith et al. Reference Ehlers Smith, Si, Ehlers Smith and Downs2018b). Birds are among the most mobile organisms, they have large/overlapping or small home ranges, but they are good indicators of habitat disturbance as a whole class because of their wide range of functional traits (Garson et al. Reference Garson, Aggarwal and Sarkar2002, Uezu et al. Reference Uezu, Metzger and Vielliard2005). Their ability to fly allows them to cope better with the disconnection of habitat and fragmentation than other taxonomic groups (Rolstad Reference Rolstad1991). Birds are generally easy to identify either visually or acoustically, and their habitat affinities are mostly well known (Rolstad Reference Rolstad1991, Garson et al. Reference Garson, Aggarwal and Sarkar2002). Therefore, bird populations in forest ecosystems provide excellent opportunities to study the consequences of habitat fragmentation. Birds have many different responses to habitat disturbance, given their different functional traits, but forest specialists are likely to be good indicators of forest disturbance because of their specialisation. However, some bird species such as ground-dwelling and forest specialists may not be spotted easily (Ehlers Smith et al. Reference Ehlers Smith, Ehlers Smith and Downs2017a,Reference Ehlers Smith, Ehlers Smith, Ramesh and Downsb,Reference Ehlers Smith, Ehlers Smith and Downsc, Maseko et al. Reference Maseko, Ramesh, Kalle and Downs2017).
In this study, we investigated two ground-dwelling forest bird specialists, the Lemon Dove Aplopelia larvata and the Orange Ground-thrush Geokichla gurneyi because these species are forest specialists requiring a suitable habitat and resources to persist in the ecosystem. Pigeons and doves (Columbidae) are exposed to extinction from hunting, introduced predators and habitat loss (Owens and Bennett Reference Owens and Bennett2000). The Orange Ground-thrush is range-restricted and a relatively scarce forest specialist (Colyn et al. Reference Colyn, Ehlers Smith, Ehlers Smith, Smit-Robinson and Downs2020). Therefore, their presence or absence in camera traps may highlight the suitability of the forest patches for these species and may be indicative of the wider forest habitat quality and condition. We analysed camera-trap photographs of species combined with microhabitat variables.
Lemon Dove and Orange Ground-thrush presence and absence in the photographs represent the habitat preference and requirements of these species. However, indigenous forest patches, which are composed of native trees and are not categorised as timber plantations often occur in rural areas in the Eastern Cape and southern KwaZulu-Natal (KZN) Provinces, where people rely on natural resources for their daily livelihoods such as firewood (Shackleton et al. Reference Shackleton, Timmermans, Nongwe, Hamer and Palmer2007, Leaver and Cherry Reference Leaver and Cherry2020) and hunting (Pasmans and Hebinck Reference Pasmans and Hebinck2017); therefore, these forests are disturbed in different ways. Previous research in Indian Ocean Coastal Belt Forests between the Umtamvuna and Umkomasi Rivers of KZN indicates that Lemon Doves were relatively uncommon in all forests studied (Ehlers Smith et al. Reference Ehlers Smith, Ehlers Smith and Downs2017a). In the same coastal forests, Spotted Ground-thrush Geokichla guttata had a strong preference for large patches, and the isolation distances of forest patches negatively influenced occupancy (Ehlers Smith et al. Reference Ehlers Smith, Ehlers Smith, Ramesh and Downs2017b). Forests with an open understorey and a less-diverse habitat structure influenced Spotted Ground-thrush occupancy positively; however, bare ground and the presence of grass cover influenced detection probability negatively (Ehlers Smith et al. Reference Ehlers Smith, Ehlers Smith, Ramesh and Downs2017b). The studies by Ehlers Smith et al. (Reference Ehlers Smith, Ehlers Smith and Downs2017a,Reference Ehlers Smith, Ehlers Smith, Ramesh and Downsb) only examined Indian Ocean Coastal and Scarp forests in southern KZN and did not include any of the KZN or Eastern Cape Province Southern Mistbelt Forests. Given the importance of forest specialists and the rate of habitat transformation, it is important to study habitat requirements of forest specialists in other South African forests to understand better the importance of protecting these species for local forest ecology and to inform local management practices across the broader landscape.
Indian Ocean Coastal Belt Forest is known to be highly fragmented, disturbed, and critically endangered (Department of Environmental Affairs 2013, Ehlers Smith et al. Reference Ehlers Smith, Ehlers Smith and Downs2017c). Currently, the KZN Indian Ocean Coastal Belt Forests are affected by a complex mosaic of extensive sugarcane fields, timber plantations and coastal holiday resorts, with scattered grasslands, Coastal Dense Bush (regenerating Coastal Forest; Mucina et al. 2006a,b, Ehlers Smith et al. Reference Ehlers Smith, Ehlers Smith and Downs2017a,Reference Ehlers Smith, Ehlers Smith, Ramesh and Downsb,Reference Ehlers Smith, Ehlers Smith and Downsc). By contrast, the Southern Mistbelt Forests surveyed in the present study are mostly situated in grassland landscapes with villages and are affected by commercial and subsistence use of the indigenous forest resources (Hassan and Haveman Reference Hassan and Haveman1997, Mucina et al. 2006a,b, Leaver et al. Reference Leaver, Mulvaney, Ehlers Smith, Ehlers Smith and Cherry2019). Additionally, timber plantations and alien invasive plant species often occur near or around these indigenous forest patches (Mucina et al. 2006a,b; authors’ pers. obs.).
In this study, we therefore aimed to elucidate (1) if the Lemon Dove habitat requirements in the Southern Mistbelt Forests were similar to those in the Indian Ocean Coastal Belt Forests and (2) if the Orange Ground-thrush responded to the Southern Mistbelt Forest pressures in a similar way to the Spotted Ground-thrush does in the Indian Ocean Coastal Belt Forest. We (3) measured habitat requirements to interpret their possible habitat preferences and calculated the degree to which vegetation metrics impacted on the probability of occupancy of Lemon Doves and Orange Ground-thrushes in the Southern Mistbelt Forest patches; and (4) compared seasonal differences in the presence and absence of the species and the use of habitat during breeding and non-breeding seasons. We predicted that the Lemon Dove in the Southern Mistbelt Forests would have similar habitat requirements as in the Indian Ocean Coastal Belt Forests and the Orange Ground-thrush would respond to the Southern Mistbelt Forest pressures the same way as the Spotted Ground-thrush in the Indian Ocean Coastal Belt Forests.
Methods
Study area
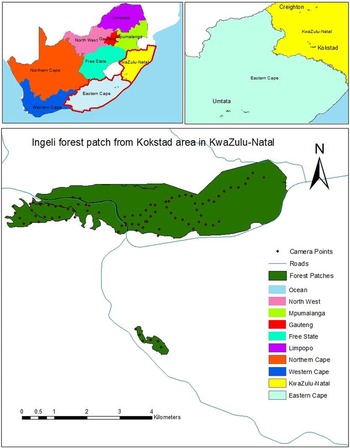
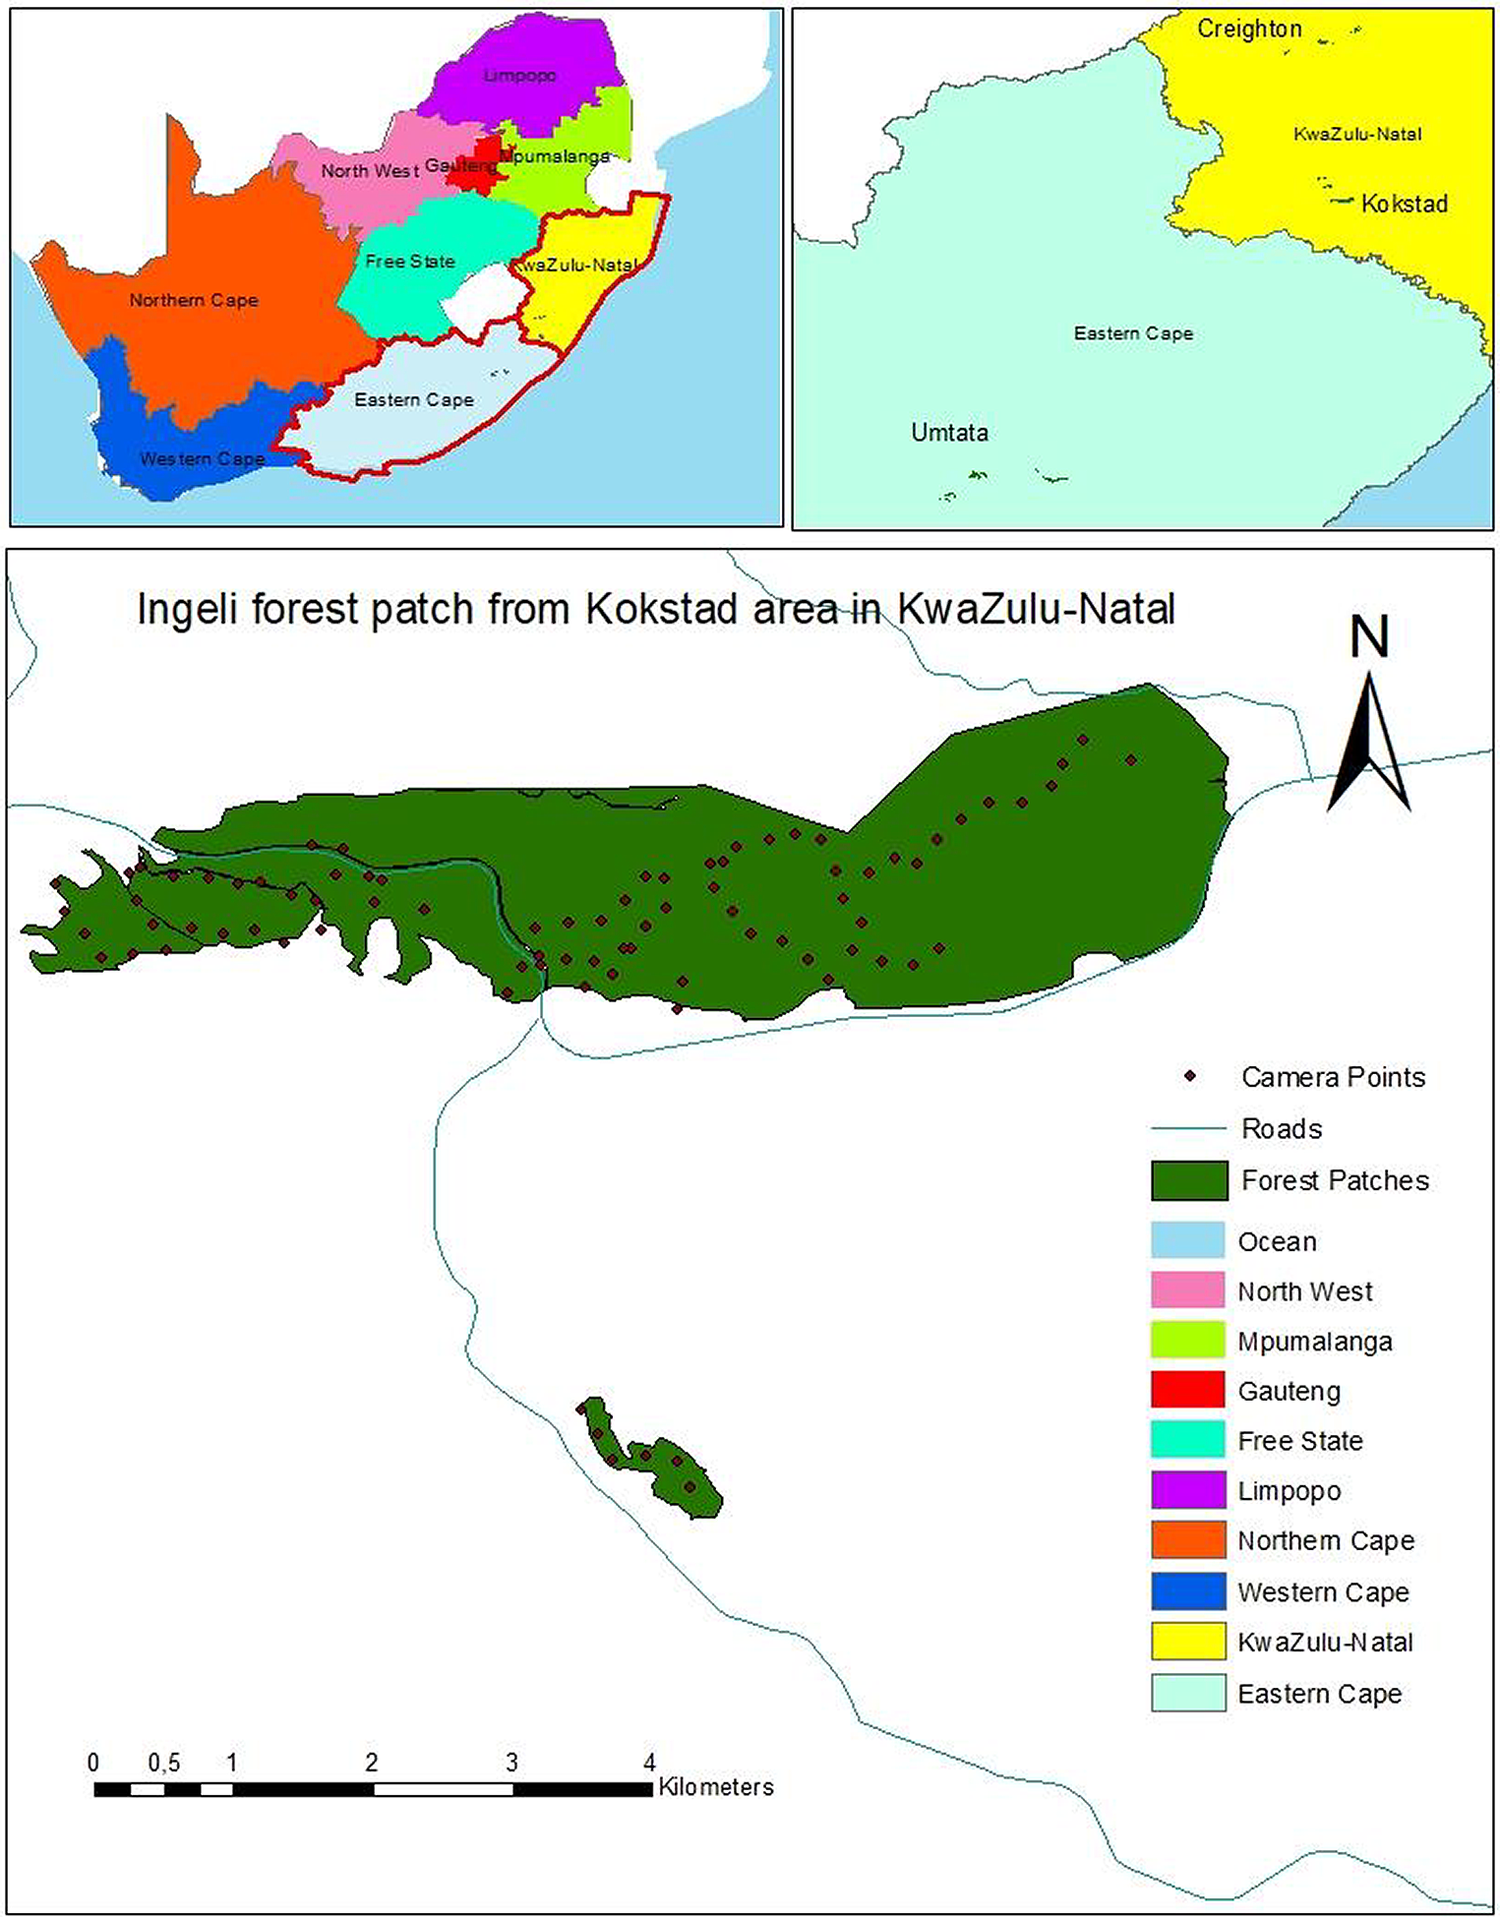
We conducted this study in select Southern Mistbelt Forests within the provinces of KZN (28.5°S, 30.9°E) (Kokstad and Creighton) and the Eastern Cape (32.3°S, 26.4°E) (Nqadu, Mhlahlane and eLangeni forests), South Africa (Figure 1). Eastern Mistbelt forests are naturally fragmented and patchily distributed as a result of biogeography and paleoclimate (Moll and White Reference Moll, White and Werger1978) and form part of the Southern Mistbelt Forest group which occurs from the Eastern Cape to KZN (Hope et al. Reference Hope, Fouad and Granovskaya2014). The Mistbelt forms an irregular band through the KZN Midlands, extending from Weza in the south-west to Ngome in the north-east (Mucina et al. 2006a,b, Wilson et al. Reference Wilson, Bowker, Shuttleworth and Downs2017). It once had a significant grassland component, but this has now been transformed into agriculture and commercial timber plantations (Mucina et al. 2006a,b). The forest component known as the Southern Mistbelt Forests consists of a series of patches occurring mainly on southern slopes where the effects of fire are reduced (Hope et al. Reference Hope, Fouad and Granovskaya2014). The climate is moderate and humid, and mists are frequent in summer and frosts in winter. The average annual rainfall is 950–1,350 mm, falling mostly in summer. The major exploitation of the Southern Mistbelt Forests started early in colonial history and in some patches, continues illegally (Adie et al. Reference Adie, Rushworth and Lawes2013). Beneficial tree species that humans used for medicinal purposes or to build shelters and as poles, such as Henkel's yellowwood Podocarpus henkelii, stinkwood Ocotea bullata, sneezewood Ptaeroxylon obliquum and thorn pear Scolopia zeyheri, were plundered. Ocotea bullata, an excellent provider of fruits to larger birds, is almost extinct (Adie et al. Reference Adie, Rushworth and Lawes2013).
Survey region of South Africa (insert) showing Southern Mistbelt Forest patches selected in the Eastern Cape and KwaZulu-Natal Provinces (insert), and an example of the forest patch in Kokstad showing the design of the study in the field.
Study species
The Lemon Dove is a medium-sized species in the family Columbidae mostly dwelling on forest floors in lowland and Afromontane forests (Hockey et al. Reference Hockey, Dean and Ryan2005, Ehlers Smith et al. Reference Ehlers Smith, Ehlers Smith, Ramesh and Downs2017d). This species is widely spread from the east of Cameroon, southern Sudan, Ethiopia, southern and eastern Africa to South Africa (Hockey et al. Reference Hockey, Dean and Ryan2005). The diet of the Lemon Dove consists primarily of various small fallen fruits and seeds, but it may rarely feed on insects (Hockey et al. Reference Hockey, Dean and Ryan2005, Symes and Woodborne Reference Symes and Woodborne2009). It is mostly found in pairs (monogamous) or flying solo and nesting solitarily (Hockey et al. Reference Hockey, Dean and Ryan2005). This species is difficult to detect through traditional survey methods (Ehlers Smith et al. Reference Ehlers Smith, Ehlers Smith and Downs2017a,Reference Ehlers Smith, Ehlers Smith and Downsc).
The Orange Ground-thrush is a sedentary forest bird specialist found in eastern and southern Africa (Earle and Oatley Reference Earle and Oatley1983). The distribution includes Kenya, western Angola, south-eastern Democratic Republic of the Congo, Tanzania, northern Malawi; and central Malawi to north-eastern South Africa respectively (Hockey et al. Reference Hockey, Dean and Ryan2005). Orange Ground-thrush habitat is mostly in montane and Mistbelt forests. It forages for earthworms, insects, and molluscs, and rarely fruits (Earle and Oatley Reference Earle and Oatley1983, Hockey et al. Reference Hockey, Dean and Ryan2005). Females are larger than males in size and are monogamous (Hockey et al. Reference Hockey, Dean and Ryan2005). The population size of Orange Ground-thrush is currently not well known but is thought to be declining because of habitat loss (BirdLife International 2019). The IUCN Red List has listed the species as ‘Least Concern’ because it has a broad range and its population is not declining fast enough to be considered ‘Vulnerable’ (BirdLife International 2019).
Data collection
We collected data during non-breeding (May–August) and breeding (October–February) seasons of 2018 and 2019 for both species. We obtained the Geographic Information System (GIS) data layer maps of the Southern Mistbelt Forests in KZN and the Eastern Cape (GeoTerra Image 2014) which we then displayed in ArcGIS v10.4 (ESRI 2011) to identify suitable camera-trap site locations across the area’s gradient. In our three study regions, we selected a range of Southern Mistbelt Forest patches with surrounding land uses, including timber plantations, grasslands and rural or urban developments. In each region, we selected a range of patch sizes, with the structure of source or "mainland" patch, and several surrounding satellite patches. We overlaid a 400 m x 400 m grid over each survey patch to allocate camera sites at the intersection of each gridline, following the guidelines for camera-trap survey design in KZN by Ehlers Smith et al. (Reference Ehlers Smith, Ehlers Smith, Rushworth and Mulqueeny2018c), and to ensure points were evenly distributed across sample areas. Some areas were not accessible upon arrival at a survey location, but we maintained a 400 m distance between survey sites. Additionally, species of similar size to our study species have a relatively large (0.4–31.9 ha) home ranges (Tweed et al. Reference Tweed, Foster, Woodworth, Oesterle, Kuehler, Lieberman, Powers, Whitaker, Monahan, Kellerman and Telfer2003, Anich et al. Reference Anich, Benson and Bednarz2012). Therefore, the number of camera trap sites in each habitat patch was proportional to the size of each habitat patch (Bibby et al. Reference Bibby, Burgess and Hill2000, Ehlers Smith et al. Reference Ehlers Smith, Ehlers Smith and Downs2017a,Reference Ehlers Smith, Ehlers Smith, Ramesh and Downsb,Reference Ehlers Smith, Ehlers Smith and Downsc,Reference Ehlers Smith, Ehlers Smith, Ramesh and Downsd). We projected survey locations onto a Global Positioning System (GPS, Garmin GPS map 62; Garmin USA) to locate survey site selection in the field and ensure a minimum distance of 400 m between survey points. We used 60 camera traps, and they were rotated to cover the whole study site. We fastened each camera trap (Moultrie M-880 and Cuddeback 20MP) at 420 sites across 94 forest patches to a sturdy tree at each site at a height of 15–30 cm. We selected trees along animal trails that were naturally open, to allow the camera trap sensor’s optimum range. We removed vegetation obstructing the sensor and left camera traps operating at each site for 21 days 24h/day, set to capture a picture whenever there was motion, with a 30-second delay between pictures.
The microhabitat structure and foliage profile were surveyed in a 20-m radius around each survey location: percentage coverage of bare ground; leaf litter; grass cover; herbaceous plants; saplings and scrub/woody plants < 2 m, and percentage of trees of 2–5 m, 6–10 m, 11–15 m, 16–20 m, 21–25 m and > 25 m in height; mean height of all plant groups, stem density of all horizontal and vertical dead trees, and stem density of all trees in each height category (Bibby et al. Reference Bibby, Burgess and Hill2000, Ehlers Smith et al. Reference Ehlers Smith, Ehlers Smith, Seymour, Thébault and Veen2015, Reference Ehlers Smith, Ehlers Smith and Downs2017a,Reference Ehlers Smith, Ehlers Smith, Ramesh and Downsb,Reference Ehlers Smith, Ehlers Smith and Downsc,Reference Ehlers Smith, Ehlers Smith, Ramesh and Downsd). Scrub/woody vegetation was distinguished from trees and classified as ellipsoid-shaped plants with multiple branches emerging from the ground, which represent an understorey structural component (Ehlers Smith et al. Reference Ehlers Smith, Ehlers Smith, Seymour, Thébault and Veen2015). Trees were classified as bare-stemmed plants of height > 2 m, with upper branches containing foliage (Ehlers Smith et al. Reference Ehlers Smith, Ehlers Smith, Seymour, Thébault and Veen2015). We were not able to retrieve climatic covariates in this study because of the limitations of the camera traps used.
Data analyses
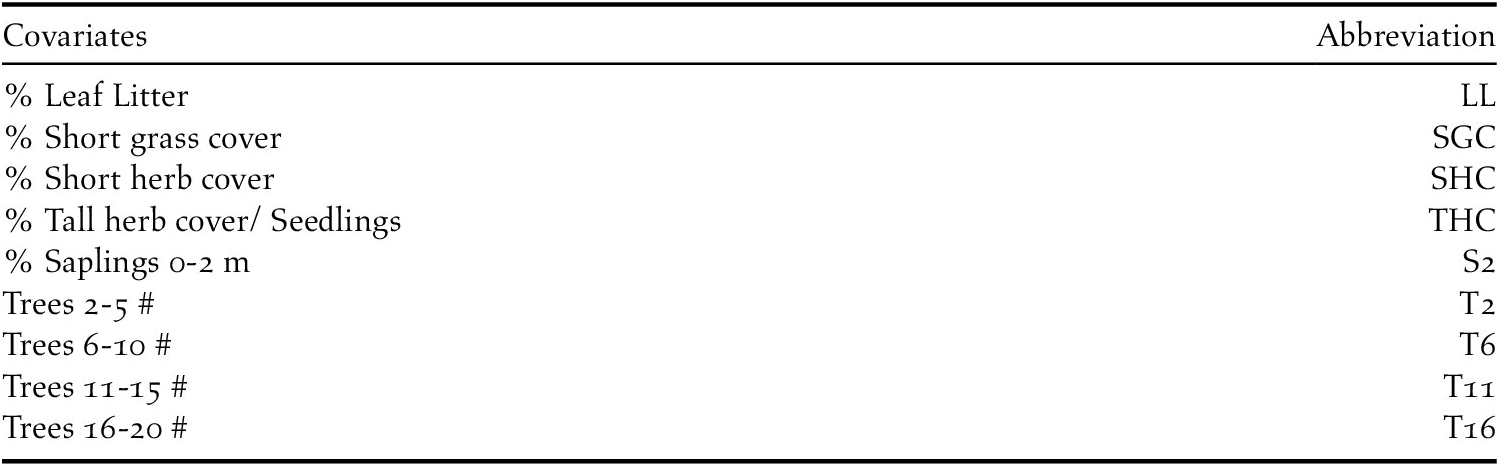
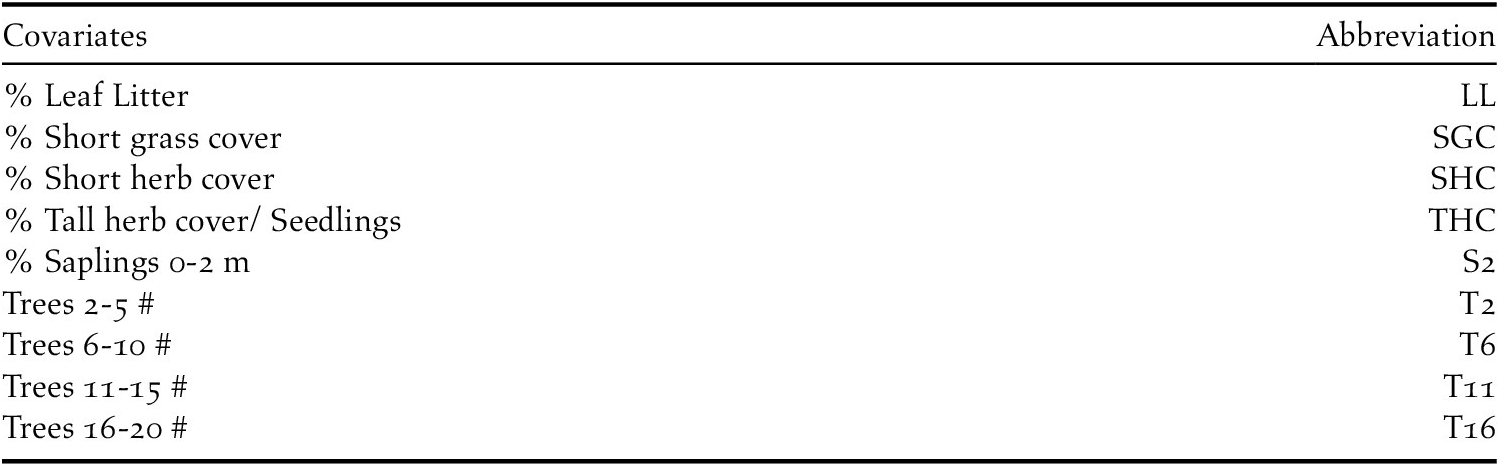
We standardised all continuous covariates to z-scores and correlations between them were tested to avoid multicollinearity (Graham Reference Graham2003, Ramesh and Downs Reference Ramesh and Downs2014, Ehlers Smith et al. Reference Ehlers Smith, Ehlers Smith, Ramesh and Downs2017d). We removed all correlated covariates and retained nine microhabitat-scale covariates (Table 1). Binary detection history (1 = presence, 0 = absence) was used in a single-season occupancy model (MacKenzie et al. Reference MacKenzie, Nichols, Royle, Pollock, Bailey and Hines2017, Ehlers Smith et al. Reference Ehlers Smith, Ehlers Smith and Downs2017a,Reference Ehlers Smith, Ehlers Smith, Ramesh and Downsb,Reference Ehlers Smith, Ehlers Smith and Downsc,Reference Ehlers Smith, Ehlers Smith, Ramesh and Downsd) to estimate the probability of occupancy (ψ) and detection (p) of habitat patches used by Lemon Doves and Orange Ground-thrushes. The detection histories of the dry and wet seasons were analysed separately. The programme PRESENCE v9.0 (Hines Reference Hines2006) was used to estimate ψ and p and calculate the influence of microhabitat-scale covariates on both measures to determine if these covariates are influencing both occupancy and detection probability. Therefore, firstly we created the constant model, i.e. occupancy and detection probability without covariate influences (ψ (.)p(.)). Secondly, we created a full model encompassing all microhabitat-scale covariates. The influence of each covariate independently and in combination were modelled on ψ while keeping p constant, and vice versa, e.g. ψ(covariate)p(.) or ψ(.)p(covariate+covariate). Lastly, we tested the influence of all covariates on ψ and p at once, ψ (covariate+covariate) p(covariate+covariate). We estimated c-hat values (c-hat 1.12 and 1.17 for Lemon Dove during breeding and non-breeding respectively; 1.1 for Orange Ground-thrush) for the most parameterised single-season models. We did not observe over-dispersion and the best model described covariates influence on ψ, and p was defined by the lowest Akaike’s information criterion (AIC) value (Ramesh and Downs Reference Ramesh and Downs2014, Ehlers Smith et al. Reference Ehlers Smith, Ehlers Smith and Downs2017a,Reference Ehlers Smith, Ehlers Smith, Ramesh and Downsb,Reference Ehlers Smith, Ehlers Smith and Downsc,Reference Ehlers Smith, Ehlers Smith, Ramesh and Downsd).
Microhabitat-scale covariates retained in the occupancy modelling of the probability of occupancy and detection of Lemon Doves Aplopelia larvata and Orange Ground-thrushes Geokichla gurneyi in selected Mistbelt Forests of KwaZulu-Natal and Eastern Cape, South Africa, after removal of highly correlated covariates during multicollinearity tests.
Results
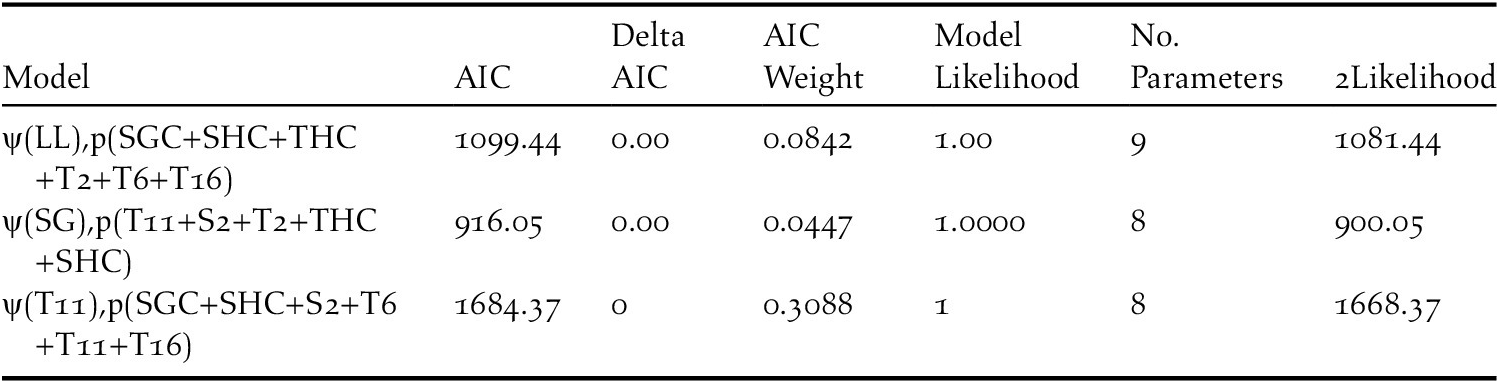
Twenty-one days of sampling in 420 sites resulted in 8,820 camera trap nights during dry and wet seasons. This resulted in 502 captures in the wet season and 363 captures in the dry season of Lemon Dove and 122 captures in the wet season and 26 captures in the dry season of Orange Ground-thrush. The naive occupancy of the Lemon Dove was 0.25 during the wet season and 0.23 in the dry season. However, the Orange Ground-thrush naïve occupancy was 0.23 for the wet season and 0.07 for the dry season. This could be the result of scarcity of the Orange Ground-thrush during the non-breeding season, as the species has limited movement during the non-breeding season (Hockey et al. Reference Hockey, Dean and Ryan2005). Thus, we only modelled occupancy for the wet season where the naïve occupancy ≥ 0.2. We produced 507 (wet season) and 519 (dry season) Lemon Dove and 155 (wet season) Orange Ground-thrush models integrating nine microhabitat covariates to estimate the occupancy of the two species; and retained three models within ∆AIC ≤ 2 thresholds (Tables 1, 2 and 3).
Summary of top models used to estimate occupancy and detection of Lemon Doves Aplopelia larvata and Orange Ground-thrushes Geokichla gurneyi during wet and dry seasons using nine microhabitat-scale covariates. The first two top models are for Lemon Dove during wet and dry seasons respectively, and the third model is for Orange Ground-thrush during the wet seasons.
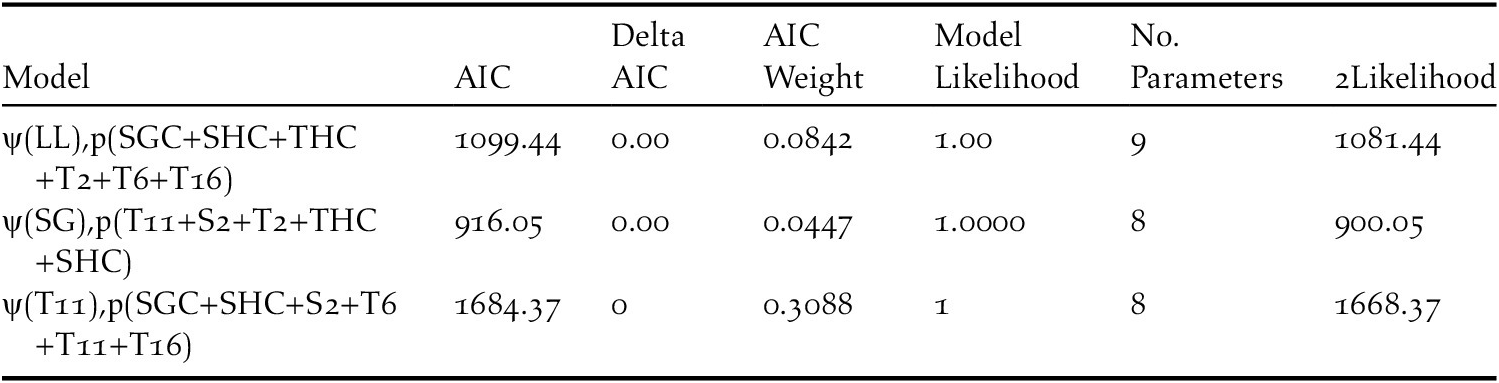
Index: LL = leaf litter, SGC = short grass cover, SHC = Short herb cover, THC = Tall herb cover, T2 = Tree height 2–5 m, T6 = Tree height 6–10 m, T16 = Tree height 16–20 m.
Across all top models, the mean occupancy, the standard deviation (+ SD), and the probability of detection of Lemon Dove were 0.29 ± 0.05 and 0.15 ± 0.04 for the wet seasons, and 0.29 ± 0.06 and 0.19 ± 0.03 for the dry seasons. For the Orange Ground-thrush, the mean occupancy and the probability of detection were 0.51 ± 0.03 and 0.17 ± 0.02 in the wet seasons.
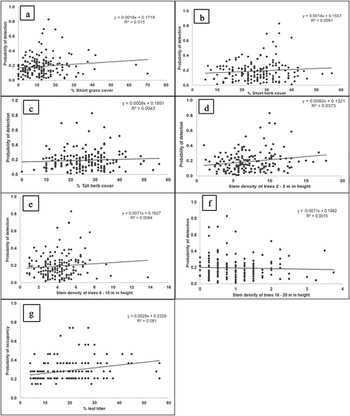
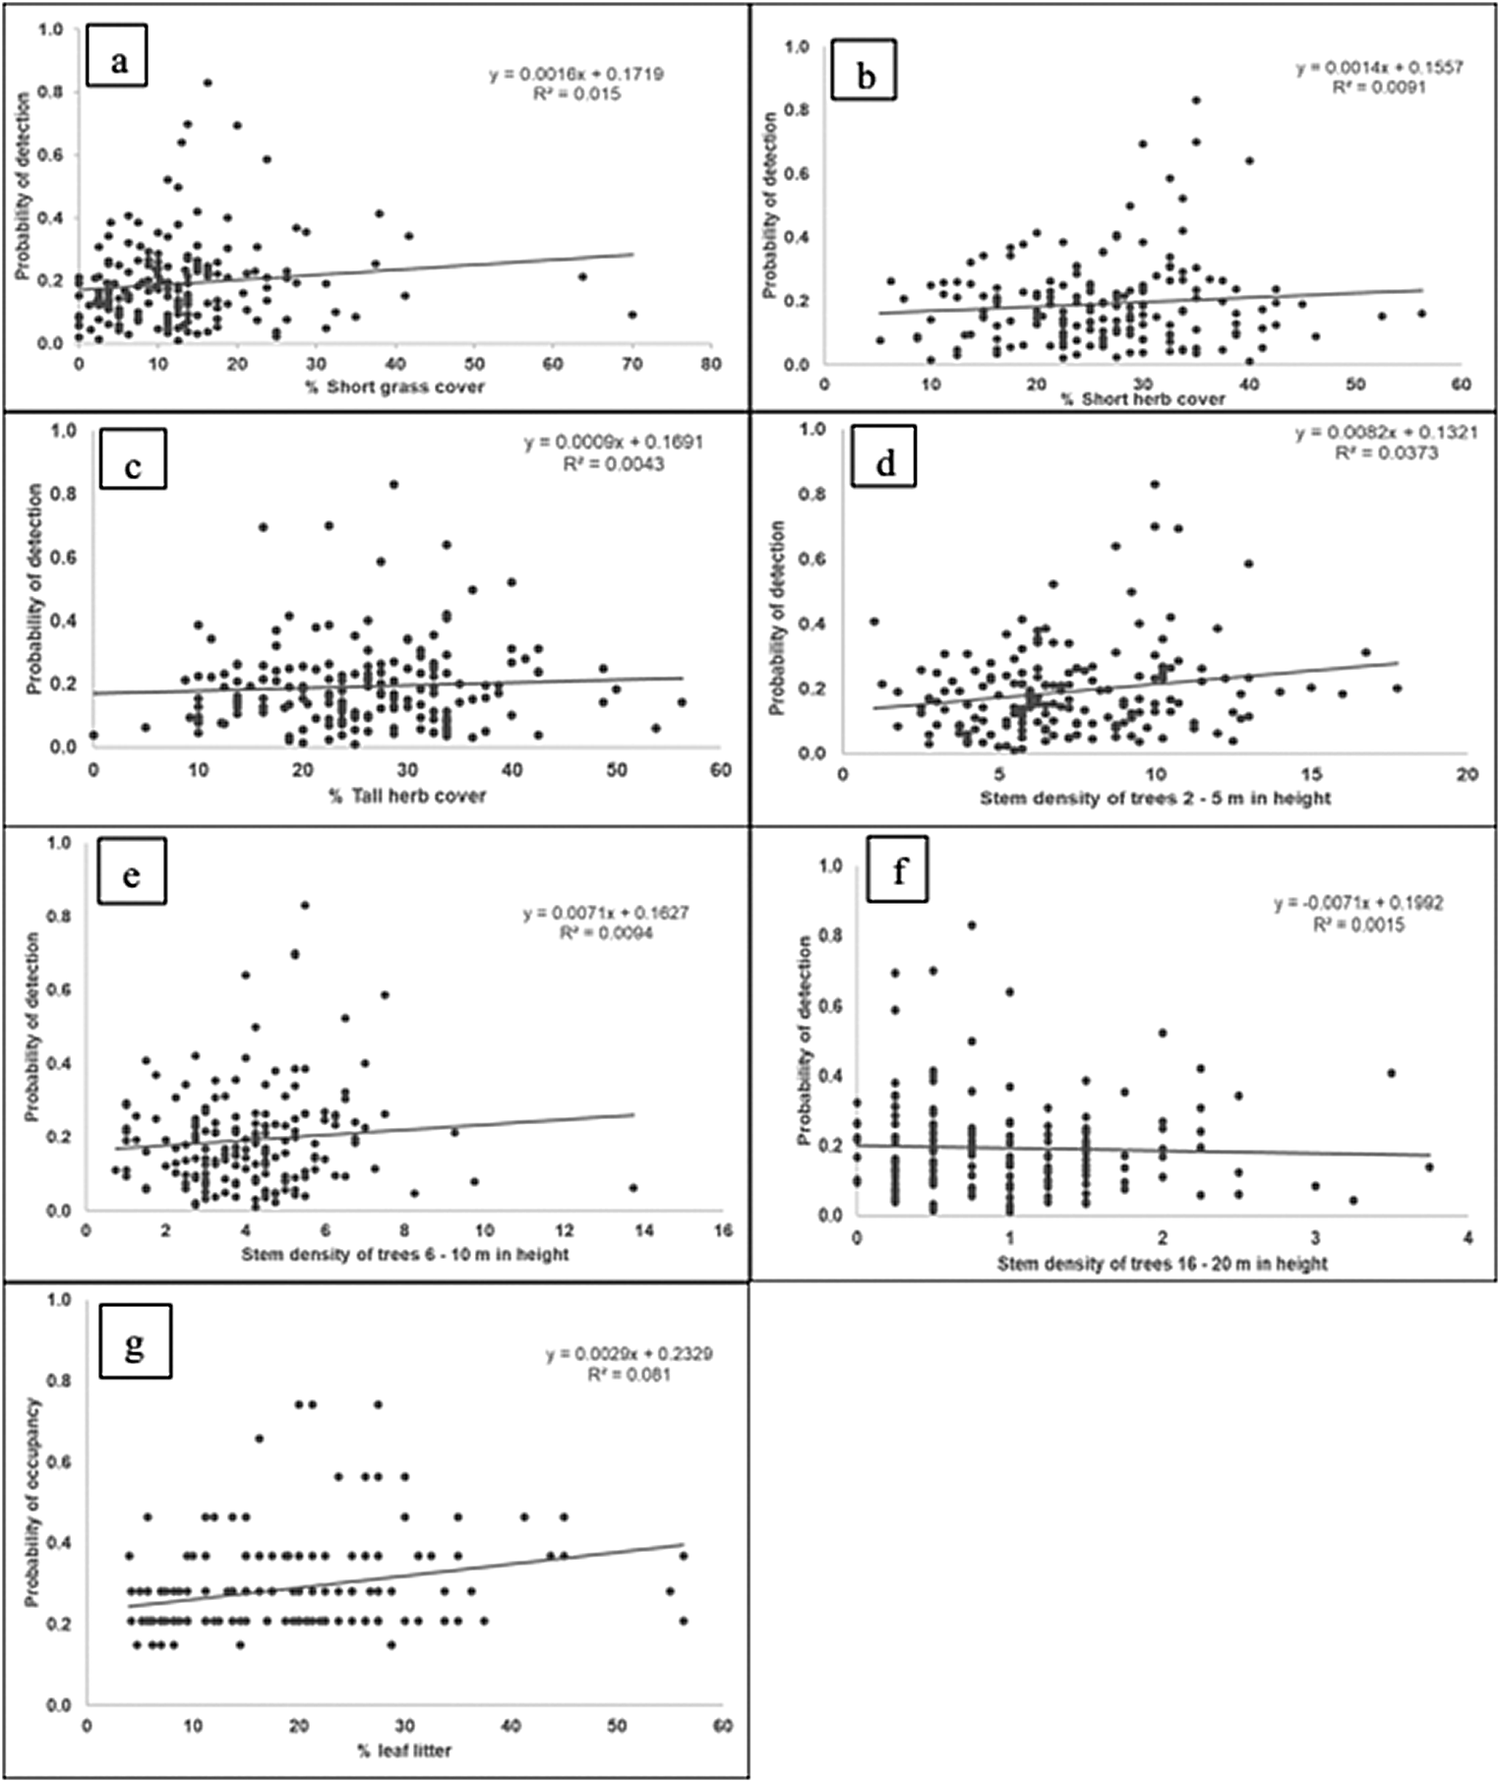
In the wet seasons, short grass cover (%), (β 0.32 ± 0.14 ωi = 0.92) short herb cover (%) (β 0.63 ± 0.14, ωi = 0.99), tall herb cover (%) (β 0.65 ± 0.12, ωi = 0.99), stem density of trees 2–5 m (β 0.63 ± 0.14, ωi = 0.99) and 6–10 m (β 0.15 ± 0.14, ωi = 0.09) in height had a positive influence on a probability of detection of Lemon Doves while stem density of trees 16–20 m (β 0.65 ± 0.19, ωi = 0.98) in height had a negative influence on the probability of Lemon Dove detection (Figure 2). Leaf litter (%) (β 1.90 ± 0.70, ωi = 0.92) had a positive influence on a probability of occupancy of Lemon Doves (Figure 2).
Lemon Dove occupancy and detection estimates in relation to site covariates during the wet seasons in the present study where (a) is the percentage of short grass cover and probability of detection, (b) is the percentage of short herb cover and probability of detection, (c) is the percentage of tall herb cover with the probability of detection, (d) is the stem density of trees 2–5 m with the probability of detection, (e) is the stem density of trees 6–10 m with probability of detection, (f) is the stem density of trees 16–20 m with probability of detection and (g) is the percentage of leaf litter and probability of occupancy.
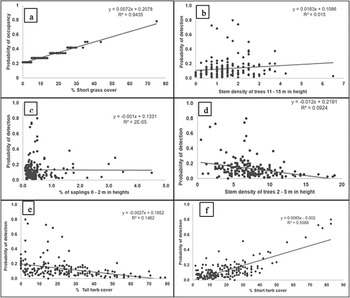
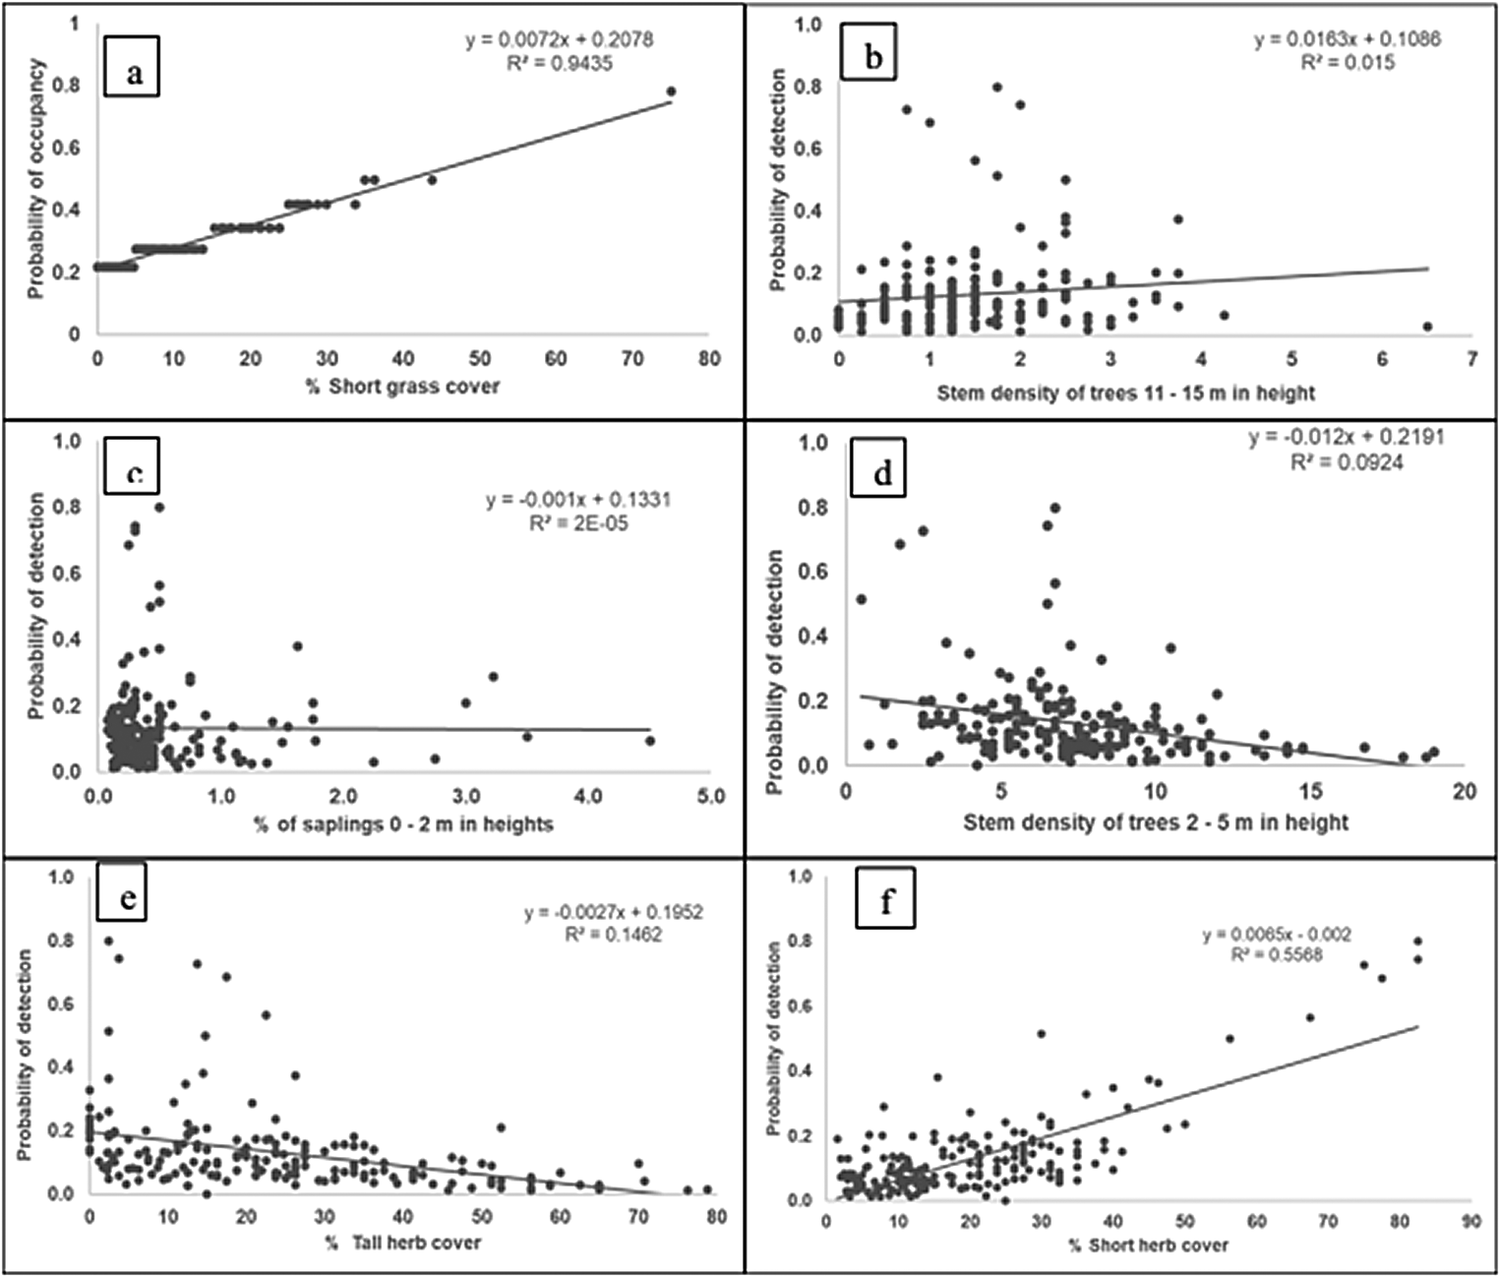
In the dry seasons, short grass cover (%) (β 0.38 ± 0.19, ωi= 0.65) had a positive influence on a probability of occupancy of Lemon Doves (Figure 3). Short herb cover (%) (β 0.57 ± 0.15, ωi = 1) and the stem density of trees 11–15 m (β 0.22 ± 0.13, ωi = 0.65) in height had a positive influence on a probability of detection of Lemon Doves, whereas saplings 0–2 m (%) (β 0.24 ± 0.14, ωi = 0.76), stem density of trees 2–5 m in height (β -0.39 ± 0.12, ωi = 1) and tall herb cover (%) (β -0.54 ± 0.11, ωi = 1) had a negative influence (Figure 3).
Lemon Dove occupancy and detection estimates in relation to site covariates during the dry seasons in the present study where (a) is the percentage of short grass cover and probability of occupancy, (b) is the stem density of trees 11–15 m in height with probability of detection, (c) is the percentage of saplings 0–2 m with the probability of detection, (d) is the stem density of trees 2–5 m with the probability of detection, (e) is the percentage of tall herb cover with probability of detection, and (f) is the percentage of short herb cover with probability of detection.
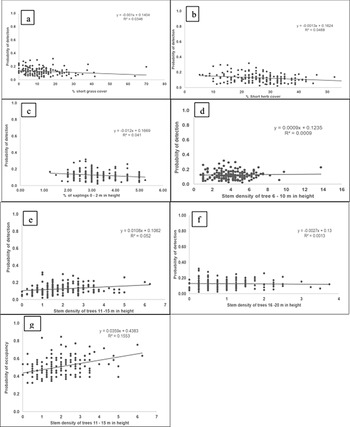
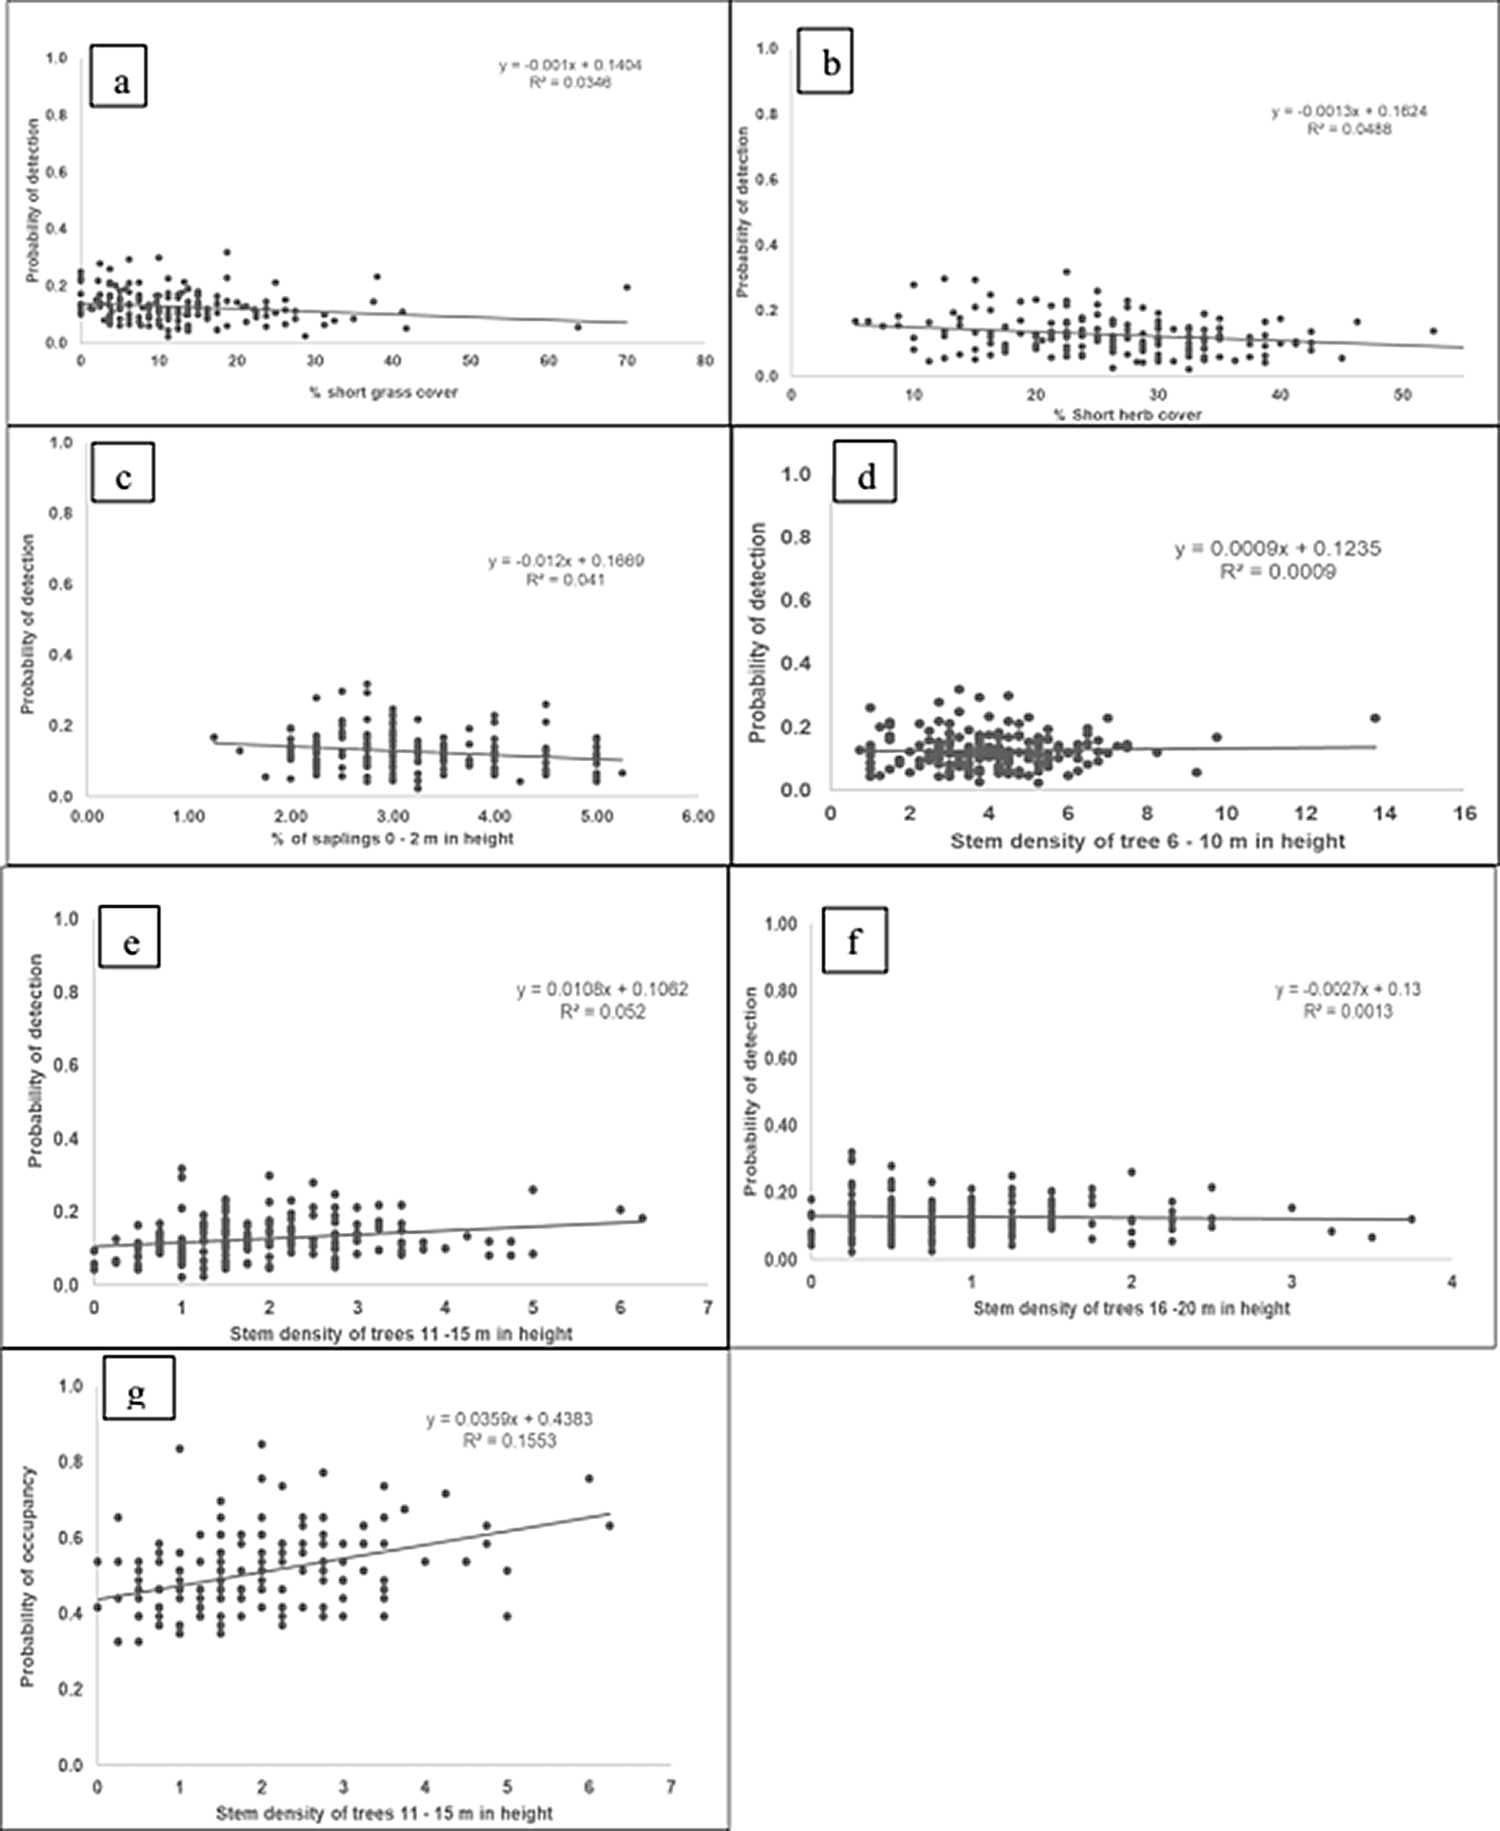
In comparison in the wet seasons, short herb cover (%) (β -0.11 ± 0.06, ωi = 0.91), saplings 0–2 m (%) (β -0.17 ± 0.07, ωi = 0.89) and stem density of trees 16–20 m in height (β -0.21 ± 0.09, ωi = 0.95) had a negative influence on the probability of detection of the Orange Ground-thrush (Figure 4). Stem density of trees 6–10 m (β 0.17 ± 0.07, ωi = 0.96) and 11–15 m in height (β 0.26 ± 0.06, ωi = 1) had a positive influence on a probability of detection of Orange Ground-thrush. Occupancy was positively influenced by stem density of trees 11–15 m in height (β 0.46 ± 0.18, ωi = 1) for Orange Ground Thrush (Figure 4).
Orange Ground-thrush occupancy and detection estimates in relation to site covariates during the wet seasons in the present study where (a) is the percentage of short grass cover and probability of detection, (b) is the percentage of short herb cover with probability of detection, (c) is the percentage of saplings 0–2 m with the probability of detection, (d) is the stem density of trees 6–10 m with the probability of detection, (e) is the stem density of trees 11–15 m with the probability of detection, (f) is the stem density of trees 16–20 m with the probability of detection, and (g) is the stem density of trees 11–15 m with the probability of occupancy.
Discussion
Occupancy and detection are determined by many factors such as resource availability, disturbance, the chance of survival and habitat use (O'Connell et al. Reference O'Connell, Talancy, Bailey, Sauer, Cook and Gilbert2006), which vary between seasons. The size of the species can also influence chances of detection; the larger the species, the higher the chances of detection (Randler and Kalb Reference Randler and Kalb2018). The Orange Ground-thrush was relatively rare during the dry season, and the photograph capture dataset was insufficient to model occupancy. However, Lemon Dove capture data were sufficient to satisfy modelling requirements for both the dry and wet seasons. Lemon Dove occupancy remained constant between the wet and dry seasons, but their detection probability was higher in the dry season than the wet season. The following covariates were significant for occupancy and detection of Lemon Doves during the wet season: percentage of leaf litter, short grass cover, short herb cover, tall herb cover, saplings 0–2 m, stem density of trees 6–10 m and trees 16–20 m. These covariates were similar to those found affecting Lemon Dove presence in the Indian Ocean Coastal Belt Forests study (Ehlers Smith et al. Reference Ehlers Smith, Ehlers Smith and Downs2017a), excluding bare ground percentage as it was not an essential covariate in explaining Lemon Dove occupancy and detection in the present study. In the present study, the percentage of leaf litter had a positive influence on the occupancy of Lemon Doves in the wet season. Similarly, Ehlers Smith et al. (Reference Ehlers Smith, Ehlers Smith and Downs2017a) showed the positive influence of the percentage of leaf litter on the occupancy of Lemon Doves. Generally, there are more food resources in leaf litter because of invertebrates that inhabit it (Hockey et al. Reference Hockey, Dean and Ryan2005, Ehlers Smith et al. Reference Ehlers Smith, Ehlers Smith and Downs2017a,Reference Ehlers Smith, Ehlers Smith and Downsc,Reference Ehlers Smith, Ehlers Smith, Ramesh and Downsd). In the present study, leaf litter was the main covariate positively influencing Lemon Dove occupancy probability, while in the Indian Ocean Coastal Belt Forests, leaf litter, as well as the percentage of bare ground and grass cover, also influenced occupancy of Lemon Doves (Ehlers Smith et al. Reference Ehlers Smith, Ehlers Smith and Downs2017a). In the Indian Ocean Coastal Belt Forests, percentage of herbaceous cover and grass cover influenced detection probability positively during spring-summer months (Ehlers Smith et al. Reference Ehlers Smith, Ehlers Smith and Downs2017a). Lemon Dove is a ground-dwelling bird which forages on forest floors; thus, short vegetation structure is crucial for their detection probability (Hockey et al. Reference Hockey, Dean and Ryan2005), since they are not easily spotted.
During the dry season, the following covariates were significant for the occupancy and detection of Lemon Doves: stem density of trees 2–5 m and 11–15 m, percentage of saplings 0–2 m, tall herb cover and short herb cover. Percentage of short grass cover was a positive influence on the occupancy of Lemon Doves; it is likely that birds are finding more food where there is short grass cover. Stem density 11–15 m and a percentage of short herb cover had a positive influence on detection probability of Lemon Doves; presumably these trees are at their fruiting stage and may have fallen fruits underneath them and may also provide enough canopy cover for the species. In the Indian Ocean Coastal Belt Forests, detection probability of Lemon Doves was positively influenced by plant species richness, percentage of saplings and short woody plants during autumn-winter months (Ehlers Smith et al. Reference Ehlers Smith, Ehlers Smith and Downs2017a). In contrast, the percentage of tall herb cover, saplings 0–2 m and stem density of trees 2–5 m negatively influenced the detection probability of Lemon Dove in the dry season in the present study. These sites may be lacking ideal and sufficient resources such as food for the species during the dry season in the Southern Mistbelt Forests compared with the Indian Ocean Coastal Belt Forests. Although Lemon Doves were more common in the Southern Mistbelt Forests compared with the Indian Ocean Coastal Belt Forests (Ehlers Smith et al. Reference Ehlers Smith, Ehlers Smith and Downs2017a), we found their habitat requirements in both forest types had similarities. It is possible there is more anthropogenic disturbance in the Coastal Forests, which may negatively influence occupancy.
Percentage of short grass cover, percentage of short herb cover, percentage of saplings 0–2 m, stem density of trees 6–10 m, stem density of trees 11–15 m, stem density of trees 16–20 m were significant covariates for the occupancy and detection of Orange Ground-thrushes. Stem density of trees 11–15 m was a positive influence on the occupancy and probability of detection of Orange Ground-thrushes. The species primarily feeds on invertebrates and occasionally on fruits (Earle and Oatley Reference Earle and Oatley1983, Hockey et al. Reference Hockey, Dean and Ryan2005), so tall trees may be beneficial for the occupancy of this species through provision of food and nesting sites. Percentage of short grass cover, short herb cover and saplings 0–2 m had a negative influence on the detection probability of the Orange Ground-thrush, indicating a preference for vegetation structure with an open understorey. Our results confirmed the habitat requirements of this species to be similar to those of Spotted Ground-thrush in the Indian Ocean Coastal Belt Forest (Ehlers Smith et al. Reference Ehlers Smith, Ehlers Smith, Ramesh and Downs2017b). These two species in both forest types seem to prefer forest patches with tall trees. However, the short herbaceous cover had a negative influence on detection probability of the Orange Ground-thrush, while it was a positive influence on detection probability of the Spotted Ground-thrush in the Indian Ocean Coastal Belt Forest (Ehlers Smith et al. Reference Ehlers Smith, Ehlers Smith, Ramesh and Downs2017b). Our results showed the negative influence of short grass cover on the detection probability of the Orange Ground-thrush, which was similar to the findings of Ehlers Smith et al. (Reference Ehlers Smith, Ehlers Smith, Ramesh and Downs2017b). In this study, microhabitat-scale covariates revealed that both species have similar habitat requirements, regardless of the forest types within which they occur. Our study further indicated that these forest specialists prefer mature forests (Ehlers Smith et al. Reference Ehlers Smith, Ehlers Smith, Ramesh and Downs2017b). Generally, forest specialists are sensitive to disturbance and negatively affected by habitat modification (Pardini et al. Reference Pardini, Faria, Accacio, Laps, Mariano-Neto, Paciencia, Dixo and Baumgarten2009, Ehlers Smith et al. Reference Ehlers Smith, Ehlers Smith and Downs2017a,Reference Ehlers Smith, Ehlers Smith, Ramesh and Downsb,Reference Ehlers Smith, Ehlers Smith and Downsc).
The present study highlighted the importance of diverse habitat structures for the Orange Ground-thrush and the Lemon Dove. Heterogeneous habitats provide more resources and species diversity (Tscharntke et al. Reference Tscharntke, Klein, Kruess, Steffan-Dewenter and Thies2005). Since Lemon Doves are generally not easily detected, they prefer interior forest areas implying that they are likely to be negatively affected by edge effects and anthropogenic activities such as logging (Ehlers Smith et al. Reference Ehlers Smith, Ehlers Smith and Downs2017a). Lemon Doves showed a preference for patches with dense understorey and a diverse habitat structure (Malan Reference Malan2011, Ehlers Smith et al. Reference Ehlers Smith, Ehlers Smith and Downs2017a) which highlights the importance of conserving natural forests in their natural condition. Orange Ground-thrush showed a preference for forests with an open understorey. Understorey insectivores are mainly known to be sensitive to habitat disturbance and fragmentation (Powell et al. Reference Powell, Cordeiro and Stratford2015), and negatively affected by edge effects (Beier et al. Reference Beier, Van Drielen and Kankam2002).
Efforts to conserve natural forests are necessary to ensure the survival of these forest specialist species as they are beneficial to local communities. Many cultures perceive doves as a sign of peace and they are believed to invite good luck, happiness, and protection against evil spirits (Nengovhela Reference Nengovhela2010), thus providing cultural ecosystem services to local communities. The present study showed the importance of a diverse habitat structure for both of these forest species. Unfortunately, 41% of the KZN Mistbelt region had been converted into timber plantations by the turn of the millennium, which is the most predominant anthropogenic land-use in this region (Armstrong et al. Reference Armstrong, Benn, Bowland, Goodman, Johnson, Maddock and Scott-Shaw1998). As a consequence, homogeneous vegetation structure threatens forest species requiring diverse habitat structure. Moreover, the isolation of certain Mistbelt forest patches results in isolated populations, and thus, reduced population sizes, which threaten range-restricted species (Armstrong et al. Reference Armstrong, Benn, Bowland, Goodman, Johnson, Maddock and Scott-Shaw1998) such as the Orange Ground-thrush. A high density of tall trees in this study was an essential microhabitat covariate, particularly for sufficient cover and food source for these ground-dwelling birds. Therefore, directing attention towards conserving mature natural forests and restoring those degraded is a critical conservation management strategy to maintain species diversity and habitat heterogeneity.
Acknowledgements
We are grateful to the University of KwaZulu-Natal, and the National Research Foundation (ZA) for funding. We thank Mr Joyi and Mr Sqithi for permission to work in the forests. We thank the Hans Hoheisen Trust (ZA) for funding camera traps. We thank the Ford Wildlife Foundation (ZA) for vehicle support.