

From crisis to austerity
On September 15th 2008, the investment bank Lehman Brothers filed for bankruptcy. This was the largest in US history and, more than any other event, signalled the enormity of the economic crisis about to be unleashed on economies across the globe. Ten years later, on October 29th 2018, the British Chancellor, facing huge pressure from his own party to signal movement on austerity to bolster its political fortunes, was able to promise in his Autumn Budget no more than that ‘the end of austerity was in sight’.Footnote 1 It was another crisis – the global Covid-19 health pandemic – that looked like it might restore expenditure to pre-2010 levels in some departments, although, at the time of writing, austerity following recovery from the pandemic looks as likely as a more generous, long-term settlement for the public sector. These historical events bookend a period that began with economic crisis, was marked by political crisis and ended with a health crisis. And together these events have transformed British politics and British social policy.
Starting with the earlier of the crises, the UK was hit relatively hard by the 2008 banking crisis and the effects of what later came to be known as the Great Recession. Politically, the UK experienced demonstrations, riots, a collapse in political legitimacy, hung parliaments, three elections in six years (between 2015 and 2019) and, most importantly, a popular vote for the UK to depart the EU. In terms of social policy, the decade since 2008 was also a deeply hostile one.
This article is an attempt to take stock and critically reflect on the decade of austerity and social policy hostility over the past decade. It distinguishes between economic and political austerity and digs deeper into the data on expenditure in order to examine the impact of austerity on British public expenditure and politics. It argues that the decade of austerity was a hostile one for British social policy, which not only undermined the financial base of key parts of the welfare state, but reshaped it and redefined its priorities, setting in train a series of subsequent events that would further change, not just British social policies, but British economics, polity and politics. And, as subsequent crises – notably Brexit and the Covid-19 pandemic – testify, crisis events tend to be linked, and each one shapes and influences the ability of the state to respond to the next.
Preparing the way for crisis
The origin of the word ‘crisis’ is drawn from medicine and describes the state in which disease or ill health threatens the ability of a body to continue to live. Economic and political crises can be understood in a similar way; as events that threaten to fatally destabilise a political, economic or social system systemically, so that its very continuance – in its present form, at least – is put under doubt. Each has its own history and context. Although it began with the sub-prime mortgage crisis in the US, for instance, the 2008 global economic crisis had deeper roots that extended to the liberalisation of capital exchange controls in the early 1980s and resulting increase in financial transactions and speculation across borders. In addition to this, a range of second-order effects associated with the spread of political and economic globalisation grew, including the rise of hegemonic positions antithetical to the idea of public services and public goods, workplace regulations, unionisation and redistributive taxation (Genschel, Reference Genschel2004; Pierson, Reference Pierson1994; Przeworski and Wallerstein, Reference Przeworski and Wallerstein1988). Most importantly, globalisation tended to empower capital, politically and economically, more than it empowered labour. International competition meant that governments had to work harder to bolster and induce investment from the largest companies through creating the most attractive regulatory, fiscal and legal environments. And the countries that went furthest and fastest in creating such inducements rendered themselves most vulnerable to the 2008 banking crisis, in particular (Farnsworth, Reference Farnsworth2012).
Four countries were hit especially hard by the post-2008 economic crisis: the US, UK, Ireland and Iceland. What these four countries have in common is that they had the least regulated but largest financial sectors (relative to the size of their economies) of any other. This helps to explain why the contagion of the banking crisis, which began in the US, had such devastating impact on these four economies located thousands of miles apart, but barely touched the banking sector of Canada, a country that borders the US and whose economy is more integrated with the US than any other. But whatever the cause, the impact of the 2008 crisis in the UK has been far reaching, spawning as it did a decade of austerity and political turmoil.
A crisis in or of capitalism?
Soon after the 2008 crisis hit, Gamble (Reference Gamble2012) asked whether it represented a crisis in capitalism or of capitalism? This is an important question that forces us to distinguish between crises that might be reduced to, or explained by, isolated and/or exogenous events, and those that are more ‘systemically’ related to contradictions within the capitalist system or within the capitalist welfare state. Political economy approaches tend to view crises in the welfare state as borne out of the tensions that arise when politics and economics collide, especially when they threaten policies aimed at balancing the needs and interests of private businesses and citizens respectively. Such crises might be described as systemic when they emerge regularly and inevitably from the contradictions and/or tensions that are endemic to that system. For the welfare state, there is an ongoing tension between, on the one hand, demands for higher public spending necessary to satisfy human needs (through social welfare), and, on the other, the importance of facilitating the needs of the private for-profit sector (through corporate welfare). Others from across the political spectrum have similarly recognised the importance of ensuring that welfare states are compatible with competitive and productive economies. Put another way, the basic role of the capitalist welfare state is to reconcile social divisions, stave off political and economic instability, and create an alignment of business and labour interests within capitalism (Iversen and Soskice, Reference Iversen and Soskice2019).
Fulfilling this is no easy task. Neo-Marxists (Gough, Reference Gough1979; O’Connor, Reference O’Connor1973) suggested in the 1970s that it may be impossible to resolve what they refer to as the contradictions between the capitalist state’s legitimation (essentially the creation of social harmony and acquiescence to the state) and accumulation (the profitability, productivity and investment of businesses) functions. More recently, Wolfgang Streeck (Streeck, Reference Streeck2017) has argued that democracy and capitalism constantly collide and do so with increasing frequency so that it is difficult to simultaneously maintain both. Still others point to the systemic failures within capitalism as it has evolved over the past forty years or so (Stiglitz, Reference Stiglitz2019).
Many of the policy actions and reactions undertaken during the post-crisis period illustrate successive and distinct attempts to resolve and respond to ongoing crisis. Although the direction of travel has tended to favour austerity, different solutions, strategies and degrees of emphasis were also witnessed in different states. Returning to the question raised by Gamble, it may be that the post-2008 crisis, and subsequent austerity, did not represent a crisis IN or OF capitalism, but a crisis of particular capitalisms. And the ‘solution’ to the 2008 crisis (and subsequent waves of crisis) offered in the UK and many other states was austerity.
Waves of crisis
The 2008 banking crisis was both a leverage and capitalisation problem: a too high debt to asset ratio and an imbalance between assets and liabilities. The value of the assets held by a number of banks was in some cases impossible to determine, and, in others, it became clear that banks held more unsecured debt than they could effectively pay back. As the banking crisis took hold, it became a problem of legitimacy as bank after bank looked shaky in the face of their liabilities. Their response was to attempt to recapitalise, sell liquid assets and stop lending. Thus a liquidity crisis was borne which, in turn, spawned a housing crisis and acted as a break on the economy. The solution lay in massive state intervention to recapitalise some banks and guarantee others, thus preventing bankruptcies and the potential collapse of the whole banking sector. This came at a cost. The direct, upfront, costs of the banking crisis in the UK amounted to over £200bn (IMF, 2013), Comparatively speaking, this exceeded the costs of any other economy. If we add up the total value of its financial interventions, including guarantees, it would reveal a figure that was double the entire combined cost of all public expenditure prior to the 2008 crisis of around £1.3tn according to the New Economics Foundation (NEF). The cost of the crisis for the UK was undeniably large, but we should not take from this that economic crises, even those as serious as the 2008 crisis, do not prescribe any particular solution or set of solutions and they certainly do not make austerity inevitable. What is defined as a tolerable level of debt or a sustainable level of expenditure are political questions rather than economic prescriptions. We will return to this point later.
The economic crisis also brought other costs and risks. Unemployment, social protection costs and reductions in tax revenues added to public sector borrowing and debt. As mortgages were affected by the liquidity crisis, a new housing crisis loomed large. An employment crisis was created by lay-offs, and enforced reductions in working hours all contributed to the global slowdown and an economic recession in the UK. Economic crisis inevitably led to political crisis, the biggest manifestation of which for the UK has been Brexit. But before discussing Brexit, we have to examine in more detail the decade of austerity.
Defining austerity
Austerity, as it applies to nation states, is most commonly understood in economic terms as a concerted effort to reduce the structural deficit – the difference between revenues and expenditure that are not the outcome of the usual economic cycle. Blyth (Reference Blyth2013) extends this by defining it as a ‘voluntary correction’. Putting to one side the fact that some states impose austerity, not through their own choice, but imposed choices exercised by others, including creditor organisations, this definition is useful in pointing to austerity as an exercise in politics rather than economics.
Drilling down into austerity reveals other points of contention. Some within the public and social policy fields observe that welfare states have stood the test of time and are remarkably resilient in the face of internal and external pressures. Kersbergen et al. (Reference Kersbergen, Vis and Hemerijck2014), for instance, present a direct challenge to some of the claims surrounding austerity in the post-crisis period, captured by Armingeon (Reference Armingeon, Pierson, Castles and Naumann2013) in his assertion that, by 2010, austerity was the only game in town. Kersbergen et al. argue that, since some budgets are increasing, and since overall public expenditure in most nations had actually increased during the so-called period of austerity, that austerity, by definition, had not occurred.
What is clear from these debates is that austerity is a relatively loose concept that can be used in different ways to describe different ends. Ultimately, national ‘austerities’ are political economy constructions designed with particular ends in mind that tend to favour spending cuts, but which also aim to reconfigure the state and the fiscal environment. Thus, there are wide varieties in terms of the policy specifics. The following section looks at the evidence of movements in expenditure in a number of states and whether, and how, austerity has been applied. It represents an attempt to take stock and assess the depth and breadth of austerity in a number of states, but with a particular focus on the UK.
An audit of economic austerity
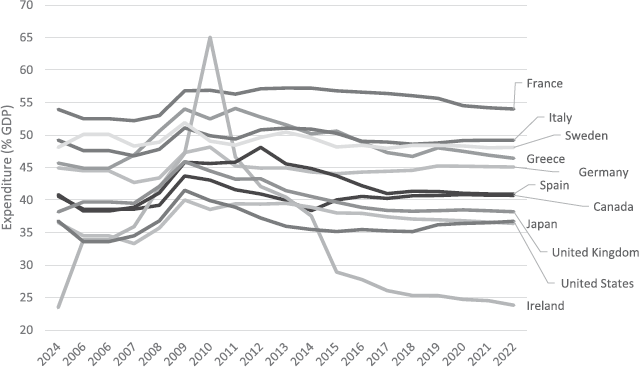
Looking at the spending data, Kersbergen et al. (Reference Kersbergen, Vis and Hemerijck2014) do appear to have a point. Available data on actual and projected expenditure compiled by the IMF and other international organisations suggest that expenditure has remained remarkably buoyant over time. Figure 1 looks at reported expenditure as a per cent of GDP between 2006-2019 and planned expenditure 2020 to 2024, in a number of economies. Projected expenditure tells us a great deal about the aims/ambitions and ideological ambitions of governments, although they are also subject to political change and unforeseen challenges (the impact of national Covid-19 measures from 2020 are not represented here). For the countries selected here, expenditure increases in the immediate aftermath of the 2008 crisis, before falling back. What is clear from Figure 1 is that, in most economies, expenditure levels off from 2020, although cuts are still planned in Ireland, Greece and, more modestly, France. It is also useful to note, here, that most countries, with the exception of Ireland, Sweden and the UK, are planning to spend more in 2024 than they were in 2006.
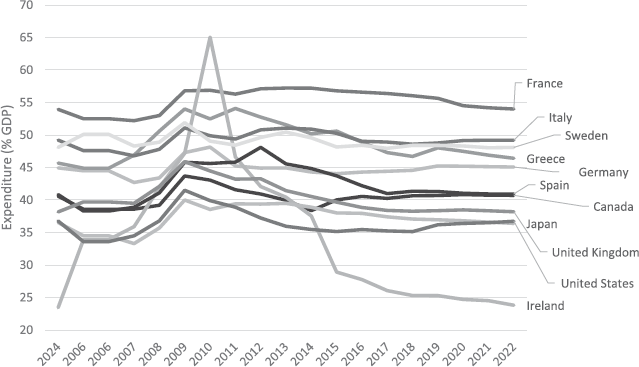
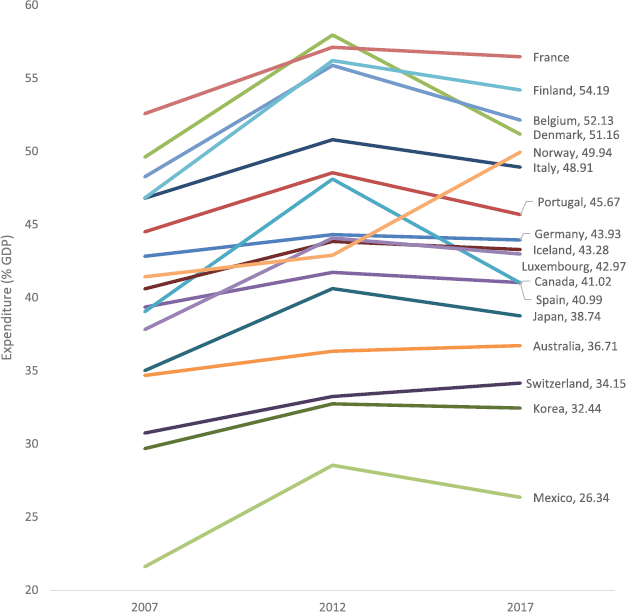
The shifts in expenditure appear starker if we compare expenditure levels before 2008, in the middle of the ‘austerity’ period, and in the most recent available data. Figures 2 and 3 contrast spending levels in 2007, 2012 and 2017. Taken together, these figures reveal that all states increase expenditure between 2007 and 2012, but not all states subsequently reduce expenditure to their pre-crisis levels. Those spending more at the end of the period than at the start – the expanding states – are mapped in Figure 2. Those spending less at the end of the period than at the beginning – the austerity states – are mapped in Figure 3.
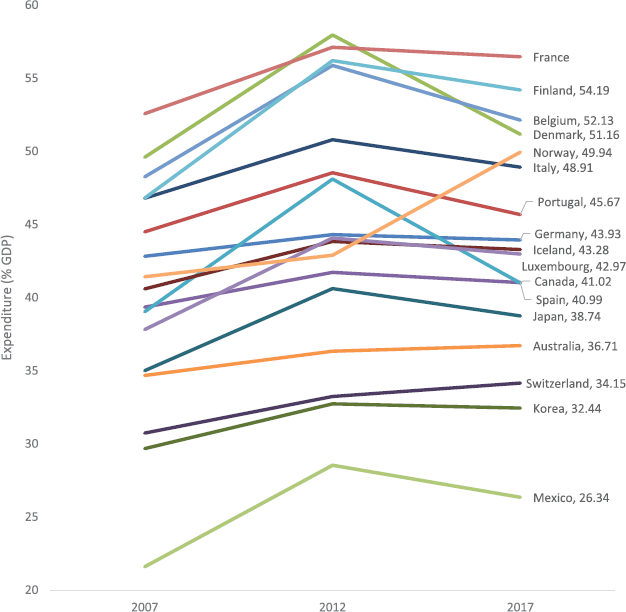

All states included here – made up of OECD nations where data across the periods were available – report increases in expenditure in 2012 compared with 2007. From 2012, some nations, in particular Ireland, Greece, the Czech Republic and the UK, cut expenditure dramatically from the 2012 point. And whilst many states cut expenditure between 2012 and 2017, many still ended the period recording higher expenditure in 2017 compared with 2007.
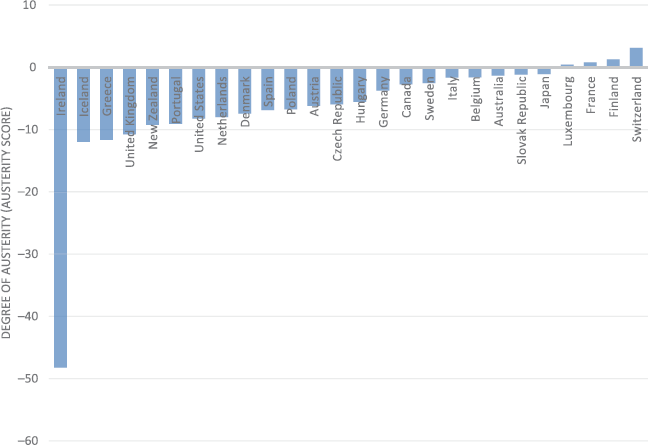
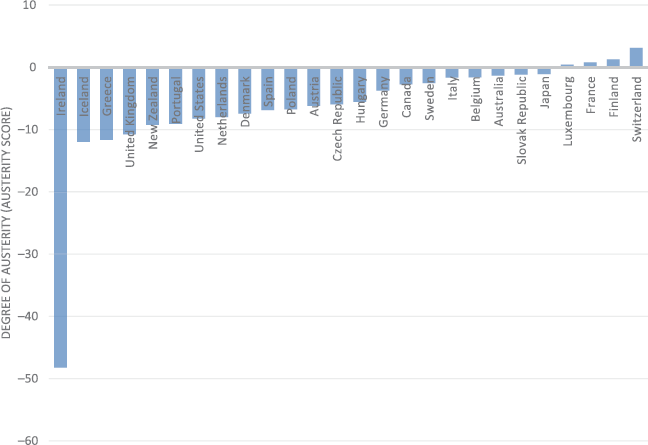
These figures illustrate the complexity of determining whether austerity has taken place based on expenditure data alone. To get a better sense, we have to combine approaches. Taken together, four variables provide an indication of the strength of austerity within states. First, we have to take into account pre-crisis expenditure. Average expenditure over several years in the 2004-2007 period provides some indication of settled expenditure in the pre-crisis period (variable A). Second, we need some measure of how expenditure changes between 2008 and 2011. This captures the immediate and sustained impact of the banking crisis and early economic slowdown on public expenditure (variable B). Third, the level of movement in expenditure during the 2012-2016 period captures the period of austerity (variable C). Fourth, expenditure across the most recent three years, 2017-2019, provides an indication of where public expenditure has settled compared with pre-crisis levels (variable D). These four variables have been used to create a proxy for austerity: (A-B)+(C-B)+(D-C)+(D-A) and the results are presented in Figure 4. Negative scores illustrate that some degree of expenditure austerity has been imposed on nations. At the extremes, Ireland experienced the highest level of austerity, whilst Switzerland did not experience austerity at all. Ireland, for instance, had pre-crisis expenditure levels of 32.5 per cent of GDP. The banking crisis pushed expenditure up to over 50 per cent of GDP. And recent figures suggest that public expenditure in Ireland is now worth 26 per cent of GDP. Switzerland, in contrast, had pre-crisis expenditure of 34 per cent of GDP which fell during the banking crisis to a little over 32 per cent of GDP. The 2017-2019 average places public expenditure in Switzerland at 34 per cent of GDP, identical to the pre-crisis level. Taken together, this data presented above confirms that most states put in place austerity measures and that the UK is one of most austere of all nations.
Austerity Scores.
Source: Author calculations based on expenditure data at OECD Statistics (2020).
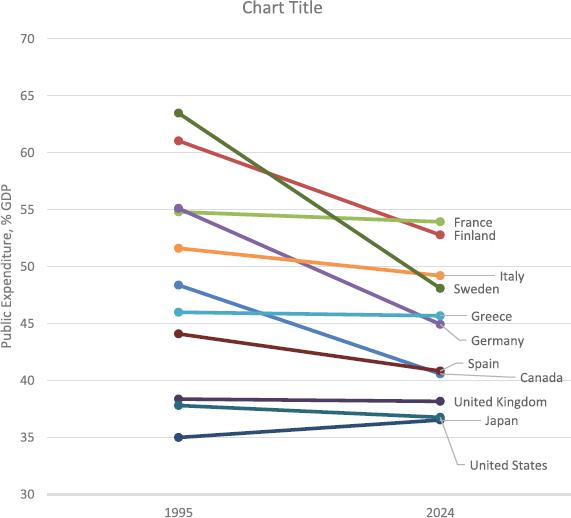
Despite signs of varying actual austerity, expenditure plans in most OECD countries are projected to coalesce rather than pull apart. Differentials in public expenditure in 1995, a year that begins the ‘long period of growth’ that characterised most OECD economies, broadly fit with welfare or particular variety of capitalist or welfare regime-type (Esping-Andersen, Reference Esping-Andersen1990; Hall and Soskice, Reference Hall and Soskice2001), but, by 2024, the differences in expenditure are projected to become smaller and the trend is downwards (see Figure 5). Note here that it matters more, in terms of planned austerity or planned expansion, what government projections are in future given current and future spending decisions. Expenditure across all economies is projected to fall, except for the lowest spending comparator economy here, Japan. Expenditure in the highest spending economies in 1995 is projected to fall fastest. The net result is that expenditure in these economies, representing various regime types, is projected to grow closer together. This suggests that economic austerity may be reducing some of the wider expenditure differentials between welfare states, although almost 30 GDP percentage points will still separate the largest from the smallest welfare states. And the UK is projected to remain a relatively low-spending welfare system.
Actual and projected public expenditure (% GDP), 1995-2024.
Source: IMF, Fiscal Monitor, 2018.
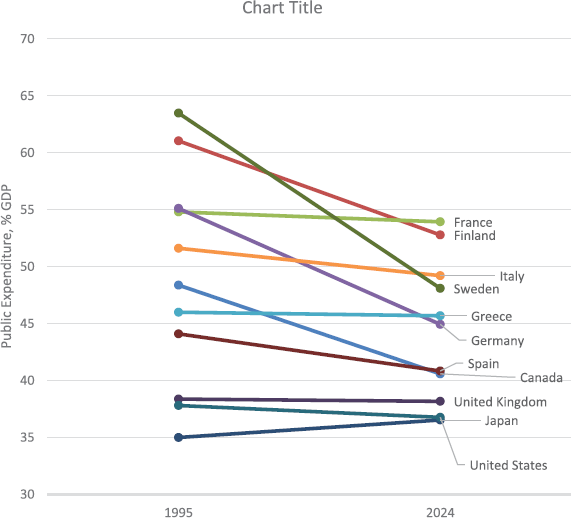
Although expenditure levels are important, ‘regime’ type or the particular ‘variety of capitalism’ is about more than expenditure. It is not how much the state spends, but how it spends, just as it is not about how much it raises in taxation, but how it raises tax revenues, that matters most. Deep cuts in one part of the welfare state cannot be compensated for by large increases in another part any more than increasing expenditure on defense will compensate citizens for equivalent cuts in public health services. This level of detail can really only be examined with reference to the broad political economy of nation states, and the remaining parts of this article review developments in one of the most austere states: the UK.
Austerity in the UK
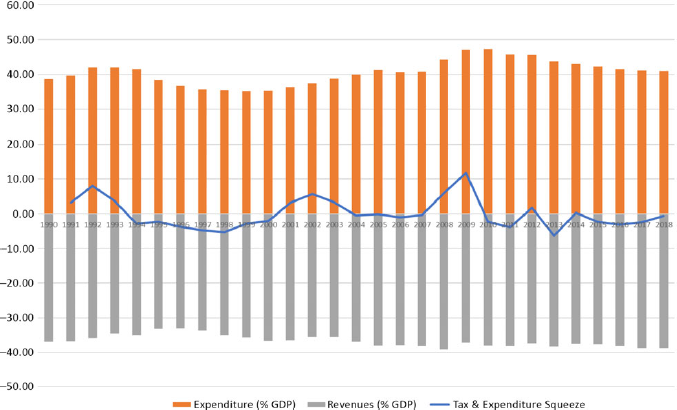
The UK is identified in the comparative data above as an ‘austerity’ state. But only marginally. If austerity is about deep and sustained cuts in public expenditure, the comparative data reveal the UK has frozen expenditure increases more than it has dramatically reduced expenditure. However, to understand more about the potential depth and impact of cuts on the British welfare state we have to delve deeper. We can do so by looking at two further indicators: departmental-level data and total expenditure against revenues over time.
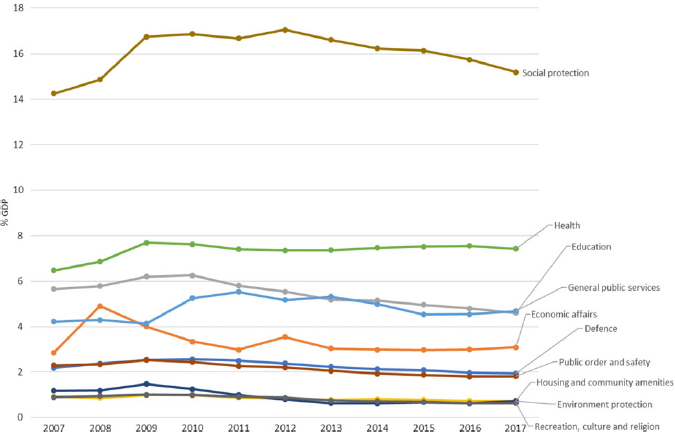
Looking at expenditure data by department (see Figure 6) for the UK confirms that: health expenditure has remained relatively stable over the period; social protection has fallen (primarily due to reductions in working-age benefits); education expenditure has been cut; and expenditure on most other services has plateaued. Drawing on analysis compiled by the Institute for Fiscal Studies (Zaranko, Reference Zaranko2020), which breaks down expenditure by population size (per capita expenditure as opposed to percentage of GDP), reveals a slightly different story. If we include health expenditure in overall spending, total real-terms public expenditure in 2020 was around 95 per cent of the 2009 level. Per capita, it was around 90 per cent. In March 2020, the UK government declared that austerity was at an end and announced increases in expenditure that would take real terms public expenditure to 105 per cent of 2009-10 figures. Excluding health spending and looking at real terms expenditure per capita reveals that combined non-health spending is set to increase from 75 per cent of 2009-10 levels in 2020-21, to 81 per cent by 2023-24 (ibid.), although these figures do precede the costs associated with the Covid pandemic.
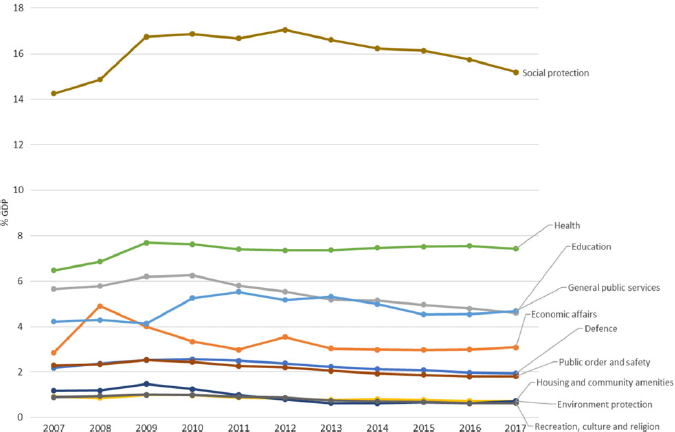
Some of the largest cuts have been made to social protection expenditure. Automatic inflation-based increases in benefits were frozen for working-age populations and other policies were imposed between 2016 and 2020. In addition, cuts were made in tax credits for working families. Third, a benefits cap was imposed which effectively limited the amount claimed by households from a range of housing and other benefits. Lastly, the government imposed a two-child limit, which limited child-related claims to two children or less for housing and non-housing related benefits (Office for Budgetary Responsibility, 2020). Moreover, according to work undertaken by the Resolution Foundation thinktank, continued cuts in welfare spending will strip an additional £2bn from the welfare budget between 2020-21 and 2024-25 (Corlett et al., Reference Corlett, Leslie and Tomlinson2020: Figure 18). This is in addition to the cuts previously imposed.
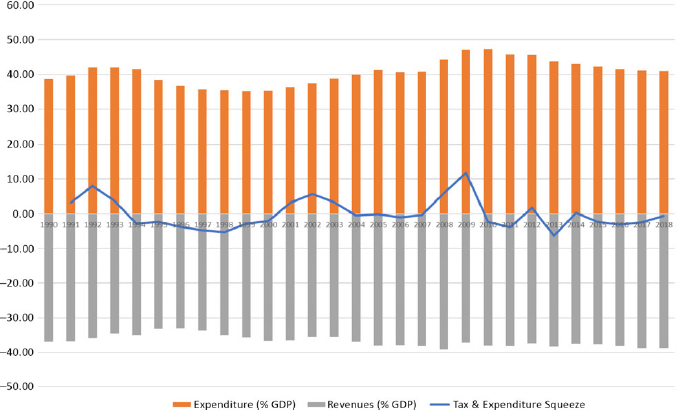
Increases in expenditure and reductions in taxes not only inflate the macro economy but also boost incomes (all other things being equal). Conversely, reductions in public spending and simultaneous increases in taxation squeeze incomes. Looking at the size of the resulting ‘austerity squeeze’ over time (negative values equate to a tighter squeeze) reveals that the period since 2010 has bitten more deeply than any time since the 1990s, when the economy could ill afford it (see Figure 7). And it reveals that the austerity squeeze from 2010 has been sustained and relatively deep save two blips. It also reveals that expenditure and taxes have both remained relatively high over the recent ‘austerity’ period. However, it is important to note that, in the pursuit of austerity, the UK government tended to rely more heavily on spending cuts rather than tax increases in order to achieve its stated aim of balancing its budget. Despite this, the net impact of cuts to benefits and tax changes were relatively neutral in fiscal terms. In other words, the changes made relatively little difference overall to the state finances (De Agostini et al., Reference De Agostini, Hills and Sutherland2018). But as always, the story is a little more complex than this because the changes did impact on equality (with the poorest hit most) and the changes in expenditure did have scarring effects (Farnsworth and Irving, Reference Farnsworth, Irving, Farnsworth and Irving2015).
Austerity remained a primary goal of all governments from 2010, right up to the 2019 election. The latter was the first to formally distance itself from austerity, not least because Boris Johnson, then leader of the Conservative Party, ran on a populist pro-Brexit platform that sought to encourage traditional Labour supporters to switch to the Conservatives. And it worked. The ‘end’ of austerity may not be a real reversal of cuts (as discussed above), but austerity appears to have been abandoned (at least in name). The fact that David Cameron and Theresa May have both warned their successor not to relax austerity is testament to this.
The politics of austerity
The discussion above has focused on questions relating to whether austerity has taken place or not. These are important questions, but they are overly narrow, focusing as they do on austerity economics. There is another, perhaps more important, dimension to austerity, however: austerity politics.
Austerity does not just describe economic policy instruments aimed at reducing expenditure. It also describes an approach to public services. And austerity, like all ideas and approaches, needs to be developed and sold by policy makers to establish a new zeitgeist or paradigmatic shift. In the UK, David Cameron embarked on such a project before being elected as Prime Minister. In 2009 he told the Conservative Party Conference that economic recovery required a reshaping of government, from ‘an age of irresponsibility’ to a ‘new age of austerity’. He added:
our plans for school reform, welfare reform and strengthening families plans which might once have been seen as just socially desirable in the age of austerity become economically essential (Cameron, Reference Cameron2009).
The political utilisation of austerity as a way of achieving what would ordinarily be desirable is clear here. However, the tone evolved from the lead up to the 2010 General Election to the early years of coalition as he sought to distinguish austerity from ideology:
We’re tackling the deficit because we have to – not out of some ideological zeal. This is a government led by people with a practical desire to sort out this country’s problems, not by ideology (Cameron, Reference Cameron2009).
I wish there was another way. I wish there was an easier way. But I tell you: there is no other responsible way. Back in May, we inherited public finances that can only be described as catastrophic (Cited in Watt, Reference Watt2013).
What followed the General Election, and the formation of a Conservative-led coalition government, was a concerted effort to establish austerity in the national conscience. Austerity was ‘well-framed and well-crafted’ and a mantra that was so frequently repeated it shaped how most people thought about the economy and presented a coherent vision for the kind of society we should live in (NEF, 2013).
Although those pushing austerity would deny its connection with ideology, the processes at work were clearly ideational; what others have referred to as political ‘framing’ (Fischer, Reference Fischer2003) or constructivism (Bell, Reference Bell2011). In the case of austerity, however, the economic rationale to balance budgets, given credence even by some who opposed austerity, helped to establish austerity, not simply as an idea, but as a hegemon. In the UK at least, austerity became a hegemonic lens through which citizens came to view politics and frame problems and their solutions. And this lens is, in turn, based on a particular framing of macroeconomic policy and the way in which money and debt are assumed to operate (Blyth, Reference Blyth2013; Pettifor, Reference Pettifor2017). There is also an important distinction here to be made between a desire to reduce unnecessary public expenditure and/or the pursuit of efficiencies. These are strategies that emerge from good governance. Austerity is an approach and an attempt to frame fiscal policy and expenditure in an entirely different way, one that places cuts above other goals such as, for instance, value for money or equality.
The processes at work here echo Lukes’ description of ideological power (his so-called third face of power) where power becomes invisible and actors become convinced that they are acting autonomously and of their own volition even when power is being exercised over them. Big government – what George Osborne, Chancellor of the Exchequer during the coalition years, referred to as ‘bloated waste’ – was portrayed as the problem, and what was originally presented as a ‘quick fix’ to ‘out-of-control’ public expenditure became a permanent solution to the myriad problems argued to have been created by the welfare state. Three years after the 2010 election, David Cameron explained in a key speech:
We are sticking to the task. But that doesn’t just mean making difficult decisions on public spending. It also means something more profound. It means building a leaner, more efficient state. We need to do more with less. Not just now, but permanently (Watt, Reference Watt2013).
In the UK austerity was used to sell to the electorate a set of ideas that would facilitate the completion of a project begun by previous Conservative Governments in the 1980s. The professed aim of the Conservative Party in the 1980s in particular was to shrink the state. And for some, such policies represented the beginning of permanent austerity (Pierson, Reference Pierson1994).
Austerity in the UK harks back to a glorified past when citizens made war time sacrifices for the good of the nation (Hill, Reference Hill, Farnsworth and Irving2012). As a concept austerity also builds upon popularised visions of the economy that were promoted during the Thatcher period whereby the economy was compared to the household budget. This powerful imagery was reused by austerity governments from 2010 with reference to previous governments exceeding the ‘credit card’ limit, claims that ‘there’s no money left’ and that failing to tackle the deficit will turn the UK into Greece. According to an interesting ethnography of how crisis and austerity played out in public perceptions by Stanley (Stanley, Reference Stanley2014), this strategy was very effective. Presenting the economy in this way also had the advantage of portraying the previous Labour Government’s profligacy as, not only a key cause of the 2008 crisis, but one of the reasons the crisis and recession were so deep in the UK.
But what of the Liberal Democratic part of the UK coalition government? Despite opposing austerity during the election campaign, the party came to accept and even promote spending cuts in the face of opposition in the wider party (Mason and Wintour, Reference Mason and Wintour2013).
In promoting austerity, the Liberal Democrats appear to have given in to the austerity narrative, even against the evidence that austerity doesn’t work. An argument that appears to have been especially convincing for the Conservatives from 2010 is that public expenditure deprives the private sector of much needed capital to invest and innovate. This is the so-called crowding-out thesis put forward in the 1970s by Bacon and Eltis (Bacon and Eltis, Reference Bacon and Eltis1976), but which also chimes with neo-Marxist arguments which state similarly that high public expenditure can lead to fiscal crisis (see, for instance, the work of O’Connor, Reference O’Connor1973). Reinhart and Rogoff’s (Reference Reinhart and Rogoff2010) work on the problem of government indebtedness found favour amongst austerity advocates and echoed assertions by the IMF that public borrowing above a certain level is unsustainable because it has a negative impact on growth. For Reinhart and Rogoff, the ‘cut off’ is 90 per cent of GDP. In its 2009 Fiscal Monitor the IMF based most of its calculations on sustainable debt to GDP ratios at 60 per cent of GDP (IMF, 2009).
The counter-argument to austerity is that spending cuts, especially during times of economic slow-down, are self-defeating (Blyth, Reference Blyth2013) and ultimately operate as a solution that creates more problems than it solves (Krugman, 29 April Reference Krugman2015). Senior economists from the IMF itself have also acknowledged that neoliberal policies, including privatisation and austerity, helped to drive the economic crisis, increased inequality, reduced growth and contributed to national fiscal fragility (IMF, 2018; Ostry et al., Reference Ostry, Loungani and Furceri2016).
Moreover, according to Guajardo et al. (Reference Guajardo, Leigh and Pescatori2014), austerity that is ‘discretionary’ as opposed to enforced by economic conditions, which certainly describes the situation in the UK, tends to be deflationary and therefore depress growth. There is also a straight-forward explanation for why this is the case. In discretionary austerity situations, politicians respond to past policy decisions and actions rather than current and/or prospective economic challenges. Such assessments of the economic failings of austerity are useful, but ultimately miss the point. For some advocates of austerity, including the UK Government, the ‘problem’ that austerity promised to solve was not the deficit nor even economic slowdown, but the welfare state itself. And the political project of austerity facilitated its shrinkage.
From crisis to crisis
Crises do not emerge from nowhere and each crisis, in that crises shape the social fabric and broader political economy, has an impact on subsequent crises and how they play out. Crises themselves impose costs but they also present opportunities, leading to social change or paradigm shifts (negative or positive), (Hill, Reference Hill, Farnsworth and Irving2012). The sections above illustrated the links between different waves of the economic crisis and the links with austerity. And austerity connects the economic crisis of 2008 with subsequent crises, notably Brexit and the global health pandemic, Covid-19. Although views may vary on the pros and cons of Brexit, it is undeniably a UK crisis insofar as it presents sufficiently widespread and structural change which potentially threatens the survival of the UK itself. And the referendum result was also linked to the 2008 crisis and to austerity. As Alastair Darling, Chancellor of the Exchequer in 2008, argued in 2017:
I think if you look at today’s political situation, you can trace it back to events of ten years ago, when people’s faith in structures and authority was shaken … A financial crisis became an economic crisis and that economic crisis became deeply political… (quoted in Treanor, Reference Treanor2017)
The 2016 Brexit referendum was an election promise made by the Conservatives during the 2015 general election campaign. This policy was an answer to the internal war that had dogged the Conservative Party for years. In the end, Cameron staked his future, and that of the country, on an in-out EU referendum in 2016. What he, and much of the political establishment, did not anticipate was that a majority (albeit only a marginal and only England and Wales) would vote for exiting the European Union. What was soon clear from the polling data was that there was not one factor that led to the Brexit vote, but a combination of rising inequality, declining health and living standards (Dorling, Reference Dorling2016), coupled with long-term decline in trust in political institutions (Williams, Reference Williams2020), concerns about immigration and the perception that the EU was to blame for failings in British political decisions.Footnote 2 Falling trust in government is not unique to the UK (Edelman, 2020), but British citizens were uniquely given an opportunity to vote for massive constitutional change and at a time of maximum disquiet given the previous decade of austerity. Added to this is the fact that Brexit has driven British politics, and in particular English and Welsh politics, to the populist Right. This is a hostile mix as far as social policy is concerned.
Austerity, reconfiguration and the British state
Given the economic and political dimensions of austerity outlined above, it is clear that the austerity project was about more than cuts in expenditure and balancing the budget. Austerity was about reconfiguring the state and the objective of public policies (Farnsworth, Reference Farnsworth2013; Farnsworth, Reference Farnsworth2019). As spending cuts were imposed and endured, hard pressed departments, regions, local councils and service delivery agents were forced to change the way they provided services, if they continued to provide them at all. There are three dimensions to the reconfiguration of the austerity state. First, alongside cuts in general expenditure, the shape and priorities of the state have been transformed. In the UK, as elsewhere, there has been a dramatic increase in the value of private capital and a decrease in the value of public capital following privatisations, outsourcing and marketisation. This has increased public sector financial risk by reducing the relative size of public assets compared with public sector debt. The net value of public assets declined from the equivalent of 60 per cent of GDP in 1970 to around minus 10 per cent of GDP (in other words, liabilities are higher than assets) in 2015. Private wealth has increased from less than 300 per cent of GDP in 1970 to over 600 per cent GDP in 2015 (IMF, 2018).
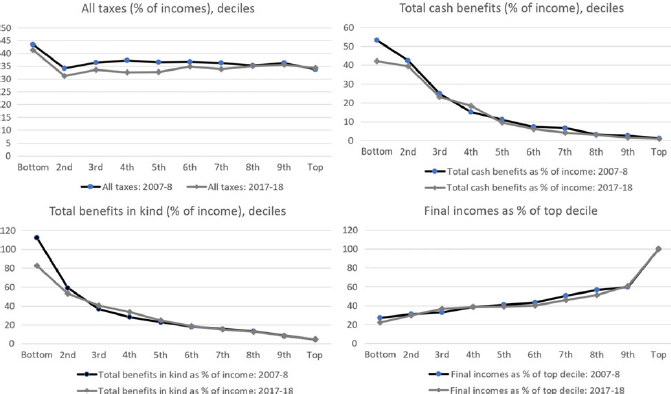
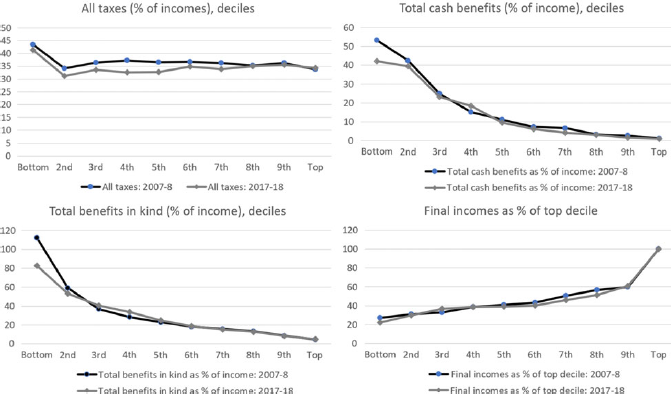
Second, the distribution of taxes and benefits has changed in favour of the better off. Figure 8 illustrates that, whilst taxes declined slightly for the bottom decile in 2017-18 compared with 2007-08, the value of cash benefits declined rapidly as did the value of benefits in kind. Final incomes as a percentage of the incomes of the top decile also declined amongst the bottom tenth of the population. Taken together, these figures indicate that austerity had the greatest impact on the bottom 20 per cent of the population, perhaps because services and benefits that are consumed more heavily by the better off (including health care, pensions and education) were cut less drastically. In a similar analysis of Housing Below Average Incomes data, Edmiston (Reference Edmiston2018: 34-6) concludes that the middle 20 per cent and the top 20 per cent made significant gains in terms of benefit payments over the 2009-2016 period whilst the poorest 20 per cent experienced sharp losses.
If things looked bad for progressive social policies and the poor before the 2008 crisis, they look even worse ten years on. The share of GDP going to workers, as opposed to corporate executives, has continued to fall (OECD and ILO, 2015), thanks in part to financial liberalisation, the undermining of trade unions and changes in tax systems (ILO and OECD, 2015). Wages across most OECD countries have stagnated (OECD, 2018), wealth and income inequality have widened (Oxfam, 2014), and job security has declined (ILO, 2015). Poverty has also increased in the UK since 2010, not just for those out of work, but also for growing numbers in work. Just under 10 per cent of workers were in poverty in 2007-8, increasing to 13.5 per cent by 2016-17. The numbers of those in in-work poverty increased to 4 million in 2016-7 compared with just over 2 million in 1996-7 (Barnard, Reference Barnard2018: 4).
The number of those in work receiving working-age benefits has also increased so that, by 2016, almost 60 per cent of working-age benefits went to households with adults in work, up from less than 40 per cent in 1995 (Joyce, Reference Joyce2018). The value of in-work benefits, including tax credits, to the bottom income decile, has also increased from less than 30 per cent of original incomes in 2008 to 55 per cent in 2010, falling off to 35 per cent in 2017 (Farnsworth and Irving, Reference Farnsworth, Irving, Millar and Sainsbury2018). By driving down wages, the decade of austerity has increased the importance of in-work benefits to reducing poverty, but, at the same time, cuts to in-work benefits have reduced their value. Health outcomes, including life expectancy, have also gone into reverse (Marmot et al., Reference Marmot, Allen, Boyce, Goldblatt and Morrison2020).
There has also been a switch in welfare effort, from the ‘undeserving’ to the ‘deserving’ poor and even better-off middle classes. As Edmiston (Reference Edmiston2018) points out, austerity has tended to favour fiscal recalibration measures, rather than fiscal consolidation, that have protected some departments and groups over others. This, he argues, has reorientated welfare states towards neoliberal productivist ends (Edmiston, Reference Edmiston2018: 3-4). Another way of putting this is that austerity has redirected fiscal policies and social and public policy effort away from social welfare towards corporate welfare (Farnsworth, Reference Farnsworth2013). The least productive and least business-beneficial benefit of all – out-of-work benefit – was accordingly targeted the hardest. As George Osborne (Reference Osborne2012) put it in his Conservative Party conference speech in 2012:
Where is the fairness, we ask, for the shift-worker, leaving home in the dark hours of the early morning, who looks up at the closed blinds of their next door neighbour sleeping off a life on benefits? … We speak for all those who want to work hard and get on.
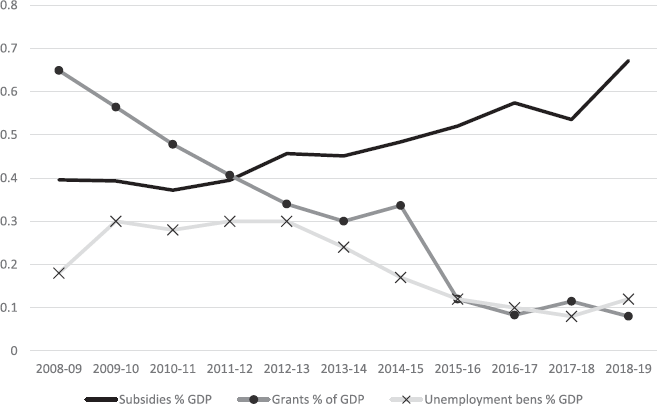
Although it is relatively easy to challenge such views on the factual evidence (more people ‘on benefits’ were in work in 2012 as discussed above), the purpose of this statement is to frame the unemployed in a particular way. Nonetheless, it is useful to note that, at the same time that the unemployed were being condemned and efforts were being made to cut the value of benefits for low-income families, subsidies aimed at supporting private businesses were being increased. Figure 9 illustrates the rising value of cash ‘benefits’ paid to citizens and those paid to corporations.

Such has been the impact of austerity that the UK state itself has been reconfigured. Notwithstanding the continued importance of devolved government in Scotland, Wales and Northern Ireland, local councils became less important. In England in particular, the freedom and role of local councils was curtailed. As a result of lower central subsidies and continued controls over how much councils could raise from local taxes, local spending fell by 21 per cent from 2010 (IFS, 2019). Northern England councils were hit especially hard (ibid). Some of this can be explained by structural change in education as more schools were encouraged, or forced, to break away entirely from local authority finance and control. Put more simply, the power and responsibilities of central government increased in the austerity period at the cost of local government.
Another decade, another crisis: Covid-19
Given the frequency with which they have hit economies over the post Second World War period, it was always likely that another global crisis would hit welfare states sooner or later following the 2008 crisis. Although this is different from previous global crises in that it is a viral pandemic, its impact is as much a result of politics and economics as it is biology (Wallace et al., Reference Wallace, Liebman, Chaves and Wallace2020). The extent of the Covid-19 crisis has been such that it is plunging the global economy into even greater depths than in 2008. Governments’ bailouts look like being higher and distributed across a much wider range of industries. And just like 2008, social policy is playing a huge part in the early responses to it. Health care systems are playing a key role in managing and responding to the health risks. Social protection systems are maintaining the incomes of those who have lost their jobs as a result of national lock-downs but are as much about protecting employers as they are employees. In the UK, emergency wage subsidies, targeted at those unable to work during the lock-down, are worth around 80 per cent of wages. Governments are also guaranteeing loans and mortgage payments. In a mirror of 2008, it is possible that this crisis will trigger a paradigmatic change in thinking, but it may well result in turbo-charged austerity once the pandemic is over. And once again, corporate welfare is being prioritised over social welfare.
Conclusion
The purpose of this article was to take stock and critically reflect on the decade of austerity and its impact on social policies, with a particular focus on the UK. The core arguments were relatively straight-forward: austerity is generally a political choice and its British variant has been especially impactful, both economically and politically. Economically, cuts have been made in welfare state expenditure, although the extent of the cuts has varied. Benefits for the unemployed – the so-called undeserving poor – were cut deepest. Politically, austerity has been used in order to change the debate and transform the way in which services are funded and delivered. Privatisation and marketisation have both increased, but state effort and state services have also been diverted so that they more effectively service the needs of the economy and of businesses. The political environment has also been reshaped. Political legitimacy has taken a hit across a number of states and, in the UK, has resulted in major change, including a rise in nationalism, populism and the UK’s withdrawal from the European Union. The result has been a hostile decade for British social policies. This was not inevitable. Progressive social policies can emerge from economic and political crises but there is little to suggest that the 2008 crisis produced anything resembling a silver lining. What many with an interest in the British welfare state will be wondering is whether the Covid-19 crisis eventually bolsters social policies or further undermines them.