

1. INTRODUCTION
One of the more consistent features of modern famines has been the disproportionately high mortality of males, particularly amongst relatively young adult men. This ‘female mortality advantage’ has been detected, for example, in post-war China (1959–1961), Bangladesh, and possibly the Sudan.Footnote 1 During the Second World War, bitter famines in Greece, Leningrad, Warsaw and the Netherlands all resulted in disproportionate increases in adult male mortality, while the contemporaneous famine in Bengal – despite widespread prioritisation of male nutritional needs – saw a similar sex bias.Footnote 2 Nor was this a new phenomenon. In India, Timothy Dyson found a male disadvantage in five major late-colonial famines.Footnote 3 As far back as 1876, the Report of the Indian Famine Commission recorded that ‘all authorities are agreed that women succumb to famine less easily than men’.Footnote 4 In fact, although less is known about this phenomenon in nineteenth-century famines, the emerging picture is consistent with that for the twentieth century, with studies of famine in 1840s Ireland and 1860s Finland suggesting disproportionate male mortality.Footnote 5 Indeed, on the other side of the world in Japan, a strikingly similar pattern of mortality has been found for later Tokugawa-period famines. In the northeast of the country, burial data suggest that in the Tenmei (1783–1787) and Tenpō (1833–1837) famines males made up 56 per cent and 61 per cent of deaths, respectively. In the mountainous Ogen-ji district, Ann Bowman Jannetta found that in normal years 49.2 per cent of burials were of males, but that this rose to 54.8 per cent in the famine year of 1837.Footnote 6 As Cormac Ó Gráda has recently pointed out, ‘[t]he evidence that females survive famine better than males is by now overwhelming’.Footnote 7
This female mortality advantage is, however, a rather curious phenomenon, for in most human societies, both historical and modern, women have suffered endemic economic and social discrimination. That females, and especially adult females, have not suffered accordingly during famines thus demands explanation, especially given the influence of theories of famine that have used the concept of resource ‘entitlements’ (which should, in patriarchal societies, generally have counted against women) to explain the social distribution of mortality.Footnote 8 Theories have varied considerably, from disproportionately poor data collection, through social and political factors, to biological ones.Footnote 9 Adult men might be more likely to migrate in search of food and work, and thus become exposed to disease.Footnote 10 However, this can only explain so much: important studies by Violetta Hionidou of wartime famines on the Greek islands of Syros and Mykonos, where blockades ensured the population was unusually immobile, suggest a powerful female mortality advantage nonetheless.Footnote 11 Another potential female advantage was political: welfare schemes might give preferential treatment to women and children as, in a corollary to widespread sex discrimination, they are often seen as more vulnerable and ‘deserving’ than adult males. Women might also enjoy certain micropolitical advantages, such as their control of the family cooking pot and thus of the distribution of food within the household.Footnote 12
The importance of such political and sociological factors is, however, hard to judge, and they cannot account for the consistent appearance of a female mortality advantage across such vastly differing social and political environments as – say – nineteenth-century rural Japan and 1940s Leningrad. Thus, other scholars have pointed to certain biological factors that might advantage adult women in the battle for survival. Famine-prone societies tend, of course, to be less economically developed, and therefore potentially subject to high levels of maternal mortality: thus the well-attested reduction in birth rates during famines might ‘save’ a number of adult women who might otherwise have died in childbirth. P. B. Boyle and Cormac Ó Gráda calculated that there were some 315,000 ‘averted births’ in Ireland between 1846 and 1851, which might have ‘saved’ some 5,000 maternal deaths.Footnote 13 In addition, men tended to be more susceptible to certain diseases, such as typhoid and malaria, which might closely follow or be exacerbated by famine conditions.Footnote 14 Perhaps the most plausible explanation, however, is physiological. In general, the female body is better equipped to survive conditions of starvation than the male: women's bodies tend to be smaller, lighter, have a slower metabolism and a higher proportional fat content than men's, making them more likely to survive acute undernutrition.Footnote 15 Thus, although the apparent variation in the level of female mortality advantage across time and space shows that other factors were at play, basic physiological differences between men and women have proved attractive to scholars attempting to explain sex differentials in mortality.Footnote 16 In fact, so marked are these biological differences that one commentator has suggested that ‘the more important is literal starvation rather than infectious disease as the cause of death, the greater the female advantage’, implying that an observable female mortality advantage can be read almost as proxy evidence for the presence of real starvation, or at least for disease mortality caused directly by malnutrition.Footnote 17
This latter suggestion is the starting point for this article. It looks at the evidence for female mortality advantage in England's two last confirmed famines (1597 and 1623). In doing so, it is thus able to question the specific nature of the mortality crises of these years, especially the latter. We know much less about the social environment than we do for modern famines. Issues such as migration levels, which are of clear significance, remain frustratingly obscure. The conclusions are inevitably tentative; however, during the worst phase of the 1623 famine the evidence suggests temporary yet disproportionately high mortality levels amongst males, and this in turn hints at deeper conclusions about the nature of the crisis itself.
2. FAMINE IN EARLY-MODERN ENGLAND
Our knowledge of sex-differentiated famine mortality is, as yet, confined to famines of the modern era. Although many of the societies that have been studied can be characterised as ‘underdeveloped’ or even ‘pre-industrial’, there have been no attempts to look for evidence of the female mortality advantage in early-modern famines. Of course, the practical difficulties of doing so are significant: censuses of population, in particular, are a creation of the modern world and rarely exist in useable form before the nineteenth, let alone the sixteenth and seventeenth centuries. But the potential rewards of such an exercise are significant: studying pre-modern famines brings historical time-depth to the study of this puzzling phenomenon: we need to know, particularly in the context of biological explanations, whether the female mortality advantage was an era-specific or timeless characteristic of famine. Meanwhile, looking deeper into the historical past also allows us to study famines in countries and regions, such as England, in which they have been absent in modern times. This study is both an unusual application of these questions to famine in the West, and the first time they have been asked in any systematic way of famines before the 1780s.
Early-modern England was still, in the early seventeenth century, a famine-prone society.Footnote 18 In actual fact, as scholars a generation ago showed, famine was beating a clear retreat by then.Footnote 19 The great upswing of population in the sixteenth century had not, like the similar surge of the thirteenth century, led to the same kind of catastrophic famine that ravaged the land in 1315–1322. Nor was there anything like the recurrent starvation that affected continental Europe, and Scotland and Ireland, in the seventeenth century. Rather, although there were episodes of widespread starvation in the second half of the sixteenth century, and although upland parts of the country suffered greatly in 1623, most of England had ‘slipped the shadow’ of famine by the accession of the Stuarts in 1603, and even the far North seems to have escaped after 1623. In the late 1640s, in 1674–1675 and especially in the 1690s, England suffered dearth but escaped famine,Footnote 20 while Scotland experienced (particularly in the 1690s) major mortality crises.Footnote 21 To study early-modern England is thus to study a society in which the threat of famine was receding.
This article will use two English famines as case studies, focusing on one of the country's most famine-prone regions, the North West. It will ask whether the widely acknowledged pattern of a female mortality advantage in the modern world is replicated in these early-modern famines, and what the implications might be then for our understanding of them. In the 1590s, recurrent harvest failures, the disruption caused by war, and the vicious swirl of disease, including bubonic plague, led to a series of mortality surges across England.Footnote 22 That of 1597, in which large areas of the North West were hit by mortality at the same time, has been interpreted as famine, and no doubt the famine conditions of that year aided the spread of disease thereafter.Footnote 23 Then, in 1623, two (perhaps three) harvest failures from 1621 onwards led to a catastrophic shortage of food in northern England, after decades of population growth, and depression in the cloth industry.Footnote 24 Although the crisis was regional, it was also severe, affecting a wide geographical area almost simultaneously. Indeed, it has been calculated that it killed as much as 5 per cent of the population in certain areas.Footnote 25
Although much has been written on early-modern famine, and on that of 1623 in particular, sex differentials in mortality have hardly received any attention. One study, by Susan Scott and C. J. Duncan on the 1623 crisis in Penrith (Cumberland), found little evidence of any differential by sex, but – based as it was on family reconstitutions – their sample size was far too small to be conclusive.Footnote 26 At the same time, the impressive aggregative analysis by an extra-mural group led by C. D. Rogers on Lancashire found that, in the 12-month period from 25 March 1623 to 24 March 1624, males and females died in equal numbers, leading them to conclude that ‘those diseases which tend to kill one sex more than another … were not likely to be of any significance’.Footnote 27 This result, however, can be immediately disregarded for, in a rare lapse, Rogers and colleagues failed either to disaggregate these data by month or age, or to compare famine ratios with those for ‘normal’ years, i.e. against background levels. They simply assumed that burial sex ratios at or near parity were ‘normal’ whereas the data produced for this article show that they were not.
The lack of work on burial sex ratios in famines is surprising given the relatively straightforward source material and methodologies available. Before turning to these, however, it is worth saying something briefly about causes of death during early-modern food shortages. The key point, now well established by numerous studies of famine both modern and historical, is that actual starvation may not necessarily have accounted for all or even most deaths. Disease, which could be an autonomous or semi-autonomous actor, was perhaps more likely to be the major killer. In some extreme cases, starvation, or disease caused directly and immediately by undernutrition, clearly did cause mortality. There are records – in most famines – of poor unfortunate women, men, and children pining to death by the side of roads or seeking shelter in barns and under hedges, or crowded in urban slums; there have also been cases where people ate unsuitable foods in the absence of other sustenance, fell ill, and died.Footnote 28 It is, however, usually argued that the more important killer in famines was not starvation, or even disease brought on by impaired resistance to infection due to undernutrition. Indeed, applying this argument to historical famines in an influential essay, Massimo Livi-Bacci has suggested that the link between food shortages and mortality crisis was generally social rather than biological. In this model, dearth forced poor folk to migrate in search of food; they congregated in towns and cities, often cramming themselves in poorly irrigated and cramped suburbs.Footnote 29 This movement aided the spread of disease, and it was this that ultimately caused most deaths.
As it happens, we know little about the proximate causes of death in the 1597 famine, but that of 1623 is usually taken as having a very real element of actual starvation. In fact, 1623 is one of the few pre-modern famines which yield robust evidence for people starving to death: this is from the parish register of Greystoke (Cumberland), which contains a number of references to poor unfortunates dying of hunger.Footnote 30 In addition, the group led by Rogers – arguing that the seasonal distribution of burials did not fit that expected for several potentially epidemic diseases, specifically influenza, bubonic plague, cholera, food poisoning and typhoid, and pointing out the general lack of evidence for sickness from contemporary comment – felt they had eliminated most diseases, arguing also that the concurrent drop in conceptions was prima facie evidence for starvation.Footnote 31
Nonetheless, there is some evidence that disease played at least a partial role in mortality, as indeed we would expect. We can safely do away with W. G. Howson's assertion that the crisis was one of plague: the mortality peak was too gradual for that, and there is no evidence of it passing between urban centres in the way that plague did.Footnote 32 Nor is there any independent evidence from administrative sources such as Quarter Sessions papers, or any ascription to plague in the region's parish registers. Charles Creighton, for example, argued for the presence of typhus, dysentery and smallpox, with typhus predominating, while Reginald Sharpe France noted evidence of a ‘malignant spotted fever’, again possibly symptomatic of typhus.Footnote 33 More recently, Maureen James suggests that the observed winter peak in burials might be indicative of typhus.Footnote 34 Of course, asking whether a crisis was ‘disease or famine’ is in some senses misguided, and we should not make a rigid distinction. However, there is room within the same crisis of subsistence for a mortal role to be played both by actual starvation (or death from diseases related to severe hunger) and semi-autonomous disease (by which is meant disease that might exist regardless of the famine, but might be spread unusually widely – and be particularly mortal – because of the social disruption and altered behaviour attendant on food shortage). We will return to these questions, and their relationship with any female mortality advantage, at the end of this article.
3. SOURCES FOR EARLY-MODERN FAMINE DEMOGRAPHY
The key sources we have for the study of famine mortality in early-modern England are parish registers. These were instigated by the government of Thomas Cromwell in 1538, and were supposed to record every baptism, marriage and burial that took place in every parish church and parochial chapel in England and Wales. Their survival is very patchy up to 1598 (after which date a copy had to be lodged with the bishopric), but becomes much more widespread from the seventeenth century.Footnote 35
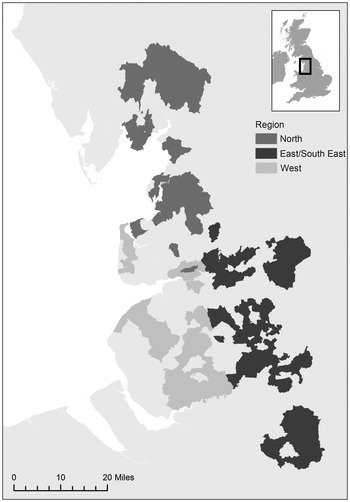
The basic methodology used here is to quantify burials by sex in a series of 33 registers from Macclesfield Hundred in the northern part of Cheshire, the historic county of Lancashire, and southern Westmorland, with the bulk coming from Lancashire. These all survive for the 1623 crisis, but the evidence from the 1590s is unfortunately very patchy, with just 14 of these registers yielding useable data.Footnote 36 The registers – mostly available in published form in volumes compiled largely for genealogical purposes – were selected for their availability and their strong coverage of both baptisms and burials for the period from 1618 to 1626. They have been divided into three subregions (described below) based on the area's economic geography for analysis. They cover around a third of all registration jurisdictions (parishes and chapels of ease), but probably about half of the region's total population, based on estimates from the Hearth Tax returns of the 1670s and 1680s (Figure 1). Generally they are skewed towards the lowland parts of the region, though they include much of the rugged terrain of Furness and south Westmorland. The sample parishes, at least for the 1620s, cover most of the major towns in the region, though not Liverpool, Rochdale or Clitheroe. In the southwestern part of Lancashire, where Roman Catholicism remained strong, some of the population may not have registered their vital events in the parish church, although it is not possible to say whether this withdrawal was gendered, or whether it changed during mortality crises.
Sample burial registers used, North West of England. Source: Author's own map using Geographic Information Systems (GIS) boundary data from GIS of the ancient parishes of England and Wales, 1500–1850, deposited with the UK Data Service by H. R. Southall and N. Burton (SN: 4828).

The method of calculating burial sex ratios is straightforward, although in some cases the sex is indeterminable.Footnote 37 This is quite widespread amongst children, with 22.9 per cent of child burials being of unidentifiable sex. These probably represent neonatal deaths, and as such males might be over-represented, though among child burials for which the sex is known, the ratio of males to females is 108, which is about what we would expect. Amongst adults, such cases are rare: only 0.6 per cent of adult burials have no identifiable sex.
As there are no censuses for the period, we cannot calculate sex ratios for the total population or sex-specific mortality rates. Indeed, there are a number of factors that might have led to secular skewing of recorded sex ratios at burial, such as imbalanced migration patterns, different levels of recusancy between men and women, or even (when it comes to distinguishing ‘adults’ and ‘children’) the possibility that boys and girls left home at different ages. As will be seen below, there was a regional dimension to this, in that the baseline ratios of male to female burials were lower in the north and the southeast/eastern parts of the region compared with the west, which in turn could suggest that men were migrating towards the richer farming lands of the western lowlands. As a result, it is certainly problematic to compare ratios with modern famines where the precise form of record-keeping might have been very different. The methodology here has been to look for burial ratios during crisis years that are markedly different from non-crisis years. Differences can then be tested for statistical significance. Thus, a baseline rate was calculated for the 48-month periods from January 1592 to December 1595, and from January 1618 to December 1621, and these were then compared with rates during the ensuing crises, with statistical significance assessed using a straightforward chi-square test.Footnote 38
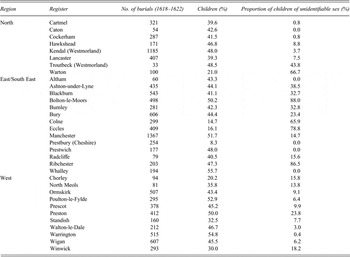
Burial registers from this period do not record specific ages at death, so finely tuned age- and gender-specific mortality patterns cannot be recovered as they sometimes can for modern famines.Footnote 39 Registers do, however, often give something of a proxy for age in that they usually record children in a different manner to adults. Thus, while an adult male will be buried under his own name, and an adult female often recorded as a ‘wife’ of someone, children were usually recorded as the ‘son of’ or ‘daughter of’ their father. It is not entirely clear what the cut-off point was between being recorded as someone's child and being buried as an ‘adult’; D. E. C. Eversley suggested some time ago that it lay somewhere near the age of 18 years.Footnote 40 But it might also have been taken as the moment in which an individual left their parental home. Looking at the 33 burial registers studied here, generally speaking the proportion of ‘child’ burials in the 1620s was fairly consistently in the 40–55 per cent bracket, which hints at general reliability (Table 1). There were some outliers which were probably simply not recording children consistently as such, and there is a slight (and curious) observable tendency for parishes in the west of the region to have lower ‘child’ percentages, something which may perhaps reflect an earlier age at leaving home, possibly to enter into service in husbandry, which remained a crucial form of employment for the county's young, especially in its western and lowland parts.Footnote 41 Alternatively it could reflect a lower birth rate, though this would perhaps be unexpected in the wealthiest and most agriculturally productive part of the region.Footnote 42 Or, again, it might reflect the migration of adults into the area, thus making children a lower proportion of the total population. Essentially, however, there remains a suspicion either that different definitions of adulthood were being deployed across different parishes, or simply that a small number of parishes were rather less diligent in recording children than others. Thus, although registers do give us a rough distinction between adults and children, they are clearly not completely watertight for this purpose, and in the data analysis here, when we are looking at ‘adult’ burial patterns, those registers recording fewer than 30 per cent of burials as ‘children’ will be excluded.
Child burial proportions, 1618–1622

Source: Parish registers: H. Brierley ed., The registers of the parish church of Cartmel in the county of Lancaster, 1559–1661 (Lancashire Parish Register Society [hereafter LPRS], 28, Rochdale, 1907); H. Brierley ed., The registers of Caton, 1585–1718 (LPRS, 59, Preston, 1922); Lancashire Parish Register Society eds., The registers of the parish church of Cockerham in the county of Lancaster, 1595–1657 (LPRS, 21, Cambridge, 1904); H. S. Cowper ed., The oldest register book of the parish of Hawkshead in Lancashire, 1568–1704 (London, 1897); H. Brierley and R. N. Brierley eds., The registers of Kendal, Westmorland (Kendal, 1921–52); H. Brierley ed., The registers of the parish church of Lancaster, 1599–1690 (LPRS, 32, Cambridge, 1908); Cumbria Record Office (Kendal Branch), WPR 62/1/1/1-2, Troutbeck Chapelry Register, 1579–1629, 1633–61; W. H. Chippendall ed., The parish registers of Warton, 1568–1812 (LPRS, 73, Preston, 1935); H. Brierley ed., The parish registers of the church of Altham in the county of Lancaster, 1596–1695 (LPRS, 36, Cambridge, 1909); H. Brierley ed., The parish registers of Ashton-under-Lyne, 1594–1720 (LPRS, 65, Preston, 1927–8); H. Brierley ed., The registers of the parish church of Blackburn in the county of Lancaster, 1600–1660 (LPRS, 41, Cambridge, 1911); A. Sparke ed., The registers of the parish church of Bolton, 1573–1660 (LPRS, 50, Bolton, 1913); W. Farrer ed., The registers of the parish church of Burnley in the county of Lancaster (LPRS, 2, Rochdale, 1899); H. Brierley and W. J. Löwenberg eds., The registers of the parish church of Bury, 1590–1646 (LPRS, 1, 10, Rochdale, 1898–1900); T. B. Ecroyd ed., The registers of the parish church of Colne in the county of Lancaster, 1599–1653 (LPRS, 17, Rochdale, 1904); A. E. Hodder ed., The registers of the parish church of Eccles in the county of Lancaster, 1564–1632 (LPRS, 25, Rochdale, 1906); E. Axon and H. Brierley eds., The registers of the cathedral church of Manchester, 1573–1655 (LPRS, 31, 55, 56, Cambridge, 1908–16); J. Croston ed., The register book of christenings, weddings, and burials within the parish of Prestbury, 1560–1636 (Record Society of Lancashire and Cheshire, 5, Manchester, 1881); H. Brierley ed., The registers of the parish church of Prestwich, 1603–1688 (LPRS, 34, Cambridge, 1909); J. Clayton ed., The registers of the parish church of Radcliffe, 1557–1783 (LPRS, 60, 61, Cambridge, 1922–23); J. Arrowsmith ed., The registers of the parish church of Ribchester in the county of Lancaster, 1598–1694 (LPRS, 26, Wigan, 1906); T. B. Ecroyd ed., The registers of the parish church of Whalley in the county of Lancaster, 1538–1653 (LPRS, 7, 74, Preston, 1900–1936); E. McKnight and H. Brierley eds., The registers of the parish church of Chorley in the county of Lancaster, 1548–1653 (LPRS, 38, Cambridge, 1910); H. Brierley ed., The parish registers of North Meols, 1594–1731 (LPRS, 66, Preston, 1929); J. Arrowsmith and T. Williams eds., The registers of the parish church of Ormskirk in the county of Lancaster, 1557–1678 (LPRS, 13, 98, Rochdale, 1902–1960); W. E. Robinson ed., The registers of the parish church of Poulton-le-Fylde in the county of Lancaster, 1591–1677 (LPRS, 19, Wigan, 1904); F. V. Driffield ed., The parish register of Prescot, 1573–1631 (LPRS, 76, Preston, 1938); A. E. Hodder ed., The registers of the parish church of Preston, Lancashire, 1611–35 (LPRS, 48, Wigan, 1913); H. Brierley ed., The registers of the parish church of Standish in the county of Lancaster, 1560–1653 (LPRS, 46, Cambridge, 1912); G. E. C. Clayton ed., The registers of the parish of Walton-le-Dale in the county of Lancaster, 1609–1812 (LPRS, 37, Wigan, 1910); A. Sparke ed., The parish registers of Warrington, 1591–1653 (LPRS, 70, Preston, 1933); Lancashire Parish Register Society eds., The registers of the parish church of Wigan in the county of Lancaster (LPRS, 4, 152, Wigan and Preston, 1899–2001); R. Dickinson and F. Dickinson eds., The register of Winwick parish church (LPRS, 109, 113, Preston, 1970–74).
4. THE EARLY-MODERN NORTH WEST
The region under study is part of northwest England, with the focus on the historic counties of Lancashire and southern Westmorland. This was historically a poor and underdeveloped region. There were significant pockets of textile industry in the North around Kendal (although this industry was, by the early seventeenth century apparently in decline) and in the South and East around Manchester and the middle Pennines.Footnote 43 In the latter case, established woollen industries were developing in parallel with newer cotton-based ones that were taking the first steps in a long-run trajectory that would eventually see the south Lancashire area radically industrialise in the later eighteenth century.Footnote 44 There was also significant linen manufacture in the west of the county and up the Lune Valley. The seventeenth century would also see the gradual development of metalworking industries on the coalfields of southwest Lancashire, around Wigan and the as yet relatively insignificant port of Liverpool, but the strength of this industry before the Civil War remains conjectural. Far more important, as elsewhere, was agriculture, with the North West largely given over to pasture farms. In the north of the region, and in the Pennine hills that dominate the East, farmers eked out a living on cold enclosures and the vast rough pastures of the moors and fens. But if one were to follow one of the rivers that segmented the region from their springs in the Pennines or the Cumbrian mountains to the sea, then one would pass through greener pastures and some arable lands in the lowlands, though even here there were large, unimproved mosslands in the flat plains by the coast. Many upland farmers managed to grow some grain, mostly oats and barley, but there was also some more significant arable production on the Lancashire seaboard, especially in the hundreds of Amounderness and West Derby. As for towns, the region was actually fairly well-endowed, but we must distance ourselves from thoughts of the area's rampant modern urbanisation: Bolton, Bury, Blackburn, Rochdale and others were all small market centres, not the sprawling towns they would become. The main towns, indeed, were the political centres at which county government took place: Manchester, Wigan (and Ormskirk to a lesser extent), Preston and Lancaster in Lancashire, and Kendal in Westmorland. In the early seventeenth century all of these remained small, country towns of a few thousand inhabitants at most. There were no examples of the kind of dense cities with their suburban slums that characterised parts of Europe in the sixteenth and seventeenth centuries. This was still a rural landscape.
Until the end of James I's reign at least, the North West was famine-prone as well as underdeveloped. The poor quality of the soil, as well as the distance from the main grain-producing regions of southern England, meant that the region would always have a precarious food supply. In addition, as with elsewhere in the country, the sixteenth century brought demographic growth, with the population perhaps roughly doubling between the first half of the sixteenth century and the 1620s. According to Andrew Appleby, in Cumberland and Westmorland this growth brought the atomisation of customary landholdings and the enclosure and colonisation of increasingly marginal lands in the uplands.Footnote 45 In the Lancashire Pennines, too, there is evidence of the subdivision of holdings, and aggressive rent-seeking by the region's landlords might have deepened the peasantry's hardship.Footnote 46 On the other hand, a more recent (if localised) study has suggested that customary landholdings were more viable, and less likely to become subdivided, in the fells of central south Westmorland, than Appleby supposed. Rather, population growth was absorbed by the proliferation of an especially vulnerable class of subtenants.Footnote 47 It seems, additionally, that many of the region's inhabitants relied heavily on textile work to survive. When textile manufactures were hit by depression in the 1590s and 1620s they were doubly at risk. Less work has been done on the population structure of the lowlands, but they saw population growth and thus almost certainly increasing poverty. Indeed, comparisons of estimated populations in 1563 and 1664 suggest that, in Lancashire, it was lowland areas that saw the greatest population growth.Footnote 48
5. THE CHRONOLOGY OF FAMINE IN NORTHWEST ENGLAND
The precise chronology of famine in the period is not known, but certain periods appear to have been especially tough. There was probably starvation in the 1550s, when there is evidence for starvation even in Westminster, right at the political centre.Footnote 49 In 1587–1588, shortly after the poor harvest of 1586, it has been suggested that famine intermeshed with a typhus epidemic causing a severe mortality crisis in Cumberland and Westmorland.Footnote 50 The crisis hit as far south as Manchester, and may well have struck the whole region. Following this, the 1590s were an exceptionally hard decade by any standards: indeed, they may have marked the nadir of English real wages since medieval times.Footnote 51 Successive poor harvests from 1594 to 1597 left grain stocks exceptionally low, while the continuation of war against Spain kept industry depressed.Footnote 52 The 1598 harvest relieved the pressure, and food prices fell, but the presence of plague – part of a wider pandemic across Atlantic Europe – meant continued mortality crises through 1598 and 1599. In the North West, Appleby's data suggest burial levels hit roughly double their normal level.Footnote 53
Following this came a short period of relative stability, though there was an exceptionally lethal outbreak of plague in Manchester in 1605.Footnote 54 Famine then returned in the 1620s. Over most of England the evidence suggests this was not as severe a crisis as that of the 1590s, but it is clear that the North West was hit extremely hard, with burial numbers reaching around three times normal levels.Footnote 55 Part of the crisis can be traced to the European industrial depression that started at the end of the 1610s, resulting partly from currency manipulations in Germany; the main cause, however, was undoubtedly a shortage of food.Footnote 56 The harvest of 1621 was poor, that of 1622 disastrous, with food shortages continuing in the North and West into the early months of 1624.Footnote 57 The main period of mortality, it seems, ran from the end of 1622 to early spring 1624.Footnote 58
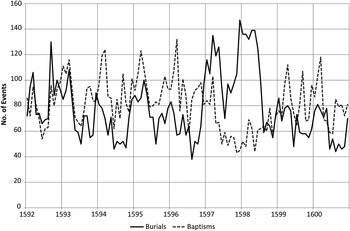
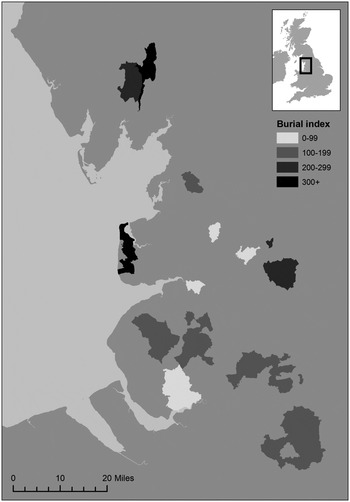
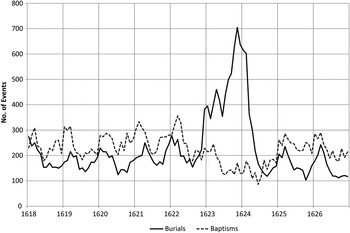
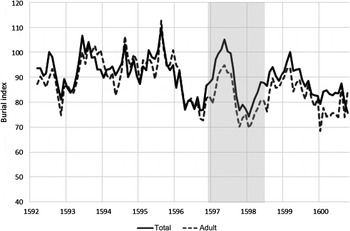
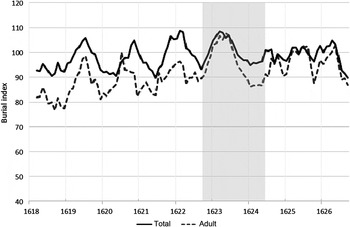
Before looking at the evidence for sex differentials in mortality, it is important to get a sense of the scale of the mortality crisis. Figures 2–6 show the broad outline of mortality during the two crises. Both saw greatly heightened mortality, and both also witnessed the drop in baptisms often taken as indicative of famine: conditions of starvation leading to reduced sex drive, deliberate abstinence, and amenorrhoea, and perhaps also abstinence enforced by mortality and migration. The apparently greater severity of the later crisis is perhaps illusory: record survival for the 1590s is considerably worse, with the data taken from 14 registers compared with 33, and there is likely to have been a selection bias with registration more likely to break down in parishes harder hit by mortality. In both cases two peaks are discernible: in the 1590s there were peaks in the winter/spring of 1596–1597 and again in the winter/spring of 1597–1598; in the 1620s the first peak ran from the final months of 1622 to late summer 1623, then the second hit from the autumn of that year before dying down quite suddenly in the spring of 1624.
Total burials and baptisms, sample parishes, 1592–1600. Sources: Parish registers (see Table 1).

Crisis burial index by register, December 1596 to June 1598, North West of England (1592–1595 = 100). Source: Author's own map using Geographic Information Systems (GIS) boundary data from GIS of the ancient parishes of England and Wales, 1500–1850, deposited with the UK Data Service by H. R. Southall and N. Burton (SN: 4828).

Total burials and baptisms, sample parishes, 1618–1626. Sources: Parish registers (see Table 1).

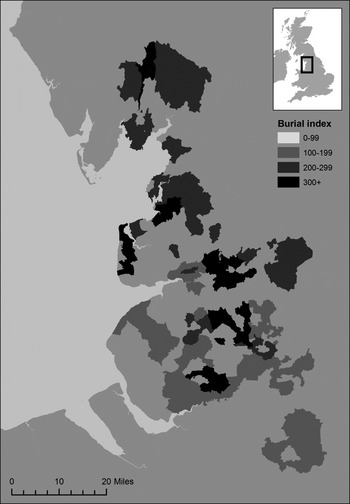
Crisis burial index by register, October 1622 to May 1624, North West of England (1618–1621 = 100). Source: Author's own map using Geographic Information Systems (GIS) boundary data from GIS of the ancient parishes of England and Wales, 1500–1850, deposited with the UK Data Service by H. R. Southall and N. Burton (SN: 4828).

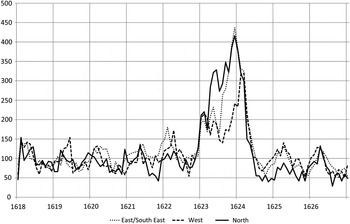
Indexed burials by subregion, 1618–1626 (1618–1621 monthly mean = 100). Sources: Parish registers (see Table 1).

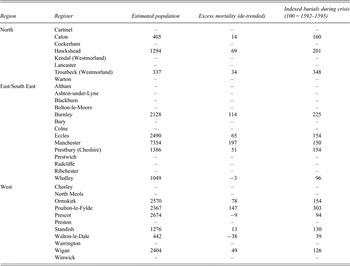
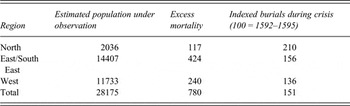
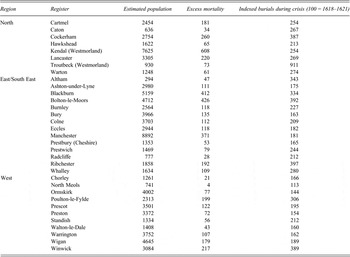
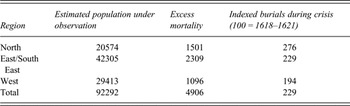
It is also possible to make rough estimates of the magnitude of the crises. This can be achieved by calculating an ‘excess burial’ total and comparing it with the at-risk populations. A baseline monthly mortality level was calculated from burials in a period before the crisis, and subtracted from the recorded totals for ‘crisis’ months to obtain the number of ‘excess’ burials. Baselines were calculated from the 48-month periods from January 1592 to December 1595 and from January 1618 to December 1621, inclusive. ‘Crisis’ burials were taken as those between December 1596 and June 1598, and from October 1622 to May 1624. Since burial rates tended to follow a seasonal pattern in normal years, peaking in the winter months, burial levels during the crisis period were compared with the same months in a hypothetical ‘normal’ period, based upon the mean number of burials in each calendar month in the baseline period.
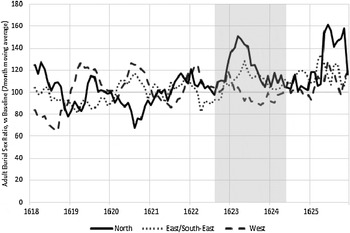
According to these calculations, burial levels lay at 51 per cent and 129 per cent above their normal level in the 1590s and 1620s crises, respectively. Rough population estimatesFootnote 59 for each parish are compared with excess mortality calculations in Tables 2–5. Parishes have been grouped into three subregions, along broad economic and topographical lines, with the ‘west’ region corresponding to the lowland arable and metalworking district, the ‘east/southeast’ with the textile zone, and the ‘north’ with the largely agricultural uplands of Lonsdale and Kendale.Footnote 60 The data in Table 5, and Figure 5 suggest that – as we would expect – the crisis of 1623 in particular was notably more serious in the northern, poorer parts of the region.
Estimates of population and famine mortality, 1592–1598

Source: Parish registers (see Table 1).

Estimates of population and famine mortality, 1618–1624

Source: Parish registers (see Table 1).

6. SEX DIFFERENTIALS IN MORTALITY
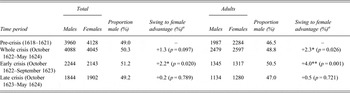
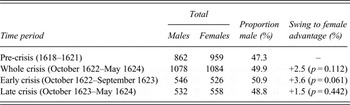
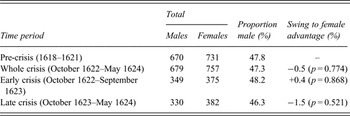
Once the timing and severity of each crisis has been established, the next step is to look for changes in the sex differentials in mortality. Tables 6–9 and Figures 7–9 show changes in the burial sex ratios (expressed in male burials per 100 female) in each crisis, including figures for ‘adult’ burials and figures disaggregated by subregion. Figures 7–9 suggest there was no female mortality advantage across the whole crisis of the 1590s; in fact, burial ratios swung the other way. (In Figure 7, there is an interesting peak in the male to female burial ratio roughly during the harvest year 1597–1598, though this does not appear to have been statistically significant within normal parameters.) The picture for 1622–1624 in Figure 8 is more complex: roughly coinciding with the harvest year from autumn 1622 to autumn 1623, there was quite a strong swing towards higher male to female burial ratios, particularly amongst adults. However, following this, and indeed during the crisis's most lethal phase, there was apparently no female mortality advantage. This demands explanation, and incidentally constitutes robust evidence that the missing female burials are not the product of a structural selection bias in the data collection.Footnote 61 These results were then tested by using a chi-square distribution test to compare male to female burial ratios in the pre-crisis period (taken as the 48 months from January 1618 to December 1621) with ratios from the crisis months (October 1622 to May 1624). Overall the male proportion rose from 49.0 per cent before the crisis to 50.3 per cent during, a ‘swing’ that is statistically significant to a confidence level of just over 90 per cent (Table 6): interesting, but hardly dramatic. Amongst adults the swing was considerably more marked: from 46.5 per cent to 48.8 per cent, at greater than 95 per cent confidence.
Burial sex ratios, 1592–1600 (male to female ratio, 7-month moving average). Sources: Parish registers (see Table 1).

Burial sex ratios, 1618–1626 (male to female ratio, 7-month moving average). Sources: Parish registers (see Table 1).

Indexed adult burial sex ratios by region, 1618–1626 (male to female ratio, 7-month moving average). These figures were arrived at by calculating for each region a monthly ratio of male to female burials, then converting this to a ratio against the expected rate (based on the average over 1618–1621). A seven-year moving average was then applied to these ratios. The high male to female ratios found in the northern region for 1625 should be treated with caution, as the figures these are based upon are very small. Sources: Parish registers (see Table 1).

Total burials by sex, 1618–1624

a Comparison with ‘pre-crisis’: * p < 0.05, ** p < 0.01 (chi-squared test).
Source: Parish registers (see Table 1).
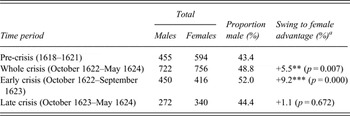
Adult burials by sex, 1618–1624, North (low-child parishes excluded)

a Comparison with ‘pre-crisis’: ** p < 0.01, *** p < 0.001 (chi-squared test).
Source: Parish registers (see Table 1).
Adult burials by sex, 1618–1624, East/South East (low-child parishes excluded)

Source: Parish registers (see Table 1).
Adult burials by sex, 1618–1624, West (low-child parishes excluded)

Source: Parish registers (see Table 1).
There was, however, a clear distinction between the earlier and later periods of the crisis: the burial ratios for the period from October 1623 (i.e. around the time of the 1623 harvest) to the end of the crisis in May 1624 show only a slight, and not statistically significant, difference from the baseline, but those for the harvest year starting in October 1622 show a very marked difference. In total, the burial ratio swung from 49.0 per cent male to 51.2 per cent, which is significant at greater than 95 per cent confidence. For adults, the swing was even more marked: from 46.5 pre-crisis to 50.5 during, significant at greater than 99 per cent confidence. It would appear, then, that there was a female mortality advantage in the famine of 1622–1624, but it was confined to the first 12 months of the crisis; indeed, the second – larger – spike in mortality saw burial ratios at almost exactly their normal level.
Further insight can be gained by looking at burial ratios across the three subregions (Figure 9; Tables 7–9). The observed female mortality advantage was strongest in the northern subregion, where mortality was most severe, but there is also a hint of it in the east/southeast region.Footnote 62 In both cases the female advantage was clearly confined to the earlier part of the crisis, with the peak after the harvest of 1623 seeing burial sex ratios at roughly the base level. In the western subregion, where the crisis was generally less severe, particularly during the earlier part, there was no female advantage; indeed burial sex ratios were not statistically different from those in the baseline period.
7. SEX, STARVATION AND THE CRISIS OF 1622–1624
At the beginning of this article, it was emphasised that studies of modern famines suggested remarkable consistency in the disproportionate mortality of adult males. The question of whether this ‘female mortality advantage’ can be found in the famines of the 1590s and 1620s is clearly quite complicated. Indeed, in a sense, the evidence produced here for female mortality is not especially strong. In the famine of the 1590s this study has not been able to find any robust evidence for any female advantage. In the 1620s, however, there is clear evidence for a female advantage in most of the region, but with two significant qualifications. First, the swing in burial sex ratios was experienced in the first year or so of the crisis but not during its most devastating phase; second, in certain areas, particularly in the West, there was no such swing.
How do we interpret these patterns? As noted above, there are fewer data for the 1590s, so the focus here will be on unpicking the later crisis; in fact, analysis of burial sex ratios, combined with a closer consideration of certain other data, hints at a significant reinterpretation of the nature of the 1620s famine. Before doing this, two key points are worth reiterating. First, existing demographic and medical literature suggests that episodes of widespread starvation should normally prejudice adult males more than adult females; any deviation from this pattern thus requires explanation. Second, the 1620s crisis came in two segments, an earlier crisis in the 12 months after the 1622 harvest with an apparently strong female mortality advantage, and a later, more acute, spike in burials in which sex ratios were normal.
Starting with the question of how to explain the observed female mortality advantage in the first 12 months of the crisis, it should first be noted that, in the 1620s, the greatest fall in baptisms came in the early months of 1624 when the earlier female mortality advantage had evaporated, so it seems unlikely that averted births were the crucial factor. Migration provides a more plausible explanation, as it was often a strategy for young males, potentially increasing their exposure to disease. Indeed, evidence from 1637, also a year of dearth (though not famine), suggests that males made up the majority of itinerants arrested under vagrancy laws.Footnote 63 Thus, migration may have contributed to the patterns discerned not by skewing sex ratios in the total population, but by exposing men disproportionately to disease. Nonetheless, it would require a pattern of temporary male migration, followed by quick exposure to disease, followed by their quick return home (while sick) and death to explain the period of female mortality advantage discovered in 1622–1623. This is possible, of course, but the argument does run into some logical problems. Migration in the region will have run broadly from the poorer North to the richer South. Indeed, many migrants will have pushed on beyond the River Mersey and into Cheshire, where prospects were better still. Migration was, so far as we can tell, a gendered survival strategy: it was something more common amongst males, especially relatively young males. In addition, we can suppose that – given mortality rates of roughly 1 in 20 – the majority of people, even of migrants, did not die during the famine. Added up, this makes certain elements of the observed pattern rather tricky to understand. Why, for example, do we observe the largest proportion of males in the northern parts of the region, when these should have been net exporters of men? Why is the smallest male proportion (during the crisis at least) found in the arable-farming west of the county, which would have been one of the most attractive destinations for migrants in search of work and food? Then there is the question of whether we can really expect sick and hungry men to be returning home in large numbers, especially to the northern parts of the region like Kendal, across some of the toughest terrain in the country.
This is not to say that this pattern of migration, infection, return, then death might not help to understand some of the observed female mortality advantage; indeed, we must also remember the possibility of a flow of migrant males into the region from Cumberland over Dunmail Raise and Shap Summit. But it seems likely, however, not least because of the powerful lessons found in modern studies about gendered famine mortality, that other causes were more important.
One such factor might well actually be an interruption in normal migration patterns. The generally low background male proportions in the northern subregion suggest that it was ‘exporting’ men. Thus, the swing towards female mortality there might reflect either a stopping of this male migration (though again why is there not a corresponding swing in the other direction in the western subregion?), or perhaps a dramatic increase in the number of female migrants from the area (though this would contradict those studies which emphasise male migration in the face of hardship). Another factor, we may speculate, may have related to poor relief. By this point the region was starting to implement a functioning system of poor relief under the terms of the 1601 statute, and this welfare spending may have favoured females.Footnote 64 Of 229 named adult recipients of poor relief in rural south Westmorland in 1637, 45.5 per cent were female.Footnote 65 Those named were almost certainly usually household heads, whereas perhaps 10–20 per cent of all households were headed by females. The evidence for welfare provision in the 1620s is extremely patchy, although Lancashire's quarter session rolls show some attempts at enforcement.Footnote 66 There is, then, a possibility that the emergence of transfer payments under the Poor Law in the 1620s may have advantaged women. In other words, this might help explain the difference between the 1590s and 1620s, but this remains tentative in the extreme.
Thus the most plausible explanation for the female advantage in the 1620s is probably physiological, and this in turn suggests that there was actual starvation. Indeed, this – not to mention the fact that it was most severe in the poorer parts of the region – supports the conclusions of historians such as Appleby and the Rogers group that the 1623 crisis was one of acute undernutrition. Central to their argument was the drop in conceptions, noted above. To this we can add Richard Hoyle's important recent article proving that there was a severe shortage of grain in the North West after the 1622 harvest, and the evidence – noted some time ago by Peter Laslett – of deaths through starvation in the burial register of Greystoke (Cumberland).
But it is what happens after the summer of 1623 that is perhaps most interesting. That this was the period of most acute mortality was pointed out by the Rogers group, and finds ample support from the data above. This peak, combined with the evidence for starvation, has usually led historians to assume that starvation continued and that the 1623 harvest was as dreadful as the two that preceded it. To Laslett, ‘[t]he harvest year 1623–4 was one of bad crops and high prices all over the country: the weather was very nasty’.Footnote 67 Hoyle, meanwhile, whose farm production data fail at just the time of the 1623 harvest and do not begin again until the following autumn, noted the severity of the peak in burials in winter 1623–1624, saying of the 1623 harvest that it ‘brought no relief’ from the agricultural catastrophe of the summer, possibly thanks to wet weather that made it difficult to sow seed.Footnote 68 ‘The famine’, he states, only ‘petered out during the spring and summer of 1624’; indeed, there ‘can be no doubt that in 1622–3 and 1623–4 there was a massive shortfall in the supply of staple foodstuffs’ in eastern Lancashire.Footnote 69
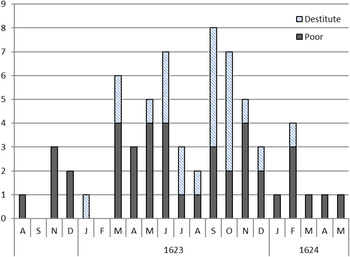
Looking a little closer at the post-1623 harvest period, however, produces some puzzling evidence. First, the index of ‘national’ grain prices produced by Peter Bowden suggests that the price of wheat, barley and oats dipped considerably after the 1623 harvest.Footnote 70 This tallies with the records of the Privy Council: the harvest year beginning 1622 saw orders regulating the grain market across the country, including for grain-rich areas such as Norfolk. For the most part such orders cease after the 1623 harvest, save for one order from December 1623 which notes continuing high prices in the North and South West of England.Footnote 71 This last point is interesting, for while it shows that there were still problems in the ‘highland’ parts of England, and while it remarks that prices were expected to continue rising in the North, it also strongly implies that the situation elsewhere was by then improving; indeed, such was the improvement that in 1624 Parliament actually felt able to relax the laws protecting tillage, which would surely have been politically impossible in the face of continuing dearth. Third, looking again at the Greystoke evidence does at least hint that the problem of actual starvation did not outlast the 1623 harvest.Footnote 72 We can subdivide recorded pauper deaths in Greystoke into those that simply recorded that the individual buried was poor (e.g. widow Elizabeth Elwood, ‘a pore woman who lyved by almes many years’), and those that recorded actual destitution (e.g. Thomas, child of Richard Bell, ‘a pore man which child dyed for verie want of food and maintenance to live’). Using these criteria, there were just three ‘destitute’ burials after October 1623, whereas since the previous October there had been 20 (these data are presented in Figure 10). Moreover, it might also be possible to make a tentative distinction between those simply recorded as destitute at death (e.g. William Robinson, ‘a poore fellowe destitute of all meanes to live’) and those for whom destitution or hunger were recorded as if they were causes of death (e.g. John, son of John Lancaster ‘a waller by trade which childe dyed for want of foode and meanes’, or Leonard, son of Anthony Cowlman ‘which child died for want of food’). All three ‘destitute’ burials after October 1623 were in the former category: in November died Katherine Anson, ‘a poore woman without meanes to live’; in December, Margery Slee, ‘who lived by almes, destitute of other means’; while February saw the burial of Agnes Clemye ‘a poore woman destitute of all meanes to live’. This close linguistic analysis is, of course, problematic, and one would not want to overplay the evidence, but it is intriguing that – on forensic inspection – there is little, perhaps no, unequivocal evidence for actual starvation in the Greystoke register after October 1623.
Pauper deaths in Greystoke (Cumberland), 1622–1624. Source: A. M. Maclean ed., The registers of the parish of Greystoke in the county of Cumberland, baptisms, marriages and burials, 1559–1757 (Kendal, 1911).

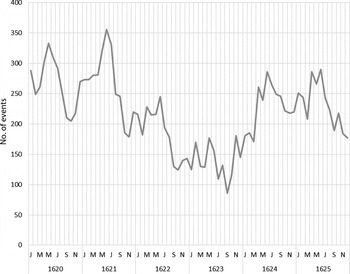
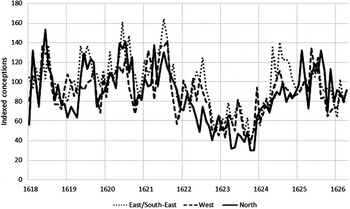
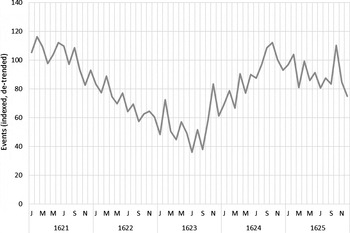
All this does something to peel away the case for starvation after the 1623 harvest, but it can only go so far. Much more convincing is evidence from the demographic record itself. One important point is the quick ending of the crisis in the spring of 1624. Were this a famine, we would expect burials to swell gradually through the year as food supplies dwindled, as – indeed – they did in 1622–1623, only letting up once the new harvest was in. Instead, burials fall away surprisingly quickly in spring 1624. But even more intriguing is the evidence from the baptismal record. It is, of course, well known that conditions of starvation lead to reduced fertility, either as couples consciously decide not to have children, as hunger saps their sex drive, or as undernutrition induces amenorrhoea amongst adult females. Indeed, some commentators – working on poorly documented pre-modern famines – have taken a reduction in fertility rates during a food crisis as prima facie evidence of famine, and – as was pointed out above – there is clear evidence for a drop in conceptions in the North West during both the 1620s crises.Footnote 73 However, it is precisely when that dip occurred that is most curious. Figure 11 charts the raw numbers of conceptions (in reality these are backdated baptisms; we cannot know how many fetuses aborted before coming to term) during the 1620s crisis. Figure 12 shows them indexed and disaggregated by subregion, and Figure 13 shows conception data for the crisis period compared with the same months in non-crisis times, in the same way the death calculations were made. The trajectories of the graphs are intriguing: conceptions were falling after the 1621 harvest, i.e. once food prices started rising but before burials did, and they reached their nadir just before the 1623 harvest. From thence forward, conceptions began to rise: they did not reach pre-crisis levels until around the time of the 1624 harvest, but they were on a rising trend at just the time that mortality was peaking (it is worth noting also that the number of weddings, having troughed in 1622–1623, also began rising at around the same time). The association of the crisis with a collapse in fertility works for the first part, but not the second, most deadly period. Possibly, then, the rising trend in conceptions after the 1623 harvest is telling us that there was a fairly sudden improvement in the availability of food.
Conceptions, 1620–1625 (raw data). Sources: Parish registers (see Table 1).

Indexed conceptions by subregion, 1618–1626 (1618 monthly mean = 100).Sources: Parish registers (see Table 1).

Conceptions, 1620–1625, indexed and compared with monthly norm (1620–1622 = 100). Sources: Parish registers (see Table 1).

There is, then, enough evidence to question whether starvation was the proximate cause of the most acute spike in mortality. If we accept that it was not, then the disappearance of the female mortality advantage around the time of the 1623 harvest is easier to explain: it disappeared because epidemic disease had taken over from direct starvation as the cause of most deaths. The 1620s crisis in the North West was, in some senses, two crises rather than one: there was a serious famine after the 1622 harvest, but the main mortality actually came at just the time that food was becoming more available (although the evidence for a good harvest in 1623 remains tentative; even a poor harvest would have increased the availability of food). This would not be to say there was no hunger in the latter part of the crisis, nor to draw any unhelpfully schematic distinctions between ‘disease’ and ‘famine’. But it might well be that, in the complex reality that always makes up subsistence crises, there was a shift from a situation where brute starvation played the lead role, to one where semi-autonomous disease did. Indeed, the two were almost certainly linked. People moved in search of food, allowing disease to spread. Indeed, this dislocation probably outlasted the most serious food shortages: large numbers of itinerants and strangers are found in the burial registers well into the winter of 1623–1624 (although this remains to be quantified), and there was an unusually high number of thefts prosecuted by the constables of Manchester that winter.Footnote 74 It is a familiar pattern of social disorder touched off by famine: it took time for things to normalise, and in the meantime disease almost certainly continued to exact a heavy price.
8. CONCLUSION
This essay has focused on exploration rather than explanation: we need to know whether early-modern England replicated the modern experience of female mortality advantage during famines before we can ask ourselves why this happened (or did not happen). In fact, the evidence for a strong swing towards a female advantage is not – perhaps – as strong as some modern studies would suggest we should expect. Nor is there any evidence of female advantage in the 1590s crisis. This said, it does seem that there was at least one period of female mortality advantage during the crisis of the 1620s, which was particularly severe in the north of the region, and it is possible to hypothesise about the reasons behind it. The timing of the drop in baptisms suggests that averted births were not the key factor. Migration patterns remain largely unknown, but it is possible that the swings detected could reflect either a reduction in the outflow of males from parts of the region, or an equalisation of previously skewed migration patterns due to increasing female migration. Poor relief patterns in which transfer payments prioritised women may also offer part of an explanation again, but this is speculative in the extreme. It does seem that the physiological vulnerability of males to starvation offers the most obvious reason for the observed patterns, but again this conclusion must remain tentative. Potentially most significant, indeed, is the change between the early part of the 1620s crisis (roughly the first 12 months after the 1622 harvest), and the later part (late autumn 1623 to spring 1624). As suggested above, there are good reasons to suppose this reflects an early crisis of starvation, followed by a later one in which food was becoming more available, but disease had become epidemic. If this is a correct interpretation, then it would imply that a partial easing of pressure on the food supply was no guarantee of an end to the mortality crisis.
ACKNOWLEDGEMENTS
The author would like to thank the reviewers for Continuity and Change for their extremely helpful comments on this paper. (Very) early versions of this research were presented at the Universities of Sheffield and Oxford in 2008. The maps were produced with the kind help of Michael Athanson of the Bodleian Library.