Introduction
By all accounts, urban agriculture has captured the attention of many people, including city residents, hopeful beginning farmers, city governments, urban planners and nonprofit organizations. Likely spurred by a growing awareness of synergies among the environmental benefits of an urban lifestyle, healthy food and sustainable farming, the burgeoning interest has resulted in a recent incorporation of agriculture into city land use plans around the nationReference Morgan 1 – Reference Pothukuchi and Kaufman 4 . The new enthusiasm in the United States is a stark contrast to the decades-old reliance on urban agriculture in developing countries, where urban farms have long been an important source of food for the urban poorReference Drescher 5 – Reference Van Veenhuizen 9 . Although the primary impetus for farming in cities in developing countries is food security, the motivations for farming in US cities are greater in number and wider in scope. Urban agriculture in the USA, it is said, not only enhances food security, but also supports the development of local and regional food systems, reduction of food waste, community building, open green space in cities and higher property values 10 , Reference Heumann 11 .
Cities present numerous obstacles to urban farmers, but access to land may be the most pressing. A limited supply of vacant land has contributed to high land costs in many cities, also referred to as the urban core, leaving farmland out of the reach of many would-be urban farmers. In high-cost cities, high land prices may be driving some farmers to secure land outside of the city, in peri-urban areas, where land might still be expensive, but is likely to be less costly than in the urban core. In other cities, abundant vacant land, particularly in the Rust Belt, has given rise to lower land costs. Such cities may have great potential for expanding farming in the urban core, given the ample supply of unused or abandoned land, including space on rooftops. However, land access is just one obstacle faced by urban farmers. Once land is secured, urban farmers often lack access to credit, face lack of municipal support for composting, lack access to water and an unfriendly set of regulations such as zoning, city plans and building codes that were not designed with farming in mindReference Kaufman and Bailkey 12 , Reference Brown and Carter 13 .
But even if farmers find affordable land, and successfully tackle the regulatory framework, gaining access to consumers willing to buy their product is essential. However, many urban and peri-urban areas lack infrastructure for marketing and processing food raised on their farms. Along this line, given that urban and peri-urban farmers are unable to take advantage of scale economies in production, their food will likely be relatively more costly. Thus locating near consumers willing and able to pay a premium for their production might be important to the viability of the urban farm. Urban and peri-urban farms are likely to be similar to farms located on the rural/urban fringe, which are dependent on high prices for long-term viabilityReference Batie 14 , Reference Heimlich 15 .
To date, the bulk of research regarding urban farming in the United States consists of case studies of different urban farming businesses in cities such as New York, Detroit, San Francisco, Vancouver, Seattle and Portland (see for exampleReference Kaufman and Bailkey 12 , Reference Brown and Carter 13 , Reference Quon 16 ). A central finding of the existing literature is that urban farming in the USA is multi-dimensional, and as such, appears in many forms and places. For example, farms are located on roofs or on the ground; may use greenhouses or hoop houses; and food is produced in soil or hydroponicallyReference Kaufman and Bailkey 12 . Another observation is that many urban farms are nonprofit enterprises, where the primary goal is not providing food but instead they are concerned with a socially-minded goal, such as job training or providing an education to specific stakeholder groups about farming or healthy food. Nonprofits are disconnected from the market, depending on revenues from sources other than the sale of food. This alternative source of revenue effectively eliminates the need for marketing the food produced on the farm.
The literature has not yet incorporated a systematic analysis of whether urban farming has extended beyond a compelling concept into the practice of farming in the city and peri-urban areas. A fundamental question, and the starting point of this paper, is what constitutes an urban farm, and how the definition fits into our understanding of farms in general. We consider farms in the urban core as well as those in the peri-urban areas in the analysis presented in this paper. Crucial questions related to understanding the extent of urban farming include a basic analysis of where the farms are located, and how much is located in the urban core versus the surrounding peri-urban areas. The second is which agricultural products are grown on urban and peri-urban farms. Lastly, have the patterns of production in urban and peri-urban areas changed as the interest in urban farming has increased? The research presented in this paper provides insight into the first two questions, and discusses obstacles to addressing the last question.
Methods
What constitutes an urban farm?
Accounting for the number of urban farms, their location and the products raised is stymied by several factors. Perhaps the most basic is what constitutes an urban farm. Agricultural activity occurs in most cities and the surrounding counties, and the range of activities includes community gardens, commercial farms, school gardens and educational facilities. The stated goal of some urban agricultural operations is the production of food, while, for others, raising food is secondary to socially minded missions that include building community, raising awareness about food, and reconnecting with farmers and food. One pressing aspect is how to classify these different types of agricultural activity in cities, specifically, which operations should be considered ‘farms’. In particular, the presence of about 18,000 community gardens in the USA and Canada suggests many perceive benefits from community gardening, but whether these gardens should be classified as farms is not clear 17 . One difference between a community garden and a farm is that the production of community garden is meant for home use, whereas farm output is intended for the market. And even if it is decided that community gardens, along with other non-commercial farms, should be counted, there are no data describing the locations, size and production of such entities.
The critical question underpinning the assessment of urban farming is whether the operation, to be considered an urban farm, needs to both grow and sell food, and whether the farm's main purpose is the production of food. Along this vein, does being a farm mean that the operation's main source of revenue results from sales of food? Further, is there a minimum threshold of production or farmland that must be met before a plot of land can be considered a farm? In combination with the evidence suggesting that urban agriculture might be mainly concerned with social goals, the lack of precision in the definitions of ‘urban agriculture’ and of ‘farms’ provides little guidance for analysis. One definition, according to the US Department of Agriculture, is ‘to establish and perform an agricultural practice in or near an urban or city-like setting’.Reference Adeyemi 18 The United Nations’ states that urban and peri-urban agriculture is farming in and around cities that competes with other activities for resources such as land, water and energy 19 . A recent 16-city study, conducted by Turner Environmental Law Clinic, defined urban agriculture as the production of food crops and raising of animals for the purpose of feeding the local populationReference Goldstein, Bellis, Morse, Myers and Ura 3 . The City of Chicago ties the definition of urban agriculture to the market, and states that urban farms are those that grow food with the intention of selling it, nonprofit or commercial, and thus require a business license 20 .
Census data and spatial methodology
Although the definitional questions appear simple, or perhaps tangential, it helps to recall that both the US Census Bureau and Department of Agriculture have struggled with the definition of a farm since 1840, when the census enumerators began collecting data on agriculture in the United States. In 1880, the language defining a farm specifically excluded potato patches and family vegetable gardens 21 . In 1920, the definition of a farm was a plot of land that was 3 acres or larger, or a smaller plot of land that generated sales of $250 or more 22 . The current definition is that a farm is an entity that produces and sells, or would have sold, at least $1000 worth of agricultural products during the year the census is conducted 23 . Applying the current definition to the existing pattern of agricultural activity in cities and the peri-urban areas—community gardens, commercial operations and educational facilities—is likely to exclude community gardens, very small commercial farms and nonprofit farms with no sales.
The analysis relies on data from the Census of Agriculture (currently conducted every 5 years), which provides the best measure of the extent of farming around the USA. The goal of the census is to include every farm that meets the inclusion criteria, regardless of where it is located, what it produces or its size; all registered farms automatically receive notification of the survey. Farmers can be added to the list frame for an upcoming census by filling out an online form with their farm information. State-level departments of agriculture and other farm organizations actively engage in outreach to new farmers, with the goal of encouraging all eligible organizations to fill out the survey. That said, it is difficult to ascertain how many new farms actually take the step to be included in the census.
The analysis makes use of the 2007, and in some cases, 2002, census data collected by the USDA, which includes the number of farm operations and products raised. Publically available data are at the county level, which was aggregated to the Metropolitan Statistical Area (MSA) level. The MSAs consist of the urban core and peri-urban areas, and in some areas, may include some counties that are more distant than those surrounding the city; given that the publically available data are available at the county, state and national levels, this approach was deemed as the most reasonable to capture the activity associated with urban and peri-urban farming. The analysis begins with the 50 most populous MSAs. Subsequent views provide a deeper view of the MSAs in the Northeastern region, and then focus specifically on select MSAs with significant spatial patterns of urban farms.
Spatial techniques form the basis of the analysis, and GIS-generated mappings were created in order to gain a perspective of urban and peri-urban farming in context of the entire farm sector. Next, statistical tests of the presence of spatial ‘clusters’ of farm operations in a locality were performed. The most widely used measure of clustering is Anselin's Local Indicator of Spatial Association (LISA), which is a spatial analysis tool used to identify local spatial clusters of features. Using counties as the observations and farm operations as features, the tool standardizes the feature values and creates a spatial weight for each observation based on the number of neighboring farms. These values are placed within two matrices that are multiplied cell by cell and summed to provide an index from which the Z statistic and p-value are determined. Counties are classified as high–high (HH) if their farm numbers are similar in number to their neighbors and are significantly higher than the average of all counties. Counties are considered low–low (LL) if their farm numbers are similar in number to their neighbors and significantly lower than the average of all counties. High–low (HL) and low–high (LH) indicate outliers, meaning that these counties have farm numbers different from their neighbors and significantly higher or lower numbers, respectively, than the average of all countiesReference Anselin 24 .
Results: Spatial Analysis of Farms and Products Grown
Of the total US land in 2007, less than 3% was devoted to urban use. About one-half of total land was considered agricultural, with 80% of this counted as ‘land in farms’.Reference Nickerson, Ebel, Borchers and Carriazo 25 Agricultural production is specialized by location in the United States: for example, California and Florida produce most of the fresh vegetables raised in the USA; California, Florida and Washington produce most of the fresh fruit; corn production is concentrated in the Heartland states; and soybeans in the Upper Midwest 26 – 29 .
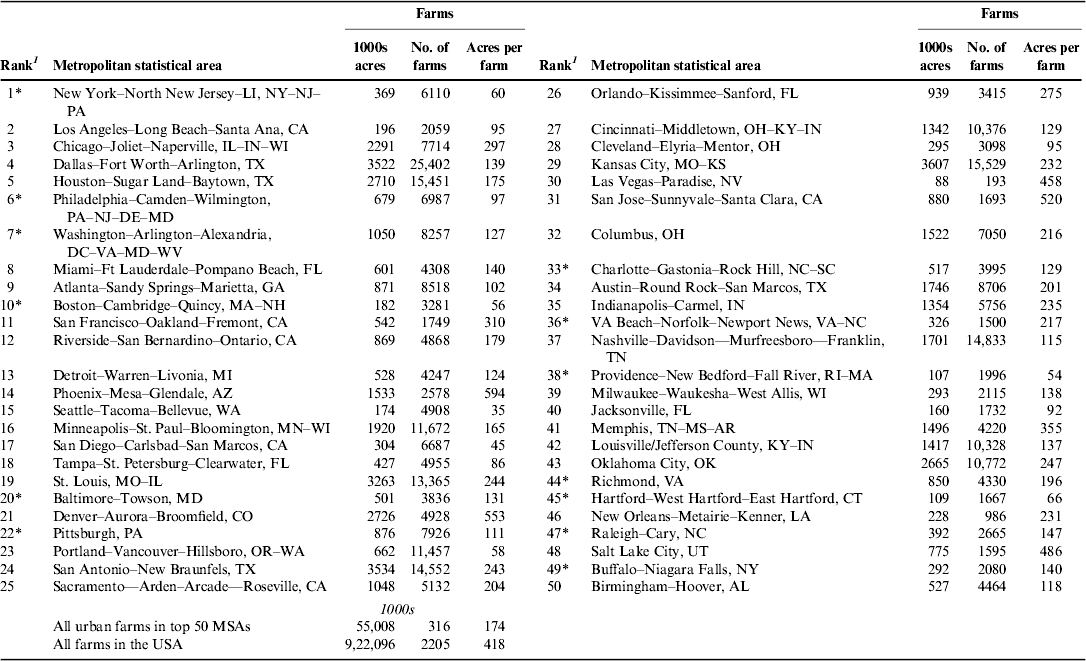
The amount of farmland and the number of farms in the 50 MSAs under study comprise a small portion of the total farm sector in the United States. Just 6% of farmland and 14% of farms were located in the top 50 MSAs during 2002 and 2007 (see Tables 1 and 2). Note that the amount of farmland in the 50 MSAs, considered as urban and peri-urban in this analysis, is sizably smaller than the farmland at the rural–urban interface, which encompassed 40% of the farmland in the United States in 2002Reference Jackson-Smith and Sharp 30 . Urban and peri-urban farms tend to be smaller, as well. In 2007, the national average farm size was 418 acres. Farms located in the urban and peri-urban areas were, at an average 174 acres, about 40% of the size of all farms in the United States. The farms in MSAs located in the eastern third of the country are smaller, and have fewer acres of farmland.
Farmland, number of farms and farm size: 2002 by top 50 MSAs.

Source: Authors’ compilation of data from Census of Agriculture, 2002.
1 Rank in terms of population. The MSAs with an asterisk are those included in the Northeastern region.
Farmland, number of farms, and farm size: 2007 by top 50 MSAs.

Source: Authors’ compilation of data from Census of Agriculture, 2007.
1 Rank in terms of population. The MSAs with an asterisk are those included in the Northeastern region.
Spatial distribution of farmland and farm operations
Farming in the urban and peri-urban areas differs from farming in the entire country in several significant ways. First, while the bulk of farmland and farm operations are located outside of the most populous MSAs in the country, the two regions overlap in portions of the country (in particular, the regions west of the Mississippi River and in Florida, Figs. 1 and 2). One implication of the smaller size of urban farms is apparent in the maps, which suggest that the ratio of farms to farmland is larger in the urban areas, particularly those in the eastern third of the USA.
Farmland in the USA and the 50 most populous MSAs: 2007. Source: Authors’ representation of data from Census of Agriculture, 2007.

Farm operations in the USA and the 50 most populous MSAs: 2007. Note: The MSAs under study are highlighted. Source: Authors’ representation of data from Census of Agriculture, 2007.

Conceptually, if urban and peri-urban agriculture has been increasing to significant levels, clusters of farmland or farm operations should be discernable in local urban and peri-urban areas. Although clustering might be expected in both the farmland and farm operations, the small size of farms in the MSAs under study suggests that the intensity of urban and peri-urban farming might be best measured via the number of farms. The census data provide a sense of shifts toward farming in the urban and peri-urban areas between 2002 and 2007: while there was a decline in the total amount of farmland in the top 50 MSAs from about 58 million acres to 55 million acres, the number of farms increased from 312 to 316 K (Tables 1 and 2). Thus, the trend suggested by the census data also suggests that identifying whether urban and peri-urban agriculture has reached measurable levels is best examined through the number of farms. That said, isolating urban farming is challenging because some of the MSAs under study are in areas that are traditionally agricultural. In addition, there is a significant amount of blurring between urban and rural lands as farmland is converted into other uses, particularly along the urban–rural fringe. Thus, in order to best identify locations that possess higher than expected levels of urban and peri-urban farming, the analysis focuses on the Northeast, which is less intensively agricultural relative to traditional farm regions.
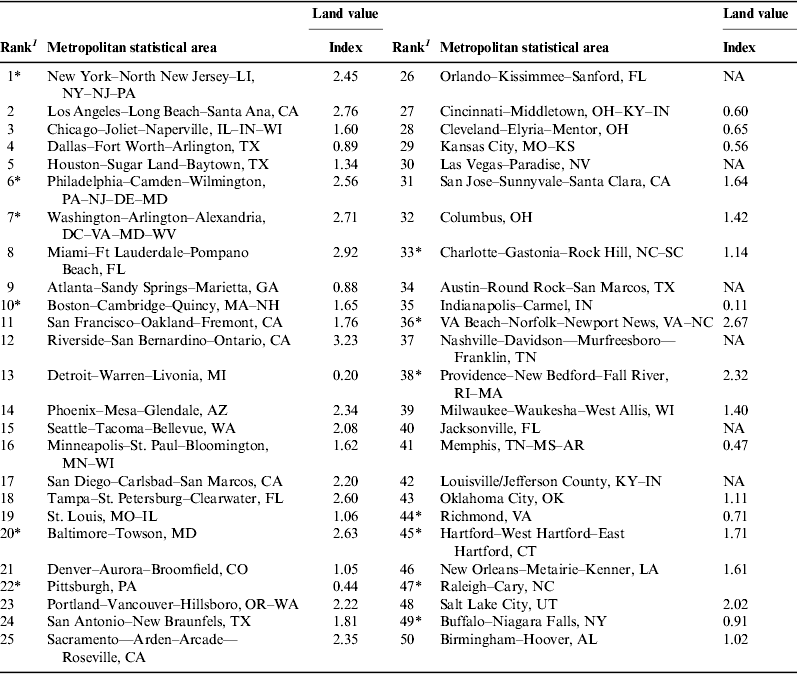
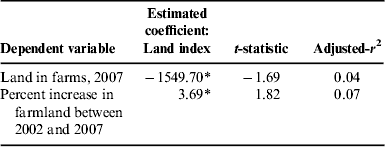
Although many factors are critical for a farm to be operational, land (on the ground or a rooftop) is the most crucial. Land availability can be approximated by the land value index calculated by researchers at the Lincoln Land Institute (see Table 3). Lower land values prevail in urban areas with large amounts of vacant land (such as Cleveland and Detroit), where the index is below 1, while land is more costly in MSAs with few vacant parcels (such as New York and Los Angeles), where the index is above 2. One hypothesis is that in areas with higher land prices, fewer acres of land will be used for farming. A least squares regression, where the land value index is the explanatory variable, suggests that amount of farmland in 2007 is lower in and near cities with higher land prices (see Table 4). Note that this simple model only partially explains the variation in farmland around the USA, but it is suggestive of general patterns. However, because the urban and peri-urban farming movement is relatively recent, changing land use is of interest as well, perhaps even more so. In this case, the regression suggests a positive, statistically significant relationship between the land value index and the change in urban farmland between 2002 and 2007. In other words, (1) increases in farmland are positively related to land values, meaning that between 2002 and 2007, farmland increased in MSAs with high land values, and (2) in 2007, the absolute amount of farmland is negatively related to land values, so that lower quantities of farmland are present in MSAs with higher valued land. The findings lend suggestive support toward the anecdotal evidence purporting that urban farms are proliferating in dense urban environments.
Land values, 2007 by top 50 MSAs.

Source: Lincoln Institute of Land Policy, http://www.lincolninst.edu/subcenters/land-values/metro-area-land-prices.asp.
1 Rank in terms of population. The MSAs with an asterisk are those included in the Northeastern region. NA means not available.
Relationship between farmland trends in the top 50 MSAs and land values.

Note: The independent variable in both equations is the land index value. *Indicates significance at the 5% level. N=40.
Spatial cluster analysis of farm operations in the Northeast
The spatial analysis starts by focusing on the Northeast, to identify hot-spots of urban farms. Different levels of clustering of farms were uncovered, ranging from no significant clustering to significant HH clusters (see Fig. 3). One region with significant clustering of farms is located in the Pittsburgh MSA (Westmoreland, Fayette and Washington counties). Counties with fewer farms surround Washington county in the southwest corner of the MSA, indicating that more farms are located within the metropolitan area than outside. This could be a function of the relatively low land values within Pittsburgh, due to stretches of vacant land within the cityReference Butcher, Cristiani, Davidson, Ngo, Rosenthal, Wildfire and Zamarripa 31 . The Philadelphia–Camden–Wilmington, Baltimore–Towson and Washington–Arlington–Alexandria MSAs border a cluster of significantly high numbers of farms. As noted above, high numbers of farms bordering these metropolitan areas (with clusters extending into Chester County, PA; Carroll County, MD; and Frederick County, MD just within their respective MSAs) could be a function of relatively high land values within Philadelphia, Washington DC and Baltimore.
Anselin's Local Indicator of Spatial Association (LISA) of farm operations in Northeast USA: 2007. Source: Authors’ representation of data from Census of Agriculture, 2007.

Clustering of significantly low numbers of farms was found in the New York–Northern New Jersey–Long Island MSA (Westchester, Nassau, Rockland, Kings, Queens, Bronx and Richmond counties in NY and Passaic, Bergen, Essex and Union counties in New Jersey) and along the coastline in the Richmond (New Kent, King and Queen, King William, Charles City, Richmond and Prince George counties) and Virginia Beach–Norfolk–Newport News (Currituck County, NC and Gloucester, James City, Mathews, York, Surry and Isle of Wight counties in VA) MSAs. The clustering of farms (labeled LL in Fig. 3) in the Richmond and Virginia Beach MSAs suggest few farming operations within the majority of the metropolitan area. This result is expected as this area is not a traditional agriculture area and there has not been major interest in farming, particularly in comparison to other metropolitan areas such as Portland, San Francisco, Kansas City, Seattle, Milwaukee and Chicago.
The cluster analysis suggests that metropolitan areas with relatively higher land values tend to contain clusters of fewer farms than areas with lower land values. Additionally, clusters of fewer farms in areas with lower land values occur in areas where there has not been a noticeable interest in urban and peri-urban farming. Note that while land values are an important factor that potential urban and peri-urban farmers face, other factors matter as well, and support of local jurisdictions, marketing infrastructure and zoning policies influence the feasibility of urban and peri-urban farming. Thus, while farming appears to be increasing in urban areas with higher land values in general, spatial analysis of farm clustering in the Northeast is suggestive of obstacles to land access, which likely include land price barriers.
Spatial cluster analysis of urban and peri-urban farms within cities
Examining clustering of farms at the county level within the top 50 MSAs provides insight into farming activity in the most populous areas of the USA. However, each MSA comprises multiple counties that are a mixture of urban, peri-urban and possibly rural areas. Therefore, in order to determine where farm operations were located based on 2007 census data, it is helpful to look more closely at the most populated cities within each MSA. City limits were added to four MSAs with significantly high clusters of farms (Pittsburgh, Philadelphia, Baltimore and Washington DC MSAs) to distinguish the urban core from the peri-urban area (see Figs. 4 and 5 below).
Local clustering of farm operations, Pittsburgh MSA with city limits: 2007. Source: Author representation of data from Census of Agriculture, 2007.

Local clustering of farm operations, Philadelphia, Baltimore and Washington DC MSAs with city limits: 2007. Source: Authors’ representation of data from Census of Agriculture, 2007.

The maps include cities with populations over 10,000, broken down into three categories, 10,000 to 35,000 residents; 25,000 to 250,000 residents, and more than 350,000 residents. Clusters of farms were not found within the urban core in any of these four metropolitan areas. There was some overlap of the peri-urban area with counties containing high numbers of farms in all metropolitan areas, but the overlap covers a relatively small area of these counties. This suggests that the majority of farming operations within these metropolitan areas are located in the peri-urban area surrounding the most populous cities. This observation can be explained by several factors, including high land values, a lack of large tracts of available land and other regulatory factors specific to the city.
Types of products grown on farms on MSAs in the Northeast
The products raised on urban and peri-urban farms are likely to be those that can be produced on relatively small plots of land. For example, because of the need for a sizeable amount of land for grazing, beef cattle would not be suitable, nor would a crop such as corn or wheat, which relies on mechanical equipment that is scaled toward very large farms. Products such as vegetables, eggs or goats would be feasible to raise on urban and peri-urban farms, given the high value of their output in addition to the ease of scaling down to a relatively small farm size. These products are highly valued, which is important for farmers raising food in a relatively expensive environment. Such output is likely to be marketed to consumers who are not too distant from the farm, who are interested in purchasing local or regional foods.
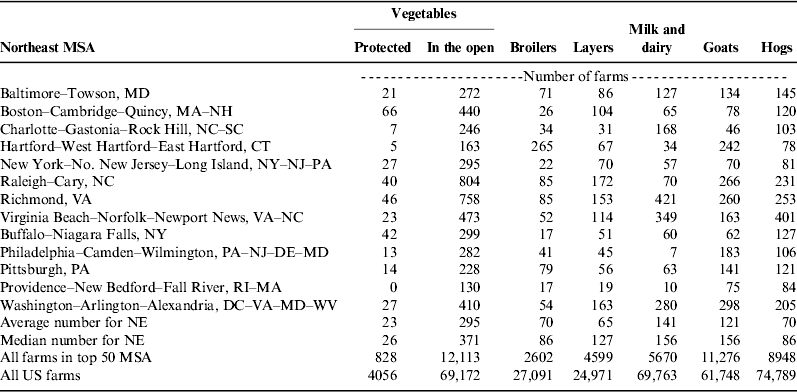
The peri-urban and urban farms located in the Northeast are small, averaging 118 acres, with size ranging from a low of 54 in Providence, RI to a high of 147 in Raleigh-Cary, NC (Table 1). Although most agricultural products are represented on the northeastern farms, the dominant products are vegetables in the open (as opposed to in greenhouses) and goats (Table 5). A surprisingly large number of northeastern farms raise hogs, but these farms are concentrated in Southern Virginia and North Carolina, which is traditional hog-raising country and has many large hog confinement operations. The relatively small number of farms that raise vegetables under protection, such as greenhouses and other protected cultivation systems, is unexpected, although the Boston and Philadelphia MSAs have a relatively large number of farms raising vegetables in protected systems.
Number of farms, by product raised, in Northeast MSAs: 2007.

Source: Authors’ compilation of data from Census of Agriculture, 2007.
The greater tendency of urban and peri-urban farms to produce vegetables, goats and eggs, in comparison to farms in rural areas, as hypothesized, is supported by the data. Farms, across the nation, were more likely to produce hogs, broilers and dairy products, and less likely to raise goats and vegetables in the open (Fig. 6). The share of farms in the Northeastern MSA producing vegetables, goats and layers exceeds the relevant shares for the entire farming sector. These products, as well as their related value-added products, such as goat's cheese, tend to be high value. Note that while the data support the presumption that urban and peri-urban farms would produce eggs more often than the farms across the nation, relatively few northeastern farms produce layers (Table 5).
Relative share of farms, by type of product, in the Northeast MSA and the USA, 2007. Source: Authors’ calculations of data from Census of Agriculture, 2007.

Spatial cluster analysis of goat and vegetable operations in the Northeast
The spatial analysis starts by focusing on goat and vegetable farms in the northeastern MSAs, to identify hot-spots of urban farms. The levels of clustering uncovered differed between the two types of farms. For vegetables produced in the open, just two levels of clustering were identified: clusters were either not significant or consisted of significant HH clusters. Vegetable farms were clustered along the boundaries and partly within the Philadelphia, Hartford, Baltimore, New York and Boston MSAs. Additionally, HH clusters of vegetable farms were uncovered in the Buffalo MSA, which was one of the first cities to actively welcome urban farming (Fig. 7).
Interestingly, clusters of vegetable farms were found surrounding and just inside the Providence, Hartford, and Boston MSAs, where no significant clustering of farm operations was previously found. This indicates that total farms in this area are not high relative to the entire Northeast, but vegetable farms are. This reflects the relatively early adoption of urban agriculture policies and nonprofit activity around city growing in this area. There is also greater clustering of vegetable farms within the urban areas and urban core of the Philadelphia MSA compared to total farm clusters. This is consistent with the anecdotal evidence suggesting that Philadelphia has a long history of citizen-led city farming efforts, and remains a hot-spot despite the decline in the total number of urban farms in recent years.
Anselin's Local Indicator of Spatial Association (LISA) of vegetable operations in Northeast USA: 2007. Source: Authors’ representations of data from Census of Agriculture, 2007.

The spatial patterns of goat farms exhibit a complete range of clustering, from not significant to HH, HL and LL significant clusters (Fig. 8). The location of the clusters suggests that few spatially significant patterns of goat farms exist in the northernmost parts of the region. The significant HH clusters are concentrated in two regions—surrounding the Philadelphia and Baltimore MSAs and the southernmost portion of the region, in the Carolinas. Comparing the clustering of goats to the clustering of total farm operations in the Carolinas, it is evident that while there are not a large number of farm operations in the metropolitan area, there are a relatively large number of farms raising goats. On the other hand, the peri-urban areas surrounding the Philadelphia, Baltimore and Washington DC MSAs maintain a similar pattern to total farm and vegetable operations. This implies a greater variety of high-value products grown in the area. Weather patterns in the Carolinas also help explain clustering patterns in the area as goats tend to do poorly in very cold or very hot climates. The HL clustering of goat farms in Washington County, PA provides insight into what is being grown in the western part of the state. Given the lack of clustering of vegetable farms within the MSA, it is unclear what the farms throughout the rest of the MSA are growing or raising.
Anselin's Local Indicator of Spatial Association (LISA) of goat operations in Northeast USA: 2007. Source: Authors’ representations of data from Census of Agriculture, 2007.

Discussion: The Face of Urban and Peri-Urban Agriculture in the USA
Urban agriculture in the United States is difficult to categorize for several reasons, and the difficulties begin at the most basic level of assessing exactly which activities should be counted. Urban agriculture takes many forms, and self-identified urban farms have varying goals. Some operations growing food are community gardens providing food directly to those working in the garden or donating food to a local food bank, and others are organizations providing educational opportunities for those interested in learning to farm as well as selling produce at a reduced price in low-income neighborhoods. Others are primarily focused on raising awareness about farming. Still, there are urban and peri-urban farms with the primary goals of raising food for sale, with no socially minded mission. The approach taken in this paper—that of reliance on publically available census data to characterize the urban and peri-urban agriculture – automatically excludes many operations that self-identify as urban farms.
The Census of Agriculture reports data on farm operations, products raised and so on, at the national, state and county levels. This makes a systematic study of agriculture strictly in the urban core difficult, as many counties include a large area that extends beyond the urban core. The MSA is not the only approximation of urban and peri-urban agriculture, but using a different definition would require making a set of subjective judgments. The concept of urban agriculture embodies numerous exceptions to traditional commercial agriculture, which makes it difficult to describe the state of urban agriculture based on the census alone. That said, this examination of the census data on farms and farmland in the 50 largest MSAs in the USA provides the best possible systematic glimpse into the growing trend of farms in urban areas.
The spatial analysis of farm operations highlights a relationship between the extent of urban and peri-urban farms and land values. This becomes especially clear through the spatial analysis focusing on farm operations in the Northeast, which revealed clusters of farms within metropolitan areas with relatively low land values and clusters of fewer farms in areas with relatively high land values. The closer perusal of MSAs with clusters of farm operations showed farming taking place mostly in peri-urban areas rather than the very populated cities within these metropolitan areas. This, again, could be a function of high land values and lack of government support, until recent years, for growing in cities. The census also allows a characterization of the farms operating in the urban and peri-urban regions of the 50 largest MSAs. The farms are relatively small, and produce crops and value-added products that are often of high value, such as eggs, vegetables and goats.
In terms of size and products raised, the urban and peri-urban farms identified in this study are similar to the often studied small and medium farms. As is well known, these farms struggle to find a niche in the marketplace, and have been declining in number since the 1950s. The analysis suggests that urban and peri-urban agriculture may hold some promise for these farms: while the total amount of farmland declined in the top 50 MSAs between 2002 and 2007, the number of farms increased. Further, the analysis suggests that farmland increases are positively related to land values, which may be promising in terms of enhanced farm viability; presumably, these areas are populated with consumers willing to pay enhanced prices for products that are locally or regionally produced.
Since the time of the 2007 Census, many jurisdictions adopted policies promoting healthier food systems or actively supporting urban agriculture. The policies typically took the form of a government food policy council, a food system plan or other promotion of urban farming, which might include changing zoning or other aspects into order to facilitate the development of urban farms. In other cases, support for food system development comes through community food policy councils, local urban farmers or nonprofit organizations. Note that one limitation to directly incorporating the impact of policy on the extent of urban agriculture into this analysis is that many local and state jurisdictions did not implement policies supporting urban agriculture until 2009 or later. That said, stronger results regarding the development of urban agriculture might be obtainable using data from the 2012 Census, which was not available at the time of this writing.
The census data provide a baseline view of farms and farmland that meet the USDA definition of a farm, and illuminate several patterns of spatial clustering as well as suggestive evidence that farming in the urban core and peri-urban areas is on the rise. One of the likely causes for the discerned patterns of spatial clustering includes land values. However, given the growth in the amount of farmland in areas with high land values, which are often densely populated areas, a possible explanation for the growth in the number of farms is local interest in urban farming. It is quite likely that, all else being equal, such interest may provide an environment that facilitates development of urban and peri-urban farms. Once the 2012 Census is available, it will be possible to take a deeper view of the effect of local and state policies, which tend to follow citizen interest and collective action, on urban and peri-urban farming.
Acknowledgements
Funding for this research was provided by the National Institute of Food and Agriculture, Agriculture and Food Research Grant no. 2012-68006-30177.