I. INTRODUCTION
Long-lasting phosphors have experienced more than 100 years of development, from sulfides to aluminates and then to silicates. As novel functional materials, the rare earth-doped long afterglow phosphors attract increasing attention in recent years for their wide applications in emergency light, traffic signs, multidimensional optical memory, luminous paint, etc. Due to their excellent performance in luminescence intensity, afterglow time, and chemical stability, many blue and green afterglow phosphors of silicates and aluminates are commercially available, while the red and yellow long-lasting phosphors are still in a relatively backward situation. Especially, the present yellow afterglow phosphors are far away from practical application for their weak luminescence intensity, short afterglow duration time, and bad chemical stability.Reference Blasse and Grabmaier1–Reference Li, Wang, Xu and Gong7
Recently, Sun et al.Reference Sun, Zhang, Luo and Wang8 reported a new yellow-emitting phosphor Sr3SiO5: Eu2+, Dy3+ with broadband emission peaked at 570 nm, of which the afterglow can be observed for several hours in darkness after removal of the excitation source. Unfortunately, the brightness and persistent time cannot satisfy the practical application yet. In this work, the luminescence intensity and afterglow time of the Sr3SiO5: Eu2+, Dy3+ phosphor are effectively improved with introduction of alkaline earth metal fluorides. It shows that the density of trap at different depth for the phosphor can be adjusted, making the afterglow properties tunable.
II. EXPERIMENTAL
All the powder samples were prepared by high-temperature solid-state reaction. Analytical reagents SrCO3, SiO2, CaF2, SrF2, BaF2, Eu2O3, and Dy2O3 were used as raw materials. The nominal concentrations of Eu2+ and Dy3+ were 1% and 3%, respectively, while the content of the alkaline earth fluoride varies from 0% to 15% in mole. Raw materials weighed at designed stoichiometric ratio were ground into fine particles and sintered at 1300 °C for 4–6 h in a weak reducing atmosphere. Then, the samples were quickly cooled to room temperature with a rate of 20 °C/min.
The crystalline structure of the samples was examined by x-ray diffraction (XRD), using a D8 Advance x-ray diffractometer (Bruker AXS, Karlsruhe, Germany) ranging from 10 to 75 °C. The photoluminescence (PL) and decay curves were measured with a Hitachi F-4500 spectrophotometer (Hitachi Ltd., Tokyo, Japan) with Xe lamp as the excitation source at room temperature. Before the afterglow measurements, the sample was exposed to 365-nm light for 10 min. Then, the time-dependent afterglow was measured with a ST-86LA luminance meter (Photoelectricity Instrument Factory of Beijing Normal University, Beijing, China). The thermoluminescence (TL) curves were recorded by a Riso-TL/OSL DA-15B/C dosimeter (Risø DTU-National Laboratory for Sustainable Energy, Roskilde, Denmark) with a heating rate of 5 K/s in the range of 273–600 K.
III. RESULTS AND DISCUSSION
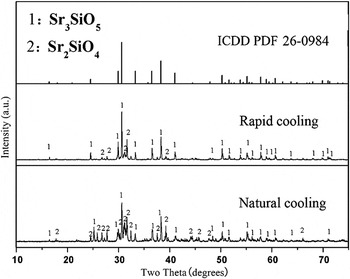
The XRD patterns of Sr3SiO5: Eu2+, Dy3+ phosphors prepared by rapid and natural cooling processes are given in Fig. 1. The Sr2SiO4 phase appears in both rapid and natural cooled samples. However, rapid cooling treatment can reduce the relative content of Sr2SiO4 on the basis of the XRD intensity comparison between the Sr2SiO4 and Sr3SiO4 phases. It is believed that there is a structure transformation from Sr3SiO5 to Sr2SiO4 at 1300 °C in the process of the reaction and Sr2SiO4 phase forms below 1300 °C.Reference Hsu, Sheng and Tsai9, Reference Nakamura, Watari, Torikai and Yada10 Thus, when the samples are cooled to room temperature naturally, relatively high content of Sr2SiO4 and other silicates are inevitable. However, the rapid cooling treatment can prevent the transformation effectively and thus improve the impurity of the final product.Reference Cheng, Liu, Cheng, Lu and Qiu11
XRD patterns of Sr3SiO5: Eu2+, Dy3+ phosphors prepared with rapid and natural cooling processes.

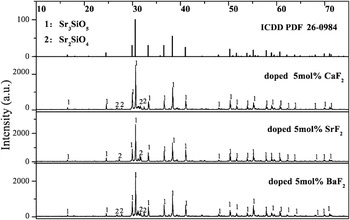
The XRD patterns of synthesized Sr2.95SiO5: Eu2+, Dy3+, 0.05 MF2 (M: Ca, Sr, Ba) phosphors with rapid cooling treatment are shown in Fig. 2, which indicates that most of the peaks for the tested samples agree well with standard ICDD Card No. 26-0984 for Sr3SiO5. Although the Sr2SiO4 phase is also found, its content drastically decreases comparing with the naturally cooled sample based on the XRD intensity of the two phases. Moreover, no emissions ascribing to Eu or Dy ions in Sr2SiO4 are found in the next spectroscopy test, meaning that the impurity Sr2SiO4 phase has no obvious influence on the luminescence of Sr3SiO5.Reference Lakshminarasimhan and Varadarajtt12 At the meantime, the addition of Eu2+ and Dy3+ and the introduction of alkaline earth metal fluorides have no noticeable influence on the lattice structure of the phosphors. However, relative pure Sr3SiO5: Eu2+, Dy3+ samples can be obtained with the addition of alkaline earth metal fluorides.
XRD patterns of Sr3SiO5: Eu2+, Dy3+ phosphors doped with 5 mol% MF2 (M: Ca, Sr, Ba).

The incorporation of fluoride flux can make the preparation process a solid/liquid phase synthesis, which will decrease the sintering temperature and improve the morphological characteristics of the final product.Reference Pollet, Marinel and Roulland13, Reference Lee, Koo, Jung, Han and Kang14, Reference Yamada, Niiori, Hirabayashi and Tanaka15 Thus, it is reliable that the introduction of alkaline earth metal fluorides can lower the synthesis temperature and is beneficial to the synthesis of pure Sr3SiO5. It is known that the melting points of CaF2, SrF2, and BaF2 are 1423, 1473, and 1353 °C, respectively, while the melting point is 2430 °C for SrO and 1723 °C for SiO2. During the solid-state reaction process, alkaline earth metal fluoride acts as the eutectic composition to lower the reaction temperature. In this way, the alkaline earth metal fluorides may be subject to fast decomposition, resulting in the fast nucleation and densification for Sr3SiO5, which is helpful to promote the formation of Sr3SiO5 phase.Reference Dai, Zhang, Sun and Liu16 Meanwhile, with the introduction of alkaline earth metal fluorides, it becomes easier for the activator (Eu2+) and sensitizer (Dy3+) to get into the lattice sites.
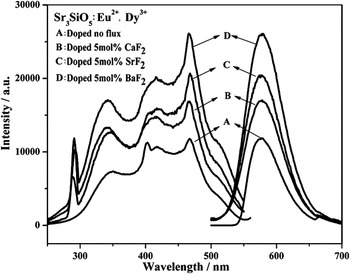
Figure 3 shows the excitation spectra (monitored at 575 nm) and emission spectra (excited at 467 nm) of the phosphors. There is a wide excitation band from 250 to 550 nm containing four major peaks at 295, 350, 411, and 467 nm due to the transitions of Eu2+.Reference Jee, Park and Lee17 The broadband emission centered at 575 nm is also ascribed to the 4f 65d 1–4f 7 transition of Eu2+.Reference Jee, Park and Lee17 No emission peaks of Dy3+ are detected, meaning that Dy3+ does not form luminescence centers in the matrix.Reference Yamamoto and Matsuzawa18 Besides, with the introduction of Ba2+, Sr2+, and Ca2+ into the lattice, the shift of peak wave length is explained by the crystal field effect, which is affected by different coulomb attractive force of the various alkaline earth cation in the host lattice.Reference Nguyen, Yeo and Mho19, Reference Chen, Hwang, Sun and Chen20 When F− ions enter the crystal lattice, it will occupy O2− site because F− and O2− ions have the same electronic configuration and nearly the same ionic radius. In this case, some new centers related to island SiO4 units can be created,Reference Huang, Cho, Jang and Jiang6 which may be the reason of the luminescence enhancement for the alkaline earth metal fluorides-doped phosphors.
Excitation (λem = 575 nm) and emission (λex = 467 nm) spectra of Sr3SiO5: Eu2+, Dy3+ phosphors doped with 5 mol% MF2 (M: Ca, Sr, Ba).

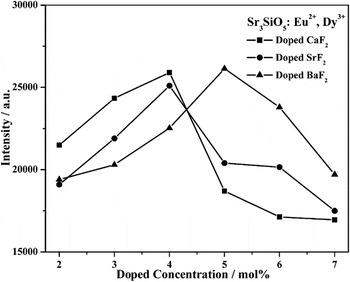
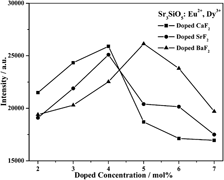
The luminescence intensity not only depends on the concentration of rare earth ions but also on the content of alkaline earth metal fluorides. As is shown in Fig. 4, the emission intensity first increases and then decreases with the increase in the content of each kind of alkaline earth fluoride. The luminescent intensity reaches its maximum when 4 mol% of CaF2, 4 mol% of SrF2, or 5 mol% of BaF2 is introduced.
Luminescence intensity as function of alkaline-earth fluoride content.

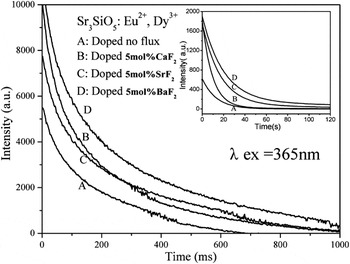
The afterglow was hardly observed in Sr3SiO5: Eu2+. But it prolongs to 5 h after doping Dy3+ in the phosphor.Reference Sun, Zhang, Luo and Wang8, Reference Kuang and Liu21 However, the duration time of the visually recognized (≥0.32 mcd/m2) afterglow for the Sr3SiO5: Eu2+, Dy3+ phosphors doped with alkaline earth fluorides can be prolonged to 7–12 h after the excitation source is cut off. Especially, the afterglow time reaches 12 h when the phosphor is doped with 5 mol% of BaF2. The afterglow decay curves for the phosphors are shown in Fig. 5. It is obvious that both the initial afterglow intensity and the duration time vary with the host composition. With the introduction of alkaline earth metal fluorides, the initial afterglow intensity increases and the afterglow decays more slowly.
Decay curves (λex = 365 nm) of Sr3SiO5: Eu2+, Dy3+ phosphors doped with 5 mol% MF2 (M: Ca, Sr, Ba).

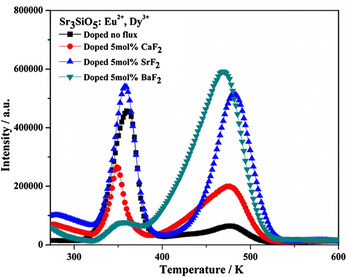
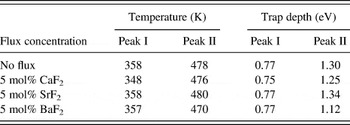
Figure 6 depicts the TL curves of Sr3SiO5: Eu2+, Dy3+ doped with no flux and 5 mol% MF2 (M: Ca, Sr, Ba), respectively. Each TL curve has two peaks marked with I and II, locating at 353 ± 5 K and 475 ± 5 K, respectively, whether the flux is introduced or not. The relationship between the trap depths (E) and the peak temperature (T m) can be estimated by the empirical equation,Reference Li, Wang, Liang and Su22 i.e., E = 25kT m, in which k is the Boltzmann’s constant and T m is the peak temperature of TL curves. The values for the calculated trap depth E are listed in Table I.
TL curves of Sr3SiO5: Eu2+, Dy3+ phosphors prepared with 5 mol% MF2 (M: Ca, Sr, Ba) and no flux.

Trap depth (E) for the Sr3SiO5: Eu2+, Dy3+ phosphor doped with no flux and 5 mol% MF2.

Interestingly, the density at different depths can be adjusted by doping different alkaline earth metal fluorides. As seen from Fig. 6, the relative densities of the traps at different depths change obviously with the addition of alkaline earth metal fluorides. It is clear that the content of the trap corresponding to Peak I increases significantly when SrF2 is introduced, comparing with the sample without flux. For the CaF2- and BaF2-doped samples, however, the content of the traps corresponding to Peak I remarkably decreases. On the other hand, the density of traps corresponding to Peak II all increases when the flux is introduced, in an order of BaF2 < CaF2 < SrF2. Suitable trap depth can lead to the afterglow. If the depth of the trap is too shallow, the captured electrons will quickly escape from the traps, and thus, the afterglow will rapidly decay. On the contrary, if the trap levels are too deep, the escape of captured electrons becomes difficult and the phosphor will not show afterglow at room temperature either. Among the phosphors doped with alkaline earth metal fluorides, the phosphors-doped BaF2 results in the higher content of the trap at 1.12 eV. Therefore, the afterglow time reaches 12 h when the concentration of BaF2 is 5 mol%.
The results of TL test in Sr3SiO5: Eu2+ show only one TL peak (Peak I) located in the range of 350–375 K in Fig. 6, which may be ascribed to the doped Eu2+ ions.Reference Yamaga, Masui, Sakuta, Kodamaand and Kaminaga23 The shallow traps corresponding to Peak I are responsible for the afterglow in the initial period. As it is reported before, Dy3+ acts as a supplier of traps, in which its replacement of Sr site can result in defects in the crystal. The process can be expressed as 3Sr2+ = 2DySr* + VSr. Each substitution of two Dy3+ ions would create two positive defects of DySr* capturing electrons and one negative vacancy of VSr″.Reference Huang, Cui and Wang24, Reference Lin, Dang, Deng and Nan25 The doped Dy3+ would produce the deeper traps that determine the afterglow in the later period. Besides, the introduction of alkaline earth metal fluorides can deepen the traps and enhance the trap density, which can capture much more electrons and results in longer and stronger afterglow.
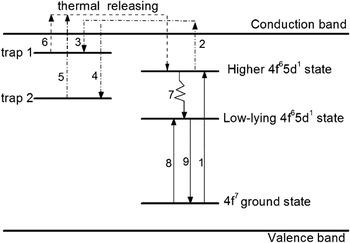
To better explain the afterglow process, a simple model in Sr3SiO5: Eu2+, Dy3+ is proposed, as shown in Fig. 7. As discussed above, there are Trap I and Trap II corresponding to TL peaks I and II in Fig. 6. Trap I is produced by the lattice point defects, while Trap II is produced by the unequal charge substitution of Dy3+ to Sr2+ ion. The transition of the ground state 4f 7 to lower and higher 4f 65d 1 excited states of Eu2+ (transitions 8 and 1) consists the broad excitation band. Under ultraviolet (UV) excitation, part of electrons in higher 4f 65d 1 excited state may enter the conduction band (transition 2), making the electrons captured by the Trap I (transition 4) and Trap II (transition 3). Thus, the light energy is stored in the Trap I and II. When the excitation source is removed, the electron can be released thermally to the conduction band through transitions 5 and 6. Then, the electrons transit from the conduction band to higher 4f 65d 1 excited state level of Eu2+ and relax to its lower 4f 65d 1 state (transition 7). The radiative transition from the lower 4f 65d 1 excited state to the ground state spontaneously causes the yellow afterglow (transition 9).Reference Sun, Zhang and Wang26, Reference Sun, Zhang, Zhang, Luo and Wang27 In fact, the electrons captured by the deeper traps (see TL curves II in Fig. 6) can escape at room temperature but at a much slower rate than that of the electrons in shallower traps (see TL curves I in Fig. 6), which makes a dominant contribution to the long afterglow.
Model of afterglow process in Sr3SiO5: Eu2+, Dy3+ phosphors.

It is noted that though the long afterglow can be observed under UV excitation, the initial afterglow intensity becomes very weak and the afterglow also decays quickly when the phosphor is excited at 411 nm. While excited at 467 nm, the luminescence can be obtained but no afterglow is observed. The Eu2+ is excited to its lower 4f 65d 1 state rather than the higher 4f 65d 1 state under the excitation of 467 nm, which is far from the conduction band. The electrons in the lower 4f 65d 1 state are difficult to enter the conduction band and fall into the ground state spontaneously. Therefore, no afterglow can be observed when the energy of the exciting photon is too low. When the excitation wave length is shorter than 411 nm, however, the electrons are pumped to the higher 4f 65d 1 state very close to the conduct band and are possible to enter the conduct band by absorbing several phonons and can be finally captured by the traps. Hence, only excited by UV photons (250–400 nm) with enough energy, the electrons can be captured by the traps with the help of the conduction band, producing the afterglow.
IV. CONCLUSION
A series of yellow light-emitting afterglow phosphors have been synthesized. The doped alkaline earth metal fluoride greatly improves the luminescence and afterglow properties. Comparing with the sample without flux doping, the initial intensity of Sr2.95SiO5, 0.05BaF2: Eu2+, Dy3+ phosphor is increased by 2.3 times. Moreover, its duration time for afterglow could last for 12 h. The synthesized material might be a potentially commercial yellow afterglow phosphor for its bright luminescence and long persistent time. Additionally, the work also offers a feasible way to adjust the trap density at different depths by introducing suitable alkaline earth fluoride.
ACKNOWLEDGMENTS
This work was supported by Scientific Research Fund of Hunan Provincial Education Department (Nos. 10A120 and 11B117) and Hunan Provincial Natural Science Foundation of China (No. 10JJ6012).