INTRODUCTION
Artificial reefs (ARs) have been used for a variety of purposes other than for the improvement of commercial harvest. Furthermore, applications of ARs vary substantially, from fisheries programmes to recreational and environmental projects, and may be of natural or man-made materials (see reviews by D'Itri, Reference D'Itri1986; Seaman & Sprague, Reference Seaman, Sprague, Seaman and Sprague1991; Jensen et al., 2000; Bortone et al., 2011). ARs are often created by sinking decommissioned vessels, with the aim to enhance local fish diversity and abundance for the fishing industry, angling and/or ecotourism (i.e. snorkelling and SCUBA diving). Conversely, the deliberate use of some of these surplus materials is one of the most controversial aspects related to the creation of ARs worldwide (Baine & Side, Reference Baine and Side2003). To determine how well ARs mitigate biodiversity losses as a consequence of human activities on NRs, the performance of ARs should be evaluated using contemporaneous comparisons with relatively undisturbed NRs (Carr & Hixon, Reference Carr and Hixon1997). Past evaluations of AR efficiency, related to those man-made structures deployed for mitigation purposes have focused largely on the benefits to specific organisms or suites of species, and little attention has been given to comparisons to nearby NRs. In fact only a few studies have compared NRs to ARs to determine their efficacy as mitigation tools for damage on near-shore habitats (Palmer-Zwahlen & Aseltine, Reference Palmer-Zwahlen and Aseltine1994; Carr & Hixon, Reference Carr and Hixon1997; Thanner et al., Reference Thanner, McIntosh and Blair2006). Several studies have highlighted the importance of habitat and geomorphological features on the associated fish assemblages (Friedlander & Parrish, Reference Friedlander and Parrish1998; Gratwicke & Speight, Reference Gratwicke and Speight2005). However, such issues have been poorly investigated as regards ARs.
The Cape Verde Archipelago is composed of ten islands (and thirteen islets), located 750 km off Senegal (west coast of Africa), between 15–17°N and 22–25°W. Tourism is the country's main source of income and the source of socioeconomic development for several of the islands. Tourism in the Archipelago has a close relationship with marine-related activities, due to the warm weather, sandy beaches, clear water and high diversity of marine species. Sal Island was visited by more the 190,000 tourists in 2008, representing over 50% of the total number of visitors to the Archipelago (Anon, 2009); local consumption of fish products increased by 60% between 1990 and 2000. Such demand has largely been supported by intensive and uncontrolled fishing activities (Anon, 2004), making use of a wide range of techniques and gears (including set nets, longlines, hand lines, traps, explosives and spearfishing). A census regarding the local artisanal fishing industry revealed a total of 119 boats and 357 fishermen in Sal Island coastal waters in 2005 (Anon, 2011). A decrease of 17.5% in the artisanal fishing captures (kg/trip) was recorded from 2000 to 2009 (Anon, 2011). SCUBA diving is an increasingly popular sport and, worldwide, the number of PADI individual divers increased by 66.1% between 1996 and 2010 (PADI, 2011). Although there are no statistics for Cape Verde, currently six dive centres operate in Santa Maria Bay (Sal Island), increasing the human pressure on local NRs. A number of studies have reported how divers can damage benthic marine organisms (hard and soft corals, sponges, ascidians and large bryozoans) directly (physical contact) or indirectly (raised sediments) (Rouphael & Inglis, Reference Rouphael and Inglis1997; Tratalos & Austin, Reference Tratalos and Austin2001; Zakai & Chadwick-Furman, Reference Zakai and Chadwick-Furman2002; Luna et al., Reference Luna, Pérez and Sánchez-Lizaso2009). Furthermore, fish can also be disturbed due to selective search by divers (e.g. cryptic species) and change their natural behaviour (e.g. during mating) (Uyarra & Coté, Reference Uyarra and Coté2007; Heyman et al., Reference Heyman, Carr and Lobel2010). The scientific information on local fish assemblages is very limited, consisting mostly of an inventory list of species (Lloris et al., Reference Lloris, Rucabado and Figueroa1991; Reiner, Reference Reiner1996; Monteiro et al., Reference Monteiro, Ribeiro, Silva, Bispo and Gonçalves2008). However, Roberts et al. (Reference Roberts, McClean, Veron, Hawkins, Allen, McAllister, Mittermeier, Schueler, Spalding, Wells, Vynne and Werner2002) listed Cape Verde in the top 10 coral reef biodiversity hotspots in the world and as in the top eight of threatened centres of endemism.
Following the development of this scenario, the local Environmental Authority decided to take steps to improve the sustainability of local development and invested in the restoration of impacted marine habitats. A method proposed by Clewell et al. (Reference Clewell, Rieger and Munro2000) was trialled, which consisted of deploying a functional habitat that can support high marine biodiversity, so that it can continue its natural maturation and evolve over a longer time-span in response to changing environmental conditions. The Ministry of Environment and Marine Resources of Cape Verde supported the proposal put forward by a private diving operator (Manta Diving Centre, Sal Island, Cape Verde) to deploy ARs in Cape Verde coastal waters. They deployed a first shipwreck (‘Kwarcit’) in 2006, followed by a second (‘Sargo’) in 2008. The two decommissioned vessels were sunk off Santa Maria Bay (southern coast of Sal Island), aiming to promote local biodiversity and the sustainable development of diving tourism. In the present study two ARs (‘Kwarcit’ and shipwreck ‘Santo Antão’) have been evaluated by comparing the local fish assemblages to those from two nearby NRs (‘Farol Baixo’ and ‘Tchuklassa’), in terms of species and assemblage structure (density and fish size). The effect of habitat complexity on the fish assemblages was also studied.
MATERIALS AND METHODS
Study sites
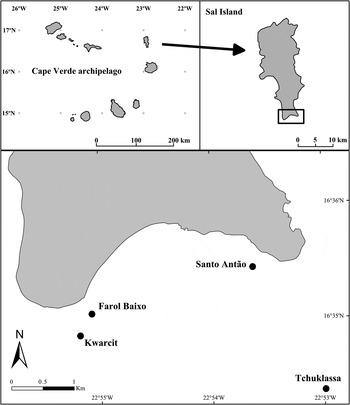
Two shipwrecks (‘Santo Antão’ and ‘Kwarcit’) and two NRs (‘Farol Baixo’ and ‘Tchuklassa’) were sampled off Santa Maria Bay (Figure 1). The NRs are located at two distinct depths-ranges: shallow reefs (4–11 m) and deep reefs (15–30 m). Comparisons were made between reefs of the same depth-range:
Location of the study sites at Santa Maria Bay (Sal Island, Cape Verde).

‘Farol Baixo’—is located on a plateau with a gentle slope from 4 to 7 m depth to the top of a 3 m high wall, falling to about 10 m depth. The plateau and the wall have many small crevices, interrupted by narrow perpendicular channels. A few small caves can be observed on the base of the wall. This NR runs parallel to the shoreline for 200 m, beginning just 0.3 km from the coast.
‘Tchuklassa’—this rocky reef is on a plateau located further offshore (2.12 km from the shoreline) to the eastern side of the bay. The maximum depth on the north-western side is 30 m. The plateau has a large overhang at 15 m depth with vertical walls extending 30 m deep. The plateau comprises small rocks and some larger boulders, with small vertical reliefs, but presenting many crevices and narrow channels.
‘Santo Antão’—is a former cargo vessel that was sunk during a storm in 1965 at a depth of 11 m. The vessel was 53 m long and 9 m wide, but it is now broken into several parts over an area of 50 m by 20 m. The maximum height is 5 m. It lies on a flat sandy bottom, 0.15 nm from the shoreline inside the bay.
‘Kwarcit’—is a former soviet beam trawler that was deliberately sunk on the 6 January 2006. The vessel is 27 m long, 7 m wide and 10 m high. It lies on a flat rocky bottom covered by a thin layer of sand on the starboard side of the wreck. It is located 0.3 nm from the shoreline in the westernmost part of the bay at a depth of 28 m.
The distance between ‘Santo Antão’ and ‘Farol Baixo’ is 2.7 km, while ‘Kwarcit’ and ‘Tchuklassa’ are 4 km apart.
Data collection
The four reefs were sampled in a relatively short period of time (two weeks in August 2009) to reduce bias from temporal variability. The visual censuses were performed by divers who recorded all fish species present within the area, as well as their size and abundance. Due to the different habitat complexities and diving time limitations (due to depth), a combination of methodologies were used as suggested by Bortone et al. (Reference Bortone, Samoilys, Francour and Seaman2000): transect (Brock, Reference Brock1954; Buckley & Hueckel, Reference Buckley and Hueckel1989) and species–time random count method (Thompson & Schmidt, Reference Thompson and Schmidt1977; Jones & Thompson, Reference Jones and Thompson1978).
The species–time random count method of Harmelin-Vivien et al. (Reference Harmelin-Vivien, Harmelin, Chauvet, Duval, Galzin, Lejeune, Barnabé, Blanc, Chevalier, Duclerc and Lassèrre1985) was used to determine the minimum time for the random counts. A five minute interval was considered, as this was the time estimated to observe 90% of the species on the four study sites. Due to the different habitat complexities, different strata were considered at:
-
• Shallow reefs (‘Farol Baixo’ and ‘Santo Antão’)—seabed (lower) and at the upper part of the reef (plateau or the top of the wreck);
-
• Deep reefs (‘Tchuklassa’ and ‘Kwarcit’)—seabed (lower), middle (overhang or vessel deck) and upper part of the reef (plateau or the top of the vessel structure).
For each study site two geomorphological indices were estimated (for each stratum) using two methods: site topography (complexity) and rugosity measurements. Site complexity was estimated by visual assessment assigning each site a grading from 0 to 5, adapted from Wilson et al. (Reference Wilson, Graham and Polunin2007), where:
-
0—no vertical relief;
-
1—low and sparse relief;
-
2—low but widespread relief;
-
3—moderately complex, with rocks and/or boulders of several sizes;
-
4—very complex with numerous fissures and caves;
-
5—exceptionally complex with numerous caves, overhangs and canyons.
Rugosity was measured as the ratio between the distance along the surface (covered by a chain of 10 m length) and the straight-line shortest distance between the two perpendicular points at the ends of the chain. Rugosity was not measured at the middle stratum at ‘Tchuklassa’, due to its geomorphology (overhang with very low bottom relief, but with high rugosity at the roof). The location for data collecting was randomly selected. The number of replicates varied according to the site, varying from 5 (at the top stratum of ‘Kwarcit’) to 16 (at the top stratum of ‘Farol Baixo’), increasing with site complexity.
At each stratum divers recorded the fish species present along a standard transect (10 m long × 4 m wide and 2 m high), their abundance and size (according to pre-established length size-classes). Three replicate transects were made at each stratum, corresponding to a total of six and nine counts for each sample, at the shallow and deep reefs, respectively. A total of ten surveys were carried out at each study site in order to account for the natural variability of the fish assemblages. Sampling was conducted by the same two experienced divers simultaneously for each dive. Diver No. 1 performed the bottom transects counts, while diver No. 2 conducted the surveys at the middle and top of the reefs. This was kept constant throughout the study. Sampling was performed between 9:30 am and 3:30 pm, to take advantage of maximum sunlight and visibility and to avoid the natural differences of fish activity between dawn and dusk.
Fish were assigned to spatial categories (SC), by slightly modifying those suggested by Harmelin (Reference Harmelin1987) for fish from Mediterranean rocky bottoms:
-
• Category 1—highly mobile, gregarious, erratic pelagic species (e.g. Pseudocaranx dentex and Seriola spp.);
-
• Category 2—planktophagous and relatively sedentary species, living throughout the water column (e.g. Chromis lubbocki);
-
• Category 3—demersal mesophagous species, with medium-amplitude vertical movements and more-or-less important horizontal movements (e.g. Acanthurus monroviae);
-
• Category 4—demersal benthophagous species, with medium-amplitude vertical movements and more-or-less important horizontal movements (e.g. Aluterus scriptus);
-
• Category 5—demersal species, with limited vertical and considerable lateral movements (e.g. Pseudupeneus prayensis);
-
• Category 6—sedentary demersal mesophagous species (e.g. Sparisoma spp.);
-
• Category 7—highly-sedentary cryptic benthic species (e.g. Gymnothorax spp.).
Density was calculated as the number of fish per standard transect. The frequency of occurrence (FO) or appearance of a species at each site was calculated as a percentage of presence in all surveys in that site and expressed according to four levels as suggested by Harmelin (Reference Harmelin1987):
-
• level I (very frequent) >75%;
-
• ≤75% level II (frequent) >50%;
-
• ≤50% level III (uncommon) >25%;
-
• level IV (rare) ≤25%.
Data analysis
The analyses were conducted separately for the shallow and deep as the two ARs presented several differences (i.e. size, submersion time, etc.).
Univariate variables of the fish communities (N, abundance; S, number of species; H′, Shannon–Weaver diversity index; D-1, Simpson index of diversity; and J′, equitability index) were analysed by two-way analysis of variance (ANOVA) with site (AR versus NR, fixed factor) and strata as factors (two strata at lower depth, Top versus Bottom; and three strata at deeper depths, Top versus Middle versus Bottom, fixed factors). Analyses of variance was followed on appropriate terms of the model by a posteriori Tukey's honestly significant difference (HSD) tests, which was found to be significant with P < 0.05. Whenever the assumptions of ANOVA were violated (homogeneity of variances and normality checked using Levene test and Lilliefors (Kolmogorov–Smirnov) test, respectively), appropriate transformations were used (Underwood, Reference Underwood1997). If violation persisted, non-parametric tests were used (Kruskal–Wallis, for factors with more than 3 levels, and Wilcoxon Rank Sum test (Mann–Whitney test)). The latter tests were performed for each factor separately, e.g. AR versus NR and AR Top versus AR Bottom , and similarly for the NRs. Rugosity and complexity was analysed using the non-parametric methods previously referred to, because sample size was substantially different, leading to very unbalanced designs. Multivariate methods were used to detect differences in the composition and structure of the assemblages, namely non-metric multidimensional scaling (n-MDS) and permutational multivariate analysis of variance (PERMANOVA) using abundance data. The similarity matrix used in the analysis was built using the Bray–Curtis similarity index (Legendre & Legendre, Reference Legendre and Legendre1998; Clarke & Warwick, Reference Clarke and Warwick2001; Clarke et al., Reference Clarke, Somerfield and Chapman2006).
Indicator species analysis (ISA) (Dufrêne & Legendre, Reference Dufrêne and Legendre1997) was conducted on fish assemblage data from the two depth-ranges to assess associations of species to sites. ISA identifies taxa associated with groups (NR and AR) by calculating an indicator value (Indval, ranging from 0 to 1) taking into account the frequency of occurrence and the abundance of each taxon in defined groups. ISA allows for the examination of common and rare taxa within a community rather than focusing solely on common species with high indicator values. This reflects both high abundance and prevalence of taxon within a group. Significance of indicator values was assessed using Monte Carlo simulations. A total of 999 randomized runs were performed, with P values representing the probability of a similar observation using randomized data. To compare the size distribution of selected species (the ten most abundant species, plus those with an overall abundance of at least 250 specimens) between the NR and the AR at each depth, the non-parametric Wilcoxon rank sum test (Mann–Whitney test) was used (Sokal & Rohlf, Reference Sokal and Rohlf1987) to assess whether the two independent samples had equally large values (measures differences in location). The two sample Kolmogorov–Smirnov test was used to investigate the differences between the two distributions (high sensitivity to differences in dispersion and skewness). The relationship between fish assemblages (fish density and number of species) and habitat complexity (rugosity) was assessed using linear regression analysis. Analysis of covariance (ANCOVA) was used to test if the effects were consistent among sites (similar slopes and intercepts) (Bingham & Fry, Reference Bingham and Fry2010). All the analyses were conducted using the open source statistical software R v2.10.0 (R Development Core Team, 2005) and PERMANOVA computer program for MS-DOS (Anderson, Reference Anderson2001).
RESULTS
Habitat rugosity and complexity
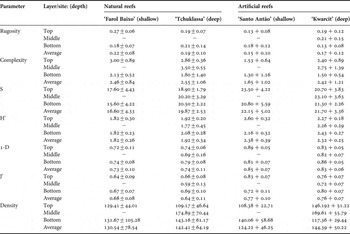
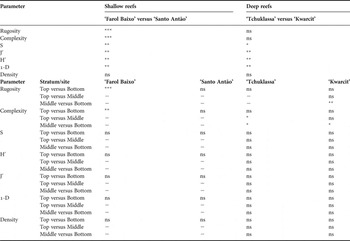
The mean total habitat rugosity values obtained for the study sites varied from 0.15 (±0.075) at ‘Santo Antão’ and 0.22 (±0.102) at ‘Farol Baixo’ (Table 1), with significant differences between natural and ARs at low depth (P < 0.001; Table 2). With regards to complexity, the observed mean values ranged from 1.65 (±1.018) at ‘Santo Antão’ to 2.55 (± 1.058) at ‘Tchuklassa’. At the NRs a significant decrease in complexity was recorded from the top to the bottom, although the highest value for ‘Tchuklassa’ was recorded in the middle stratum (Table 1). The comparison of habitat complexity between sites showed significant differences between natural and artificial reefs at both depths (P < 0.001 and P < 0.05, for the shallow and deep reefs, respectively). Furthermore, a strong positive linear relationship between the two habitat indices was observed (linear regression R2 = 0.593, P < 0.001).
Mean values (±standard deviation) recorded for the geomorphological (rugosity and complexity) and ecological indices: species richness (S), Shannon–Weaver diversity index (H′), Simpson diversity index (1-D), Pielou evenness (equitability) index (J′) and mean density (number of fish/standard transect).

Results of the statistical tests used for the inter- and intra-site comparisons for the geomorphological (rugosity and complexity) and ecological indices: species richness (S), mean Shannon–Weaver diversity index (H′), Simpson diversity index (1-D), Pielou evenness (equitability) index (J′) and mean density.

Assemblage composition
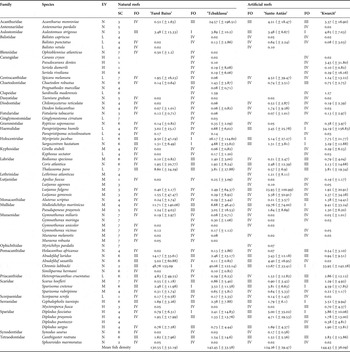
A total of 64 species were recorded belonging to 32 families (Table 3). The most speciose families were Muraenidae (6 species) and Pomocentridae (5 species), with another 3 families (Carangidae, Lutjanidae and Sparidae) represented by 4 species each. Fifty-five species were found on the shallow reefs and 61 species on the deep reefs. A total of 39 species (61%) were common to the four study sites, while 43 (67%) species were common to the shallow reef and 51 (80%) species to the deeper reefs. Ten species had a high commercial value, 25 species had no commercial value, while the remaining ones were of medium to low economic interest (Table 3). With regards to the species category, a common pattern was observed in all sites (Table 3), with demersal species dominating in number (categories 4 and 6), followed by highly-sedentary benthic cryptic species (category 7). Rare species showed large dominance at all sites, representing over 94% (52) and 72% (44) at the shallow and deeper sites, respectively. Furthermore, very frequent species were not recorded at the shallow sites. ‘Tchuklassa’ showed the highest species richness (58 species, 2 exclusive to the site: Ginglymostoma cirratum and Prognathodes marcellae), followed by ‘Kwarcit’ (54 species, with two exclusive to the site: Antennarius pardalis and Diplodus puntazzo), ‘Farol Baixo’ (50 species) and ‘Santo Antão’ (48 species, 2 exclusive to the site: Lethrinus atlanticus and Myrichthys pardalis).
Mean fish density (number of fish/standard transect) at the study sites (± standard deviation). Species economic value (EV): H, high; M, moderate; L, low; N, none. For details on the species spatial categories (SC) and frequency of occurrence levels (FO, roman numbers) see Materials and Methods section.

The mean species richness ranged from 16.6 at ‘Farol Baixo’ to 22.1 at ‘Santo Antão’ (Table 1). On the shallow reefs it increased from the bottom to the top, while on the deeper reefs the lowest figures were found at the top stratum. On the deeper reefs, the highest mean species richness was recorded on the middle stratum at ‘Kwarcit’ and at the bottom at ‘Tchuklassa’. Significant differences were found between reefs mean species richness at similar depths, being higher on the ARs (Tables 1 & 2). The mean Shannon–Weaver diversity index (H′) varied from 1.8 at ‘Farol Baixo’ and 2.4 at ‘Santo Antão’. Higher values were observed at the artificial reefs, the highest values being recorded at ‘Santo Antão’ (Tables 1 & 2). The comparisons between strata showed no general trend among sites. Higher values were found at the top at ‘Santo Antão’, while at the deep reefs differences were only observed between the bottom and middle strata. Similar patterns as those described above for H′ were found for the mean Pielou evenness (equitability) index. As regards the mean Simpson diversity index differences were observed at both depths, although the comparison among strata only revealed differences in the deeper sites (Table 1 & 2).
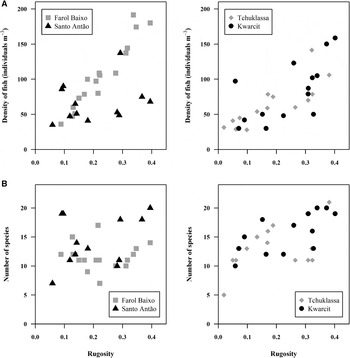
An overall positive relationship was observed between habitat rugosity and species richness (see Figure 2; linear regression, R2= 0.1526, F1,55 = 9.91, P < 0.01), although such a significant positive trend was only noted at one individual site (‘Kwarcit’, linear regression, R2 = 0.4681, F1,12 = 10.56, P < 0.01; Figure 2).
Relationship between habitat rugosity and (A) fish density and (B) number of species, for shallow (left) and deep reefs (right).

Fish density and size structure
The mean density ranged from 124.2 (±46.25) fish/standard transect at ‘Santo Antão’ to 144.4 (±50.22) fish/standard transect at ‘Kwarcit’ with higher values recorded in deeper waters. Differences were only found between strata at the deep reefs (Tables 1 & 2).
The family Pomacentridae largely dominated the assemblages at ‘Farol Baixo’ (52%), ‘Tchuklassa’ (30%) and ‘Kwarcit’ (25%). Such dominance was mostly due to C. lubbocki. Holocentridae (22%) and Acanthuridae (17%) were also important families at ‘Tchuklassa’ and Haemulidae (24%) at ‘Kwarcit’. At ‘Santo Antão’ the dominant families were Lutjanidae (24%), Mullidae (17%) and Pomacanthidae (17%). Chromis lubbocki (37%), Abudefduf luridus (11%) and Mulloidichthys martinicus (9%) were the dominant species at ‘Farol Baixo’. At ‘Santo Antão’ the most important species were Lutjanus fulgens (19%), M. martinicus (16%) and C. lubbocki (10%). The latter species also dominated at ‘Tchuklassa’ (28%), followed by Myripristis jacobus (18%) and A. monroviae (17%). At ‘Kwarcit’ the assemblage was dominated by Parapristipoma humile and C. lubbocki (24%), followed by M. martinicus (7%) (see details in Table 3).
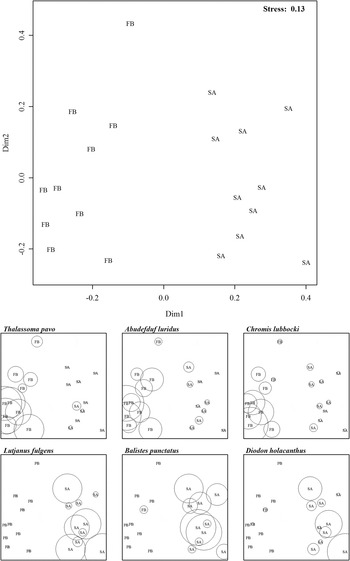
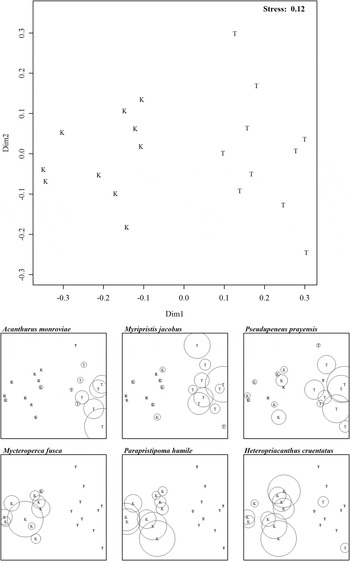
At shallow and deep reefs the two-way crossed PERMANOVA analyses pointed to a significant interaction between reefs and strata (shallow reefs: PERMANOVA, F = 2.34, P = 0.007; deep reefs: PERMANOVA, F = 2.10, P = 0.001). However, the multiple comparison tests showed that the structure of the fish assemblage in each site was different for each stratum (P < 0.001). Furthermore, consistent differences were observed when strata were compared between reefs (P < 0.001). Moreover, preliminary analyses using n-MDS (not presented) resulted in high stress (>0.2) two-dimensional representations with no clear patterns due to the high variation in the data, possibly due to the interaction between factors. Therefore, the merged data for each sample (sum of strata densities) was further analysed using n-MDS. Concerning the shallow reefs, the latter analysis highlighted the differences between the two studied sites. In fact, the samples from the shallow reefs clustered in two different groups at the horizontal axis, with the vertical axis displaying variability among samples from each site (Figure 3). These results corroborated the PERMANOVA results of differences between reefs (P < 0.001, post-hoc comparisons among reefs within each stratum). The species which most contributed to these differences were: Thalassoma pavo (Indval = 0.937), Abudefduf luridus (Indval = 0.805), C. lubbocki (Indval = 0.794) and Ophioblennius atlanticus (Indval = 0.600), at ‘Farol Baixo’; and L. fulgens (Indval = 0.983), Balistes punctatus (Indval = 0.964), Diodon holacanthus (Indval = 0.960), Chilomycterus reticulatus (Indval = 0.900), A. monroviae (Indval = 0.889), Diplodus fasciatus (Indval = 0.889), Chaetodon robustus (Indval = 0.754) and L. atlanticus (Indval = 0.500) at ‘Santo Antão’ (Figure 3). The n-MDS analysis also revealed differences between ‘Tchuklassa’ and ‘Kwarcit’, as the samples from the two deep sites clustered in different groups at the horizontal axis, with the vertical axis again displaying the variability within each site (Figure 4). Again differences were highlighted by the PERMANOVA (P < 0.01, tests among reefs within each stratum). The species which most contributed to the differences between the deeper reefs were: A. monroviae (Indval = 0.880), M. jacobus (Indval = 0.772) and P. prayensis (Indval = 0.701), C. robustus (Indval = 0.657) and Bodianus speciosus (Indval = 0.638) at ‘Tchuklassa’; and Mycteroperca fusca (Indval = 1.000), P. humile (Indval = 0.980), Heteropriacanthus cruentatus (Indval = 0.909), Spicara melanura (Indval = 0.761), A. scriptus (Indval = 0.746), Holacanthus africanus (indval = 0.729), P. dentex (Indval = 0.681), D. fasciatus (Indval = 0.615) and Cephalopholis taeniops (Indval = 0.638) at ‘Kwarcit’ (Figure 4).
Non-metric multidimensional scaling plot of the fish community data from low depth sites at Santa Maria Bay. FB, ‘Farol Baixo’ (NR); SA, ‘Santo Antão’ (AR). Bray–Curtis index of similarity using untransformed abundance data. Abundance data superimposed (bubble size) for species that contributed most to the differences between AR and NR (indicator species analysis).

Non-metric multidimensional scaling plot of the fish community data from deep depth sites at Santa Maria Bay. T, ‘Tchuklassa’ (NR); K, ‘Kwarcit’ (AR). Bray–Curtis index of similarity using untransformed abundance data. Abundance data superimposed (bubble size) for species that contributed most to the difference between AR and NR (indicator species analysis).

The mean density of fish showed a positive relationship with habitat rugosity (linear regression, R2 = 0.4556, F1,55 = 46.03, P < 0.001; Figure 2). Significant trends were found at all individual sites except at ‘Santo Antão’. At the deeper depth the relationship between habitat rugosity and fish density was reef independent (ANCOVA, P < 0.001).
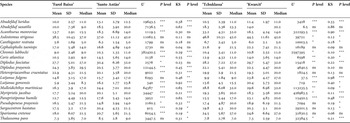
Most species showed similar size-ranges within the same depths. However, for larger-bodied species, a wider size-range was observed on the deeper sites. Most comparisons, in terms of the size distributions and respective median, showed significant differences between sites at similar depth. On the shallow reefs higher mean sizes and medians were observed at ‘Santo Antão’, while on the deeper reefs no clear pattern was noted (Table 4).
Results of the statistical tests (U, Mann–Whitney; KS, Kolmogorov–Smirnov) used for the inter-site comparisons related to size distributions for the most numerically abundant species at the shallow (‘Farol Baixo’ and ‘Santo Antão’) and deep reefs (‘Tchuklassa’ and ‘Kwarcit’). ns, non-significant; *, P < 0.05; **, P < 0.01; ***, P < 0.001.

DISCUSSION
Artificial reefs are increasingly used as a tool to mitigate the human impact on NRs and to promote a higher biodiversity. Thus, as mentioned by Thanner et al. (Reference Thanner, McIntosh and Blair2006) it is important to understand the extent to which the ARs can effectively provide similar habitats on NRs areas. Furthermore, the degree to which the fish assemblages on the ARs become similar to those on NRs has not been well demonstrated. Most studies involving the comparison of the fish assemblages from NRs and ARs do not control reef size, age and degree of isolation, because the man-made reefs are typically much smaller, younger, and more isolated than their natural counterparts (Carr & Hixon, Reference Carr and Hixon1997). In the present study we could only overcome one of the above mentioned constraints, by choosing sites with a similar degree of isolation and vertical relief, as there are no NRs of similar size or age to the ARs off Santa Maria Bay. This comparative study provides the first insight on the potential use of ARs (shipwrecks) to mimic, at some level, NRs in Cape Verde coastal waters, allowing similar fish assemblages to establish.
The present study showed that the Santa Maria Bay reefs support diverse fish assemblages, including both coastal and oceanic species. Most of these species were characteristic of infra-littoral habitats, have broad distributions and are readily found on rocky bottoms of the Cape Verde archipelago (Franca & Vasconcelos, Reference Franca and Vasconcelos1962; Lloris et al., Reference Lloris, Rucabado and Figueroa1991; Reiner, Reference Reiner1996; Monteiro et al., Reference Monteiro, Ribeiro, Silva, Bispo and Gonçalves2008). Several of these species can also be found in the Canary Islands (Bortone et al., Reference Bortone, Tassell, Brito, Falcon, Mena and Bundrick1994; Herrera et al., Reference Herrera, Espino, Garrido and Haroun2002) and São Tomé and Príncipe Islands (Debelius, Reference Debelius1997). Furthermore, some of the recorded species are thought to have quite distinct origins (e.g. amphi-Atlantic, cosmopolitan or Atlantic–Mediterranean). Monteiro et al. (Reference Monteiro, Ribeiro, Silva, Bispo and Gonçalves2008) suggested such findings might have two reasons: (i) Lloris et al. (Reference Lloris, Rucabado and Figueroa1991) identified the Cape Verde Islands as the frontier between the Lusitanian province and the tropical West African sub-region; and (ii) the archipelago is located in the vicinity of the North Equatorial Current and the southern part of the Canary Current, which is part of the clockwise ocean current system of the North Atlantic Ocean (Zhou et al., Reference Zhou, Paduan and Niiler2000). The list of species identified in this study should not be considered exhaustive, as sampling was limited in time and the visual census methods used does not favour the observation of small sized cryptobenthic species. The total number of species recorded was, however, greater than those previously reported by Monteiro et al. (Reference Monteiro, Ribeiro, Silva, Bispo and Gonçalves2008) for two Cape Verde seamounts: ‘Northwest’ (27 species) and ‘João Valente’ (46 species). Furthermore, we observed 25 species that have not been reported before on the seamounts. Interestingly, 12 species recorded by the previous authors on the seamounts were not observed in the present study, seven of which were pelagic species. The seamounts found in this area have similar geological characteristics to those of the adjacent islands, which are in general composed of basalt rock (Mitchell-Thomé, Reference Mitchell-Thomé1972). The latter seamounts are commercially unexploited (Monteiro et al., Reference Monteiro, Ribeiro, Silva, Bispo and Gonçalves2008), which is not the case of the Santa Maria Bay, whose fish assemblages are mostly (60%) composed of economically important species that are fished regularly by the local artisanal fleet. The slightly higher number of species found on the deeper reefs were due mostly to highly mobile, pelagic species (e.g. Caranx crysos, P. dentex, Seriola dumerili and S. rivoliana), which are not characteristic of the reefs, but often visit such habitats while foraging for preys (M.N. Santos, personal observation).
The present study demonstrates that the total number of species and mean fish densities at the ARs were similar to that of the NRs. These may be due to some level of similarity in terms of habitat complexity (namely at the deeper sites) and a result of the relative isolation of the ARs, which favour the ‘oasis’ effect suggested by Santos et al. (Reference Santos, Monteiro and Lassèrre2005). In Santa Maria Bay the scarcity and the discontinuity of hard substrata may be the cause of the high number of fish species found. Several authors have suggested that species richness and abundance associated with ARs may be related to the degree of isolation (Gascon & Miller, Reference Gascon and Miller1981; Walsh, Reference Walsh1985; Bohnsack et al., Reference Bohnsack, Johnson, Ambrose, Seaman and Sprague1991; Ody & Harmelin, Reference Ody and Harmelin1994; Herrera et al., Reference Herrera, Espino, Garrido and Haroun2002). On the other hand, as suggested by Gratwicke & Speight (Reference Gratwicke and Speight2005), possible explanations for the higher number of fishes in rugose areas include increased refuge from predators and/or increased primary productivity (or availability of other food resources) on the hard surfaces that can support more fishes. Rocky biotopes located in the neighbourhoods of the ARs may serve as source areas, facilitating colonization.
The local NRs have a higher rugosity and structural complexity (more holes and crevices) than the wrecks, but the ARs showed higher values for the investigated ecological indices (mean species richness, mean diversity and mean equitability). Similar results have been previously reported by Rilov & Benayahu (Reference Rilov and Benayahu2000), but are in contrast with those found in other studies carried out in tropical waters where high-relief structures were used (Carr & Hixon, Reference Carr and Hixon1997; Rooker et al., Reference Rooker, Dokken, Pattengill and Holt1997).
The similar assemblage's composition at the ARs and at the NRs (differences were mainly due to rare species) suggests that these ARs may have already reached an equilibrium point. But species composition can also change in the future depending on the succession of other colonizers (benthic epifauna and epiflora), as shown by other authors (Ardizzone et al., Reference Ardizzone, Belluscio, Somaschini, Hawkins, Hutchinson, Jensen, Sheader and William1997; Santos et al., Reference Santos, Leitão, Lino, Moura, Cerqueira and Monteiro2011). The differences found between ARs and NRs in this study were mainly due to a few particular species. In the case of the shallow NRs, the higher abundance of macrofauna (unpublished data) may favour the presence of T. pavo and A. luridus, while at ‘Santo Antão’ B. punctatus and D. holocanthus may be using the surrounding soft bottom to prey. In fact, the latter species was frequently observed feeding at ‘Santo Antão’.
With regards to the deeper reefs, large shoals of P. humile were commonly observed around the ARs (M.N. Santos, personal observation), whereas M. fusca were found to swim frequently near the bottom in small shoals of two to five specimens. According to Bustos et al. (Reference Bustos, Luque and Pajuelo2009) the latter species is characteristic of rocky and sandy–rocky seabeds from the shore down to a depth of 150 m and is most frequent in dips and bays, where it swims around large rocks at mid-depths, most frequently alone but sometimes in small shoals. Parapristipoma humile and P. cruentatus, which mostly feed on benthic invertebrates, were found to be more abundant at ‘Kwarcit’. At ‘Tchuklassa’, M. jacobus were seen to benefit from the greater availability of small crevices and holes, while A. monroviae forms large shoals concentrated on the sheltered part of this rocky reef.
The habitat rugosity and complexity records from all study sites were within the range of what has been reported for similar habitats. Differences observed between the two reef types reflected the greater heterogeneity of the NRs in contrast to the ARs which have fewer micro-habitats available. Several studies which analysed fish assemblages at local scales demonstrated that the less complex habitats (ARs) can support higher fish density than more complex ones, but more complex habitats generally support a higher number of fish species (Luckhurst & Luckhurst, Reference Luckhurst and Luckhurst1978; Roberts & Ormond, Reference Roberts and Ormond1987; Gorham & Alevizon, Reference Gorham and Alevizon1989; Ferreira et al., Reference Ferreira, Goncalves and Coutinho2001; Gratwicke & Speight, Reference Gratwicke and Speight2005). However, the present study showed no fish density differences between sites, but higher mean species richness at the lower complex artificial reefs. No explanation for such contradictory results could be found. However, the positive relationships found between habitat rugosity and number of species and fish density was in accordance to what has been commonly observed (Rooker et al., Reference Rooker, Dokken, Pattengill and Holt1997; Gratwicke & Speight, Reference Gratwicke and Speight2005). In the present case such relationships were mostly a consequence of the presence of a high number of species with medium-amplitude vertical movements and more-or-less important horizontal movements, but also due to a few highly mobile, gregarious, pelagic species. However, several other environmental and ecological factors can strongly influence fish assemblages.
The results related to the size structure of the most abundant species do not allow a detailed understanding of the role of the study sites for the different species. Although, based on our in situ observations during data collection, it appears both reef types are providing some common uses. These include sheltering, growth and nursery areas for juveniles and spawning/mating areas for adults (the latter particularly for the wrasses, genus Abudefduf, for which nests were commonly observed). Therefore, further investigations are required, to better understand if these ARs can mimic NRs as essential fish habitats (see definition by Benaka, Reference Benaka and Benaka1999).
The present study provides the first comparative study of fish assemblages of NRs and ARs in Cape Verde waters, and has demonstrated that decommissioned vessels can mimic the local NRs by supporting diverse fish assemblages similar to those from nearby natural habitats. Furthermore, such affects were noted across the depth-range studied (10–30 m). These facts justify the potential of using ARs to attract a wide range of eco-tourists, from shallow to deep sites (IPIMAR, unpublished data). These findings might be particularly useful for local managers, because the Cape Verde Archipelago is under increasing pressure from the local fishing and eco-tourism industries, therefore exposing natural reefs and their associated fish assemblages to higher vulnerability.
In a country which is highly dependent on tourism and has excellent conditions to develop eco-tourism activities, it is important to promote local fish biodiversity (and associated fauna), as a strategy to support sustainable development of other marine related activities. A decline in the number and abundance of local fishes had been reported (Anon, 2004; personal communications from local diving operators and environmental managers). Thus, by creating new habitats that resemble natural reefs in areas where the occurrence of hard substrate is limited, ARs may play a major role on the management of local environmental and eco-tourism issues. These man-made structures may allow human pressures over the NRs to be reduced (as more diving sites are available) and the local development of eco-tourism activities (e.g. diving, snorkelling and reef sightseeing on bottom glass boats). A lower pressure over the NRs will contribute positively to the natural rehabilitation of deteriorated habitats. However, the deployment of decommissioned vessels should only be considered within the scope of a programme aiming to manage the local coastal activities. Furthermore, the use of such structures should not be limited to decommissioned vessels, as more complex structures could possibly support the establishment of more species and providing them a wide range of uses. On the other hand, the use of ARs should not be promoted indiscriminately, and a management plan involving all the stakeholders should be developed to avoid conflicts and maximize their potential.
ACKNOWLEDGEMENTS
The authors thank Nuno Marques da Silva, Pedro G. Lino and Pedro Pousão-Ferreira for their help during data collection. Thanks are also due to the Manta Diving Center team for providing assistance during the fieldwork and Sophie Elliott for revising the text. We are also grateful to the three anonymous referees for their valuable comments that greatly improved the manuscript. This study was conducted within the scope of the project Rebuilding Nature—Criação de recifes artificiais em Cabo Verde, promoted by Manta Diving Center and sponsored by Soltrópico, Banco Comercial Atlântico, Grupo Oásis Atlântico, CV Telecom and Supersub-Beuchat. João Cúrdia benefits from a PhD grant (SFRH/BD/29491/2006) from the ‘Fundação para a Ciência e a Tecnologia’.