Introduction
Practice Effect (PE) refers to an improvement in performance observed on repeated administrations of the same, or similar, measure (Falleti, Maruff, Collie, & Darby, Reference Falleti, Maruff, Collie and Darby2006; Maassen, Bossema, & Brand, Reference Maassen, Bossema and Brand2008). PE is thought to reflect both explicit (i.e., declarative) learning of the test items, and the implicit (i.e., procedural) learning of the test taking strategy independent of the specific test content (Busch, Chelune, & Suchy, Reference Busch, Chelune and Suchy2005). Research has shown that the size of the PE is in part dependent on the characteristics of the test-taker, such that PE decreases with age (Roennlund, Loevden, & Nilsson, Reference Roennlund, Loevden and Nilsson2008; Thompson, Reference Thompson1997) and is smaller in people with lower IQs (Rapport, Brines, Axelrod, & Theisen, Reference Rapport, Brines, Axelrod and Theisen1997). These individual differences suggest that PE may reflect more than just a psychometric nuisance; rather, it may reflect a cognitive ability in its own right.
Consistent with this latter notion, research has shown that PEs generated by repeated administration of cognitive tests both within a single testing session (Darby, Maruff, Collie, & McStephen, Reference Darby, Maruff, Collie and McStephen2002) and 1 week after the initial testing (Cooper, Lacritz Weiner, Rosenberg, & Cullum, Reference Cooper, Lacritz, Weiner, Rosenberg and Cullum2004) were smaller than expected or absent among individuals with mild cognitive impairment (MCI). Because MCI represents a predictor of future cognitive decline and conversion to dementia, Duff and colleagues reasoned that small or absent PE could also predict future cognitive performance. Consistent with their hypothesis, they found that PEsFootnote 1 on memory, attentional, and processing speed measures contributed significantly to the prediction of cognitive performances on two follow-up visits 3 to 12 months later among MCI and HIV patients (Duff et al., Reference Duff, Beglinger, Schultz, Moser, McCaffrey, Haase and Paulsen2007). These findings have since been replicated, with PEs predicting 1-year follow-up scores in healthy, community-dwelling older adults with either amnestic MCI or intact cognition (Duff, Beglinger, Moser, Paulsen, Schultz, & Arndt, Reference Duff, Beglinger, Moser, Paulsen, Schultz and Arndtin press). However, some inconsistencies in findings exist, as another study found that MCI participants exhibited larger, not smaller, PEs than controls on two delayed recall measures (Duff et al., Reference Duff, Beglinger, Van Der Heiden, Moser, Arndt, Schultz and Paulsen2008). In fact, once practice was taken into account, some MCI participants’ performances became comparable to those of controlsFootnote 2.
Although the latter findings (Duff et al., Reference Duff, Beglinger, Van Der Heiden, Moser, Arndt, Schultz and Paulsen2008) could be interpreted as paradoxically demonstrating that MCI patients learned more than controls, an alternative explanation can be offered. In particular, given that the performances of some of the MCI participants were comparable to those of controls on the second test administration, it is possible that the effect observed in the latter study was not a reflection of greater improvement in performance due to extra learning, but rather a reflection of greater initial interference with performance caused by the test novelty. In other words, the MCI participants may have been more “thrown” than the controls by their unfamiliarity with the tests, requiring multiple test administrations to overcome this initial effect.
The evidence for deleterious effects of novelty on task performance among individuals who are on a declining neurocognitive trajectory comes from several lines of research. First, it has been repeatedly demonstrated by functional imaging research that task novelty requires extra cognitive processing, evidenced by greater and more wide-spread brain activation early on during task performance (Brovelli, Laksiri, Nazarian, Meunier, & Boussaoud, Reference Brovelli, Laksiri, Nazarian, Meunier and Boussaoud2008), followed by reduced demands on working memory systems once a task becomes familiar (Jansma, Ramsey, Slagter, & Kahn, Reference Jansma, Ramsey, Slagter and Kahn2001). Second, it is now well understood that cognitive reserveFootnote 3 serves as a protective factor against cognitive decline despite neuropathological changes in the brain (Andel, Vigen, Mack, Clark, & Gatz, Reference Andel, Vigen, Mack, Clark and Gatz2006; Corral, Rodriguez, Amenedo, Sanchez, & Diaz, Reference Corral, Rodriguez, Amenedo, Sanchez and Diaz2006; Stern, Reference Stern2002). Cognitive reserve can also be viewed as an extra cognitive buffer that protects not only against the effects of neuropathology, but also against the deleterious effects of temporary increases in task demands, such as the presence of distractors, fatigue, unfamiliarity with the task, and stress levels (Garrett, Grady, & Hasher, Reference Garrett, Grady and Hasher2010). Third, decreases in cognitive reserve are associated with increased and more wide-spread brain activation (Dickerson et al., Reference Dickerson, Salat, Greve, Chua, Rand-Giovannetti, Rentz and Sperling2005; Lenzi et al., Reference Lenzi, Serra, Perri, Pantano, Lenzi, Paulesu and Macaluso2009), thought to reflect an underlying biological marker of cognitive inefficiency, and/or greater cognitive effort. In fact, even the simple act of verbal comprehension shows more wide-spread functional magnetic resonance imaging (fMRI) activation among individuals with amnestic MCI or mild Alzheimer’s disease (Bosch et al., Reference Bosch, Bartres-Faz, Rami, Arenaza-Urquijo, Fernandez-Espejo, Junque and Molinuevo2010), suggesting that even processing the instructions for a new task is more taxing for individuals who are on a declining trajectory.
Taken together, research suggests that (a) dealing with novelty requires extra cognitive resources, (b) experiencing preclinical neurocognitive decline also requires extra cognitive effort to achieve performance on par with expectations, and (c) the extra cognitive demands imposed simultaneously by task novelty on the one hand and depleted cognitive reserve on the other may well overwhelm the limited available resources among individuals who are on a trajectory of a preclinical neurocognitive decline. In turn, when resources are overwhelmed, a temporary decrement in performance may occur as a task is first introduced, followed by a rebound in performance as task familiarity increases. Such temporary decrements followed by a rebound likely contribute, at least in some cases, to what is typically considered the effect of practice (in the form of improved performance on subsequent trials).
The purpose of the present study was to examine whether the inability to benefit from practice on the one hand and the susceptibility to the deleterious effects of novelty on the other could serve as two independent predictors for future cognitive decline. To that end, we conducted two screenings of cognitive status approximately 1 year apart in a sample of community-dwelling older adults who expressed some concerns about their cognition. To assess the participants’ susceptibility to the effects of novelty and their ability to learn from practice, we administered a computerized motor learningFootnote 4 task that generates indices of (a) the deleterious effect of task novelty on motor planning latencies and (b) motor learning capacity across several practice trials (Suchy, Derbidge, & Cope, Reference Suchy, Derbidge and Cope2005; Suchy & Kraybill, Reference Suchy and Kraybill2007). We examined these two indices as predictors of future decline in cognition, while controlling for other potential confounds, including demographic characteristics and baseline cognitive performanceFootnote 5, consistent with methodology used in prior research on performance change (Attix et al., Reference Attix, Story, Chelune, Ball, Stutts, Hart and Barth2009; Duff et al., Reference Duff, Beglinger, Schultz, Moser, McCaffrey, Haase and Paulsen2007). We hypothesized that (a) larger Novelty Effects (NE) and poorer Learning (LRN) would be associated with future cognitive declines, and (b) NE and LRN would be mutually dissociable, representing two independent predictors.
Method
Participants
Seventy-five Caucasian older adults were originally recruited from the Salt Lake City community for this prospective cohort study, which advertised (via flyers and newspaper advertisements) seeking individuals who had concerns about their cognition but lived independently. Exclusion criteria accessed via self-report included color blindness, uncorrected vision or hearing problems, difficulty using the right hand, left-handedness, moderate to severe health problems, and a diagnosis of dementia (dementia was an exclusion criterion at baseline only). No participants had a history of brain injury or brain tumor. Some participants reported “mild” chronic health problems, including hypertension (n = 30), heart disease (n = 5), chronic obstructive pulmonary disease (n = 3), sleep apnea (n = 10), small stroke (n = 6), and seizure disorder (n = 2).
All 75 participants underwent baseline testing, but only 50 participants (66%) returned for follow-up testing that took place approximately 17 months after the initial evaluation. Attrition rate was in line with similar prospective cohort studies (Niti, Yap, Kua, & Ng, Reference Niti, Yap, Kua and Ng2009; Stewart, Rand, Muldoon, & Kamarck, Reference Stewart, Rand, Muldoon and Kamarck2009). Attrition was due to participants not returning for follow-up testing for unspecified reasons (n = 11), being unreachable (e.g., disconnected phone number; n = 7), having other personal obligations such as care-giving responsibilities (n = 3), feeling that it was too far to travel (n = 2), and functional changes that made it too difficult to participate (i.e., onset of dementia; n = 2). Participants who completed follow-up testing were comparable to dropouts in terms of age, education, gender, and depression scores. The dropouts did, however, have significantly lower scores on the baseline Mattis Dementia Rating Scale as compared to those who returned, t(73) = 3.87, p < .001. See Table 1 for a summary of participant characteristics. Additional analyses on the characteristics of the dropouts, as they relate to the present study, are presented in the Supplementary Analyses section.
Demographic, depressive, cognitive, and health characteristics of the sample divided by return status

Note. M = mean; SD = standard deviation; DRS-2 = Mattis Dementia Rating Scale-2nd edition; GDS = Geriatric Depression Scale.
**Values differ at p < .001.
Procedures
Participants were screened over the telephone at both the initial and follow-up time points regarding exclusion criteria. On the day of testing, participants underwent informed consent procedures, followed by administration of the assessment measures (listed below). Participants received $30 for the initial session and $20 for the follow-up session (the follow-up testing lasted 2 hours, whereas the initial testing lasted 3 hours, as additional instruments were administered at baseline as part of a larger study). Participants were also provided brief feedback regarding their cognitive and depression screening results. This study and its procedures were approved by the University of Utah Institutional Review Board.
Instruments
Cognitive status and cognitive decline
Cognitive status was screened at both time points using the Mattis Dementia Rating Scale 2 nd edition (DRS-2; Mattis, Jurica, & Leitten, Reference Mattis, Jurica and Leitten1988), which is a global measure of general cognitive status and specifically evaluates attention, abstraction, visual-constructional abilities, initiation and perseveration, and verbal and nonverbal short-term memory. We operationalized cognitive change as the difference between the baseline and the follow-up DRS-2 total raw scoresFootnote 6, adjusted for the test–retest interval. Specifically, we first subtracted the DRS-2 total raw score at baseline from the DRS-2 total raw score at follow-up, and then divided the difference by the given participant’s test–retest interval (expressed in years). These scores then reflected annualized rate of change, in which all participants’ change scores were equated regardless of their actual test–retest interval.
Depression screening
Depression was screened using the Geriatric Depression Scale (GDS; Yesavage, Reference Yesavage1988), a measure developed for use with older adults. It was included as a means of characterizing the depressive symptomatology of the sample.
Novelty effect (NE) and learning (LRN) assessment
NE and LRN were assessed using the Push-Turn-Taptap (PTT) Task from the BDS-EV battery (Suchy et al., Reference Suchy, Derbidge and Cope2005). In this task, participants are asked to learn four different sequences of increasing length that consist of different permutations of three different hand movements, using a specialized response console (Figure 1). All participants were able to learn all sequences within the allotted number of trials (i.e., 10 trials). In the present study, we used two scores generated by this task: (a) an index of the effect of novelty (NE), and (b) an index of learning (LRN). These are described below.
The figure depicts the Behavioral Dyscontrol Scale-Electronic Version (BDS-EV) response console. It was used in the present study to assess learning and the effect of novelty. The figure originally appeared in Suchy et al. (Reference Suchy, Kraybill and Larson2010). Understanding design fluency: Motor and executive contributions. Journal of the International Neuropsychological Society, 16(1), 26–37. Copyright 2010 by Cambridge University Press.

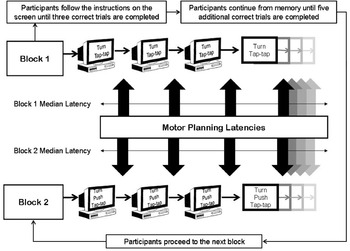
(a) NE: The NE was operationalized as the difference in the median motor planning latencies between the first and the second Block of the PTT task, with larger values representing increasingly deleterious effects of novelty. Motor planning latencies are assessed by measuring the amount of time (in ms) that elapses between completion of one trial and initiation of the next correctly executed trial (see Figure 2). Planning latencies have been shown to correlate with executive functioning, even after motor and processing speeds have been accounted for (Suchy, Kraybill, & Larson, Reference Suchy, Kraybill and Larson2010; Suchy & Kraybill, Reference Suchy and Kraybill2007). Please note that typically planning latencies are a function of the complexity, or the length, of a given sequence (Wright, Black, Immink, Brueckner, & Magnuson, Reference Wright, Black, Immink, Brueckner and Magnuson2004). Thus, progressively longer latencies are normally evident on Blocks 3 and 4 of the task, as the Blocks get progressively longer (Suchy et al., Reference Suchy, Derbidge and Cope2005; Suchy & Kraybill, Reference Suchy and Kraybill2007). However, past research has shown that the planning latencies on Block 1 of the PTT task are longer than those on Block 2 (Suchy et al., Reference Suchy, Derbidge and Cope2005; Suchy & Kraybill, Reference Suchy and Kraybill2007), despite the fact that Block 1 is the easiest (i.e., consisting of a sequence of only two hand movements, as compared to three hand movements on the Block 2). This paradoxical effect has been attributed to task novelty (Suchy & Kraybill, Reference Suchy and Kraybill2007). Greater NE values reflect a more deleterious impact of novelty on performance.
Fig. 2The BDS-EV Push-Turn-Taptap task (Suchy et al., Reference Suchy, Derbidge and Cope2005) requires that participants learn different sequences (or permutations) of three specified hand movements, using a specialized response console. The three hand movements are “Push” – pushing the joystick forward; “Turn” – turning the joystick clockwise; and “Taptap” – double-tapping on the white dome of the response console (Figure 1). The task begins with Block 1, in which a two-movement sequence is presented on the computer screen, until three correct trials are completed. Following these three learning trials, participants continue to perform the sequence from memory, until accomplishing five additional correct trials. This completes the Block 1 of the task. After completing Block 1, participants move on to Block 2. In Block 2, a new, longer sequence is presented on the computer screen, and the above-described process is repeated. There is a total of four Blocks, each characterized by different and progressively longer sequences (only the first two Blocks are presented in the figure). Mistakes are followed by an audible tone, along with the presentation of the correct sequence on the computer screen and the highlighting of the next movement to be performed. Motor planning latencies (which were used for computation of the effect of novelty) are indicated in the figure by the thick black vertical arrows, and reflect the preparation time before initiation of each correct trial (only latencies preceding correctly executed trials are considered). For each block, median latencies across all correct trials are computed (indicated in the figure by double-headed horizontal arrows). The effect of novelty is operationalized in this study as the difference between the median latencies for Block 1 minus median latencies for Block 2. Adapted from “Understanding design fluency: Motor and executive contributions,” by Y. Suchy, M. Kraybill, and J. G. L. Larson, 2010. Journal of the International Neuropsychological Society, 16(1), 26–37. Copyright 2010 by Cambridge University Press.

(b) LRN: LRN was operationalized as the number of errors across the four blocks of the PTT task, with greater values reflecting poorer performance. Because participants are given sample trials at the beginning of each block, a lack of errors demonstrates the ability to benefit from practice, whereas a high number of errors reflects a failure to learn from practice. This score reflects both declarative learning (as participants can rehearse the words that go with the sequence), as well as procedural learning (as participants repeat the same motor sequence several times), making it conceptually parallel to the types of learning presumably underlying PE (Busch et al., Reference Busch, Chelune and Suchy2005).

Results
Preliminary Analyses
Validity check
To ascertain that the PTT task performances behaved as expected in terms of generating motor planning latencies that were susceptible to the effect of novelty (Block 1), as well as the normal expected increase in latencies as a function of increased length of the motor sequence (Blocks 3 and 4), we conducted three paired t tests, comparing each consecutive pair of blocks. The results were consistent with expectation (all p values <.035). See Figure 3.
The figure demonstrates the size of the motor planning latencies on the Push-Turn-Taptap task (Suchy et al., Reference Suchy, Derbidge and Cope2005) across four learning blocks. As can be seen, the latencies become progressively longer from Block 2 to Block 4, reflecting increases in sequence length. However, latencies on Block 1 are longer than those on Block 2, despite the fact that the Block 1 sequence is the shortest. The difference between the latencies on the first two blocks has been interpreted as the effect of novelty (NE), and represents the operationalization of NE in the present study. The differences between each pair of adjacent blocks are significant at p < .05.

Zero order correlations
Zero order correlations among predictors and covariates are presented in Table 2. As can be seen, while LRN was associated with both baseline and retest DRS-2 scores, NE was not. Also, NE and LRN were correlated, such that greater ability to learn was associated with larger NE, demonstrating that the two processes are not entirely orthogonal (see Figure 4). This likely means that the inability to learn may have precluded participants from overcoming the initial effect of novelty evident on Block 1, resulting in a smaller improvement in motor planning on Block 2 and therefore, paradoxically, smaller NE.
Zero order correlations

Note. N = 50; DRS-2 = Mattis Dementia Rating Scale-2nd edition (higher values reflect better performance); GDS = Geriatric Depression Scale (higher values reflect greater number of depressive symptoms); NE = Novelty Effect reflecting the difference in motor planning latencies on the first minus the second block of a motor learning task (higher values reflect greater NE); LRN = Learning reflecting the number of errors made on a motor learning task (higher values reflect poorer learning).
The observed relationship between Novelty Effect (NE) and Learning (LRN) indices. As can be seen, larger NE was associated with fewer errors.

Prediction of Cognitive Change
To determine whether NE and LRN can predict a change in the DRS-2 scores across a one year interval, we conducted a hierarchical regression, using (a) the DRS-2 annualized change score as the criterion variable, and (b) DRS-2 baseline score (to account for the initial level of performance and susceptibility to regression to the mean) and age and education at baseline (to control for demographic influences on future cognitive change) as predictors on Step 1. Next, in one analysis, we added NE and LRN as predictors at Steps 3 and 4, respectively, and, in a separate analysis, we reversed the last two Steps (i.e., LRN and NE at Steps 3 and 4, respectively), to allow examination of unique contributions of NE and LRN as predictors. As can be seen in Table 3, while demographics and the initial level of performance did not account for a significant amount of variance in cognitive change, NE uniquely contributed approximately 9% of variance in future change above and beyond all the covariates, as well as above LRN. In contrast, LRN did not contribute to the model, regardless of whether it was entered on Step 3 or 4.
Hierarchical regression results showing the relative contribution of learning and novelty to prediction of annualized cognitive decline

Note. DRS-2 raw = Mattis Dementia Rating Scale-2nd edition total raw score; NE = Novelty Effect reflecting the difference in motor planning latencies on the first minus the second block of a motor learning task; LRN = Learning reflecting the number of errors across four motor learning task blocks.
a Step 1 is identical for both the analysis 1 and the analysis 2.
Of interest, the effect of NE increased somewhat when LRN was entered into the model first (Table 3), suggesting a possible moderating effect of LRN on NE. In other words, some variance in the presumed effect of novelty may have been accounted for by the capacity to learn from practice. However, when the statistical significance of this moderation was tested by entering an interaction term (i.e., NE*LRN) at Step 3 of the equation, the results did not reach significance, Fchange (1,45) = 1.52, p = .224, suggesting that this moderating effect was relatively negligible. Importantly, as mentioned above, NE accounted for variance in cognitive change, whether LRN was included in the model or not.
Classifying Participants
To determine whether larger NE would flag individuals who are at risk for cognitive decline, we first identified participants whose DRS-2 scores exhibited a reliable annualized decrement from baseline. To accomplish this, we used an empirically derived cut score based on the reliable change index (RCI) methodology (Chelune, Naugle, Lueders, Sedlak, & Awad, Reference Chelune, Naugle, Lueders, Sedlak and Awad1993). Specifically, it was recently demonstrated in a sample similar to ours and a comparable test–retest intervalFootnote 7 that a decline of 6 or more points on the DRS-2 raw scores represented a reliable change at the 5th percentile (Pedraza et al., Reference Pedraza, Smith, Ivnik, Willis, Ferman, Petersen and Lucas2007). This cut score identified 7 of the 50 participants (i.e., 14%) in our sample showing a reliable decrement in performance. The characteristics of the two groups (i.e., decliners and nondecliners) are presented in Table 4. As can be seen, the groups did not differ on any characteristics (all p values >.15), except for the follow-up DRS-2 score, t = 5.19(48), p < .001.
Demographic, depressive, and cognitive characteristics of the sample divided by cognitive decline status

Note. M = mean, SD = standard deviation; DRS-2 = Mattis Dementia Rating Scale-2nd edition; GDS = Geriatric Depression Scale.
*Values differ at p < .05. **Values differ at p < .001.
Although the presently observed base rate of decline (i.e., 14%) is considerably higher than would be expected in the general population and is statistically higher than the RCI base rate of 5%, χ2(1) = 4.71, p < .030, this relatively high base rate of decline is explained by the study’s active recruitment of individuals who had some concerns about their cognition. In fact, subjective complaints about cognition have been shown to be associated with higher base rates of decline at follow-up, despite normal scores at baseline (Geerlings, Jonker, Bouter, Ader, & Schmand, Reference Geerlings, Jonker, Bouter, Ader and Schmand1999; Schofield, Marder, Dooneief, & Jacobs, Reference Schofield, Marder, Dooneief and Jacobs1997).
Next, we conducted a Receiver Operating Characteristic (ROC) curve analysis, using the NE as the predictor and the cognitive retest status (i.e., decliners vs. nondecliners) as criterion. The results showed that NE reliably classified participants (area under the curve [AUC] = .817, p = .008), such that NE cut scores of greater than 103 ms identified correctly 6 of the 7 decliners (i.e., 86% sensitivity), and 27 of 43 nondecliners (i.e., 63% specificity).
Lastly, even though the moderating effect of LRN was negligible in the regression analyses, this effect could nevertheless play a role in participant classification. Thus, we examined the ability of the interaction term (i.e., the product of NE and LRN) to classify participants. The results showed that the interaction term was somewhat more successful than NE alone (AUC = .850, p = .003), such that the NE*LRN product scores greater than 1722 were associated with a sensitivity of 86% (correctly classifying 6 of 7 decliners) and specificity of 81% (correctly classifying 35 of 43 nondecliners). This means that in this prospective cohort study, individuals whose NE*LRN product was greater than 1722 had a relative risk of showing a reliable cognitive decline that was 15 times higher than those whose scores were below that cutoff (i.e., risk ratio = 15.43).
Supplementary Analyses: Dealing with Attrition
Given that the dropouts in this study had lower DRS-2 scores than returning participants already at baseline (Table 1), it is possible that the reason for their failure to return was that they were already on a declining trajectory, with an additional decline in cognition in the intervening period. If that is the case, then these individuals should also exhibit a greater NE. To examine this, we compared the NE for three groups: (1) dropouts (n = 25), (2) nondecliners (i.e., returners who did not decline cognitively; n = 43), and (3) decliners (i.e., returners who declined cognitively; n = 7). We conducted two planned comparisons, using NE as the dependent variable, and group membership (i.e., dropouts vs. nondecliners, and decliners vs. nondecliners) as the independent variable. As expected, the results showed that nondecliners had a smaller NE than both those whose cognition declined and those who dropped out (Mann-Whitney U = 55.00, p = .006, Z = 2.67 and Mann-Whitney U = 377.00, p = .041, Z = 2.04, respectively). Similar examination of the LRN variable failed to produce statistically significant results (p values >.394). See Figures 5 and 6.
The figure demonstrates the size of the Novelty Effect (NE; reflecting the difference in motor planning latencies between the first and the second blocks of a motor learning task) and the difficulty in Learning (LRN; reflecting the number of errors across four blocks of the motor learning task) for (a) participants who returned for follow-up testing and remained cognitively the same (“nondecliners”; n = 43), (b) participants who returned for follow-up testing and exhibited a reliable cognitive decline (“decliners”; n = 7), and (c) participants who dropped out of the study after the baseline assessment (“dropouts”; n = 25).

The figure demonstrates the size of the median motor planning latencies on the Push-Turn-Taptap task (Suchy & Kraybill, Reference Suchy and Kraybill2007) across four learning blocks for (a) participants who returned for follow-up testing and remained cognitively the same (“nondecliners”; n = 43), (b) participants who returned for follow-up testing and exhibited a reliable cognitive decline (“decliners”; n = 7), and (c) participants who dropped out of the study after the baseline assessment (“dropouts”; n = 25). As can be seen, both the dropouts and the decliners exhibited longer planning latencies than nondecliners on Block 1 (evident by nonoverlapping standard errors), despite having comparable latencies on the remaining blocks (evident by overlapping standard errors).

Lastly, we examined the NE of the two participants who explicitly stated that they could not return for re-testing due to onset of dementia. Both of these participants had NE above the cutting score of 103 ms (i.e., 229 and 242 ms) and NE*LRN product above the cutting score of 1723 (i.e., 4008 and 4850). Together, these findings lend some support to the suspicion that individuals who dropped out of the study did so in part due to declines in cognition.
Discussion
The present study examined whether susceptibility to the effects of novelty (NE) and the inability to learn from practice (LRN) can be used as markers for future cognitive decline. Consistent with expectations, the results showed that larger NE, as assessed via planning latencies on a motor learning task, was associated with greater cognitive decline (assessed approximately 17 months after the baseline assessment), accounting for variance in cognitive change scores above and beyond demographics, baseline cognitive status, and LRN. Furthermore, NE reliably classified participants into decliners (those showing a reliable decrease on the DRS-2) and nondecliners, with 86% sensitivity and 63% specificity.
In contrast, and contrary to expectation, LRN did not explain any variance in future cognitive change. However, LRN was negatively correlated with NE, and appeared to moderate the relationship between NE and future cognitive decline. Once this moderation effect was accounted for, the ability to classify participants improved somewhat (i.e., specificity improved from 63% to 81%, with sensitivity of 86%). Consequently, the hypothesis that NE and LRN are independent was only partially supported; NE independently predicted future cognitive decline, but LRN appeared to slightly moderate this relationship.
Of interest, although NE proved to be a reliable predictor of future cognitive decline, it was unrelated to the level of current or future cognitive functioning. In contrast, LRN correlated with the level of cognition at both time points, but did not predict future decline. These results highlight the fundamental difference between the two processes, such that LRN assesses cognitive abilities that are traditionally captured in the scope of neuropsychological assessments, whereas NE may tap into less-measured constructs (such as current level of cognitive reserve, neural efficiency, or the capacity to compensate for fluctuations in task demands).
Taken together, these findings offer promise for the utility of NE as a marker of preclinical neurocognitive changes that eventually convert into clinically notable cognitive declines. These findings may also offer a potential explanation for the apparent inconsistencies in the literature regarding the utility of small or absent PE as a marker of future cognitive decline, and suggest directions for future research.
Theoretical Implication: Deconstructing the Practice Effect
When an improvement in performance takes place due to repeated exposure to a task, such improvement is referred to as PE. However, any time PE is present, it could technically be conceptualized as either a result of LRN due to repeated exposure, or a result of NE interfering with performance upon the initial exposure, followed by a rebound. However, LRN and NE are not just two sides of the same coin. In fact, based on the present findings, LRN and NE appear to represent two largely separate constructs, which together may contribute in a dynamic way to improvements in test scores known as PE.
In particular, one could speculate that in healthy individuals, second exposure to a task may be associated with an improvement that is to a small extent a function of NE, and to a large extent a function of LRN. That some NE is present among cognitively healthy individuals is known from both functional imaging research (Brovelli et al., Reference Brovelli, Laksiri, Nazarian, Meunier and Boussaoud2008), as well as from behavioral research conducted with the present task (Suchy & Kraybill, Reference Suchy and Kraybill2007).
As a person’s cognitive reserve declines, the normal effect of novelty may exert increasingly greater demands on cognitive processing, evidenced not only by the increasingly wide-spread fMRI activation observed in such individuals (Dickerson et al., Reference Dickerson, Salat, Greve, Chua, Rand-Giovannetti, Rentz and Sperling2005; Lenzi et al., Reference Lenzi, Serra, Perri, Pantano, Lenzi, Paulesu and Macaluso2009), but also by measurably slower planning latencies early on during task performance (observed in the present study). Furthermore, because LRN in the present study did not predict future decline, the present results suggest that as NE exerts greater influence, learning may still be relatively intact, potentially leading to greater gains in scores upon second exposure to a given test. This, in fact, was found in at least one study (Duff et al., Reference Duff, Beglinger, Van Der Heiden, Moser, Arndt, Schultz and Paulsen2008).
As cognition continues to decline, improvement on test re-administration may begin to decline as well (Cooper et al., Reference Cooper, Lacritz, Weiner, Rosenberg and Cullum2004; Darby et al., Reference Darby, Maruff, Collie and McStephen2002), due to the diminished ability to benefit from practice. It is also possible that at some point along the cognitive decline trajectory, NE may no longer play a role, as any given test may present as equally overwhelming regardless of how many times it is administered. For an illustration of these theoretical relationships, see Figure 7. Future research may focus on the separate contributions of NE and LRN to PE, as well as the potentially curvilinear relationship between PE and cognitive aging.
The figure demonstrates a hypothetical model of dynamical changes in the size of the practice effect (PE), with variable contributions from novelty effect (NE) and learning (LRN) as a function of cognitive decline.

In addition to considering the effect of novelty, future research also needs to consider that PE likely consists of both implicit (procedural) learning and explicit (declarative) learning. The degree to which these two types of learning take place during re-administration of any given task is not understood, but is likely not uniform across different measures. These two types of learning processes are also known to be differentially affected for different clinical populations, such that, for example, the declarative aspect tends to be more affected in early Alzheimer’s disease, whereas the procedural aspect tends to be more affected in early Parkinson’s disease. Thus, for the LRN component of PE to be a viable marker for future decline, it needs to be examined more cautiously, with careful analysis of PE and its components, as they relate to different measures and different clinical populations.
Clinical Implications
Clinically, the challenge has been not only to identify individuals who are on a trajectory of pathological neurocognitive decline (typically represented by the MCI diagnostic category), but also to identify individuals whose cognitive decline is still masked by sufficient cognitive reserve, that is, before the emergence of clinical symptoms. The interest in the latter group will only continue to grow as new pharmacologic interventions for neurodegenerative diseases become available. The present paradigm (i.e., the assessment of NE using the PTT task) offers promise for such clinical applications.
First, NE reflects a very discrete aspect of performance, one that is not typically quantified as part of clinical assessment, as it is generally subsumed into a more global score (i.e., the brief latency before initiation of movement represents a negligible fraction of the overall speed with which a task is completed). As such, it gets at an aspect of performance for which patients likely cannot consciously compensate, but which nevertheless emerges as a predictor of future decline, possibly reflecting a depletion of cognitive reserve. Given that such subtle NE is not detected by traditional assessment methods offers an explanation for why decreases in neural efficiency evidenced by functional imaging do not necessarily translate into a measurable cognitive compromise (Ernst, Yakupov, Nakama, Crocket, Cole, Watters et al., Reference Ernst, Yakupov, Nakama, Crocket, Cole, Watters, Ricardo-Dukelow and Chang2009; Rypma, Berger, Genova, Rebbechi, & D’Esposito, Reference Rypma, Berger, Genova, Rebbechi and D’Esposito2005).
Second, although NE likely can be assessed in a variety of ways, using motor planning latencies may represent a particularly sensitive method. Motor planning refers to an abstract plan that contains both general information about the intended goal and specific information about the neuromuscular control that will be required (Keele, Reference Keele1968). It has been shown that longer movement sequences require more planning time (Keele, Reference Keele1981; Klapp, McRae, & Long, Reference Klapp, McRae and Long1978; Suchy & Kraybill, Reference Suchy and Kraybill2007; Wright et al., Reference Wright, Black, Immink, Brueckner and Magnuson2004), and that task novelty increases motor planning latencies, likely due to the added “complexity” of processing task instructions and converting those into a novel action plan (Suchy et al., Reference Suchy, Derbidge and Cope2005; Suchy & Kraybill, Reference Suchy and Kraybill2007). Interestingly, language (i.e., instructions) comprehension has been shown to require extra neural processing among cognitively compromised individuals (Bosch et al., Reference Bosch, Bartres-Faz, Rami, Arenaza-Urquijo, Fernandez-Espejo, Junque and Molinuevo2010), and transfer of learned information into motor action has been shown to be impaired among individuals with mild preclinical hippocampal atrophy (Gluck, Myers, Nicolle, & Johnson, Reference Gluck, Myers, Nicolle and Johnson2006). Additionally, recent evidence suggests that sensorimotor connectivity is altered among MCI individuals (Agosta et al., Reference Agosta, Rocca, Pagani, Absinta, Magnani, Marcone and Filippi2010). Together, these three mechanisms suggest that motor planning latencies may be particularly sensitive to NE among individuals who are on a trajectory of neurocognitive decline.
Although NE, as assessed in the present study, proved useful in predicting future decline, the effectiveness of this variable needs to be pitted against other potential effects of novelty already embedded in existing clinical measures. For example, TBI patients exhibit steep learning curves on verbal learning tasks, marked by very poor recall upon the first exposure to a given word list, followed by a successful rebound on subsequent exposures (Geary, Kraus, Pliskin, & Little, Reference Geary, Kraus, Pliskin and Little2010). It is unclear whether this effect represents problems with encoding (as it is often interpreted), or an effect of novelty. Regardless, the utility of such a profile in predicting cognitive declines should be examined in future research.
Limitations
The principal limitation of the present study is the approximately 33% attrition rate, resulting in a relatively modest sample size of 50 participants at the time of follow up testing. However, this rate of attrition is common in prospective cohort studies of older adults (Niti et al., Reference Niti, Yap, Kua and Ng2009; Stewart et al., Reference Stewart, Rand, Muldoon and Kamarck2009). The attrition rate may have been caused by cognitive decline among some of the participants who did not return. This interpretation is consistent with the dropouts’ lower DRS-2 scores already at baseline. Additionally, dropouts as a group showed NEs that were (a) above the empirically derived cutting score and (b) comparable to those seen in participants who exhibited cognitive declines at follow-up.
Additionally, it is not clear to what extent the present findings would generalize to other measures of novelty, or whether LRN, as assessed in this study, is comparable to other measures of procedural and declarative learning. Replications with the presently employed instrument used in conjunction with other measures of NE and LRN would help clarify this question.
Lastly, it is not clear whether the present results would generalize to other populations. For example, given the relatively low specificity (61% for NE and 81% for NE*LRN), it is possible that false positive rates would be unacceptably high in a sample of independent adults who do not express concerns about their cognition. A lack of such a control group in the present study represents a significant weakness. Alternatively, the specificity rates may improve in a clinical sample, such as individuals who seek medical attention for cognitive problems or individuals diagnosed with MCI. By the same token, different MCI subtypes may also respond differently to our task, and may exhibit differential rates of decline. These questions need to be examined in future research.