Implications
We present a quantitative review on the effects of intake and dietary composition on production and molar percentages of volatile fatty acids in the rumen. This study will be used for the development of new feed evaluation systems based on nutrient fluxes. An understanding of the amount and composition of nutrients absorbed by the animal has implications for a wide range of animal functions, including efficiency, quality of products, excretion of pollutants and welfare.
Introduction
The volatile fatty acids (VFA) produced by microbial fermentation in the rumen are the main source of energy absorbed by the wall of the digestive tract of ruminants. The amount and profile of VFA formed in the rumen has consequences for the efficiency of energy utilization, production of methane, risks of ruminal acidosis and composition of animal products. The partition of fermented carbon (C) between VFA results from interdependent factors, that is, the type of fermented substrates, the composition of the microbial population and the environmental conditions that regulate microbial metabolism. The stoichiometry of fermentations is governed by enzymatic laws, microbial species and thermodynamical principles. Several attempts have been made to represent stoichiometry of fermentations using mechanistic or empirical modelling approaches, as reviewed by Nozière et al. (Reference Nozière, Ortigues-Marty, Loncke and Sauvant2010b). However, such models are still unsatisfying in predicting VFA profiles in the rumen (Bannink et al., Reference Bannink, De Visser and Van Vuuren1997; Offner and Sauvant, Reference Offner and Sauvant2004a). Causes of inaccuracy and differences between models can be numerous, including representativity of the data sets, statistical methods, assumptions made for derivation of the stoichiometric estimates (e.g. efficiency of microbial synthesis, VFA clearance rates from the rumen). The estimation of the supply of individual VFA to the intermediary metabolism thus remains a challenge in ruminant nutrition. Loncke et al. (Reference Loncke, Ortigues-Marty, Vernet, Lapierre, Sauvant and Nozière2009), by applying a meta-analysis approach to the data on VFA portal net fluxes, obtained promising results, although this study was limited by the data available. A similar approach needs to be explored at the rumen level. Most data on VFA are concerned with their concentration in the rumen fluid, but they do not reflect their produced or absorbed fluxes (Sutton et al., Reference Sutton, Dhanoa, Morant, France, Napper and Schuller2003). The published data on in vivo VFA production rate (PR) in the rumen measured using the isotope dilution technique, which is recognized as the most reliable method (France and Dijkstra, Reference France and Dijkstra2005), have been gathered in a database (Nozière et al., Reference Nozière, Glasser, Martin and Sauvant2007). In addition, a large number of publications reporting simultaneous measurements of total tract or ruminal digestion and VFA molar percentages in the rumen, have been gathered in a separate database (Sauvant et al., Reference Sauvant, Martin and Mertens2000). By applying a meta-analysis approach to these data, we aim to derive empirical relationships on the effects of feed intake and dietary composition on in vivo total VFA-PR, on individual VFA molar percentages in the rumen and on the relationships between the molar percentages of individual VFA produced and those measured in the rumen fluid. In this study, we focused on the response laws covering a wide range of feeding situations, even if additional more targeted approaches may be useful in practice for predicting purposes.
Material and methods
Three distinct databases, containing results from international publications measuring the total tract or ruminal digestion, VFA-PR or VFA molar percentages in the rumen, were used. All databases contained available data related to animals (i.e. species, body weight (BW) and physiological stage), intake and dietary composition, fermentation parameters, digestive fluxes and their associated measurement methods. Within each publication, treatments were coded within an experimental group according to their experimental factor (Vernet et al., Reference Vernet, Lapierre, Nozière, Léger, Sauvant and Ortigues-Marty2005).
Response laws of ruminal total VFA-PR to intake and diet composition (VFA-Prod database)
The first database, VFA-Prod (73 publications, 250 treatments, Nozière et al., Reference Nozière, Glasser, Martin and Sauvant2007), was used for ruminal total VFA-PR models. It contains the results of all the available publications (based on the query of online bibliographic databases) reporting measurements of in vivo ruminal VFA-PR by the isotope dilution techniques. The objective was to assess the relationships between the amount of digestible or fermentable organic matter (OM) intake and the total VFA-PR. Only experiments related to changes in intake and/or dietary composition (excluding supply of buffer or additives) were considered, that is, 203 dietary treatments in 77 experiments on sheep (Nt = 96), growing cattle (Nt = 45), buffaloes (Nt = 41), lactating cows (Nt = 14), dry cows (Nt = 6) and goats (Nt = 1).
As it was not systematically reported in the publications, the chemical composition and the nutritional values of the feedstuffs used in all experiments were estimated using the INRA Feed Tables (2007). The estimated chemical composition and nutritional values of the diets were calculated assuming additivity. The differences between the estimated values and the values reported by the authors were systematically assessed for organic matter digestibility (OMD), for cell wall (including neutral detergent fibre NDF, ADF or crude fibre and crude protein (CP), which were reported for 49%, 40% and 62% of treatments, respectively. The regressions between estimated (X) and reported (Y) values did not significantly differ from the first bisector. As models were built using a within-experiment approach, the relationships between X and Y were also assessed by GLM analyses including publication as a fixed effect (Loncke et al., Reference Loncke, Ortigues-Marty, Vernet, Lapierre, Sauvant and Nozière2009). Intercepts did not significantly differ from 0, slopes were close to 1 (0.93 ± 0.06, 1.12 ± 0.15 and 0.82 ± 0.05) and root mean square error (RMSE) was close to the average uncertainties of determination (27 g/kg OM, 53 and 17 g/kg dry matter (DM)) for OMD, cell wall components and CP, respectively.
The empirical response laws of total VFA-PR to intake and diet composition were examined as described in the Models section. Explanatory variables were chosen according to several criteria: their strong association with VFA-PR, the amount and distribution of available data and the possibility of estimating these variables from feed tables. Two explanatory variables were compared for their ability to describe the variations of the total VFA-PR in the rumen, that is, the daily intake of digestible OM (dOM) and rumen fermentable organic matter (RfOM), all expressed per kilogram BW. Once a first model was adjusted with the main explanatory variable, we assessed whether other factors (interfering factors) could be added in the model, by testing their effects on the residuals of the model, least square means (LSMeans) and individual slopes of the experiments. The interfering factors tested were: DM intake (DMi), the dietary proportion of the concentrate, dOM, RfOM, NDF, digestible NDF (dNDF), starch, ruminally digested starch, digestible cell content, CP, fermentable CP and Rmic (criterion reflecting equilibrium between degradable N and energy available for microbial synthesis in the rumen, calculated according to INRA, 2007). In addition, since there were large variations in total VFA-PR expressed per gram dOM or per gram RfOM intake (the ratios of total VFA-PR/dOM and total VFA-PR/RfOM), we assessed the effects of DMi (g DM/day per kg BW), dietary content and composition of dOM (i.e. dOM, dNDF/dOM ratio), CP content and Rmic on these ratios.
Estimation of ruminal total VFA-PR from measured RfOMa (DOMR database)
The second database, DOMR (237 experiments, 599 treatments), was used to calculate the total VFA-PR from measured values of apparent RfOM, called RfOMa (OM intake – duodenal OM). This database has already been used to make a comparative evaluation of rumen models (Offner and Sauvant, Reference Offner and Sauvant2004a). It consists in part of a larger database on digestion in bovines (BoviDig, Sauvant et al., Reference Sauvant, Martin and Mertens2000), and is restricted to results of publications reporting simultaneous measurements of RfOMa and molar proportion of VFA in the rumen of bovines. The RfOMa represents the OM transformed into VFA and gas. Therefore, RfOMa was interpreted in terms of C flows assuming contents of 37 and 45 mmol of C per gram of carbohydrate and protein, respectively. To calculate VFA and gas production, it was considered that the associated C flow as gas is equal to 0.33, 0.0, 0.33 and 0.15 of C flow as acetate (C2), propionate (C3), butyrate (C4) and minor VFA, respectively.
Response laws of individual VFA molar percentages in the rumen fluid to intake and diet composition (VFA-Conc database)
For individual VFA molar percentage, a third database was used, the VFA-Conc database, also extracted from the BoviDig database (Sauvant et al., Reference Sauvant, Martin and Mertens2000). This VFA-Conc database (133 publications, 375 treatments) contained results of publications reporting simultaneous measurements of both digestive fluxes (total tract apparent digestibility of OM and NDF and/or duodenal fluxes of OM, NDF, CP, starch) and molar proportions of VFA in the rumen fluid of bovines. The empirical response laws of individual VFA molar percentages in the rumen to intake and diet composition were examined as described in the Models section. Previous results identified the ruminally digested NDF (RdNDF)/RfOM ratio, which reflects the balance between the cell walls and cell contents degraded in the rumen, as the best explanatory variable of the VFA molar percentages in the portal drainage over a wide diversity of diets (Loncke et al., Reference Loncke, Ortigues-Marty, Vernet, Lapierre, Sauvant and Nozière2009). This ratio was measured for only 25% of experiments within the VFA-conc database, but did not significantly differ from dNDF/dOM that was measured for all experiments (RdNDF/RfOM = 0.02ns (±0.02) + 0.98*** (±0.06) dNDF/dOM; Nexp = 35; Nt = 87; RMSE = 0.05; R 2 = 0.94). The dNDF/dOM ratio was thus chosen as the main variable explaining changes in the molar proportion of individual VFA. The interfering factors tested were: DMi, ruminal pH and ruminal starch digestibility (RSD). In addition, since the intensity of fermentations could affect VFA profiles, we assessed the relationship between the total VFA-PR and the molar proportion of individual VFA, using the VFA-Prod database.
Individual VFA molar percentages: production v. concentration in the rumen fluid (VFA-Prod database)
The relationship between the molar percentages of individual VFA produced and measured in the rumen fluid was also assessed using the VFA-Prod database.
Determination of stoichiometric coefficients (DOMR database)
The stoichiometric coefficients of individual VFA production from NDF, starch, CP and the other fermented fractions were assessed using the DOMR database. The PR of each VFA was calculated assuming that the total VFA/RfOM ratio was 8.03 mmol/g (obtained from VFA-Prod database, see the Results section), and that the within-experiment changes in the percentages of VFA produced equalled the changes observed in their percentages in the rumen fluid (see the Results section). For each VFA, the relationship between the calculated PR and the measured fermented fractions in the rumen was determined by the GLM procedure. The number of fraction of RfOM, extracted from the publications, was either 2 (NDF and OM–NDF, Nexp = 96, Nt = 375), 3 (NDF, starch and OM–NDF–starch, Nexp = 48, Nt = 188) or 4 (NDF, starch, CP and OM–NDF–starch–CP, Nexp = 46; Nt = 179). For each fraction of RfOM and each individual VFA, the stoichiometric coefficient was calculated as the ratio between the response of the individual VFA and the response of the total VFA, to the amount of fermented substrate.
Models
Descriptive statistics (mean, s.d., range of values) were generated for each variable, as well as the matrix of correlation between all the nutritional criteria. Normal distribution of data and homogeneity of variances were tested by Shapiro–Wilk and Levene tests, respectively. Relationships between Y (total VFA-PR, molar percentages of VFA, C2/C3) and the explanatory variables (Xj) were studied with variance–covariance models, using the GLM procedure (Minitab, version 14):

where α is the overall intercept, αi is the effect of the experimental group i on the intercept α, β 1j and β 2j are the linear and quadratic terms for the explanatory variables, Xj. For each model, we report the number of experiments (Nexp) and number of treatments (Nt) used for the adjustment of the model.
Considering that the experimental conditions were specific to each study and not randomly distributed, the experimental group was used as a fixed factor in the models. In addition, because calculation of reliable within-experiment responses requires a minimum variation on each explanatory variable within an experimental group (Sauvant et al., Reference Sauvant, Schmidely, Daudin and St-Pierre2008) minimal variations were determined for each explanatory variable, depending on both the known measurement uncertainties and the meta-design. This induced the elimination of <15% of the treatments depending on the explanatory variable. Once models were generated from the main explanatory variable, additional analysis was carried out to test whether these models could be improved by including additional explanatory variables (interfering factors). This heuristic process (Sauvant et al., Reference Sauvant, Schmidely, Daudin and St-Pierre2008) included regressions of individual within-experiment slopes, residuals and LSMeans of the model, against the major putative interfering factors, corresponding to variables describing intake level and diet composition. For qualitative interfering factors (e.g. analytical methods), ANOVA was performed on the LSMeans to test these factors. Thorough graphical examinations were carried out at each stage of the meta-analysis process. The fit of each relationship was examined by studying the studentized residuals of the model and normality of the residuals. Outliers were identified first on the basis of studentized residuals (less than −3 or greater than 3) and then by the leverage effects. Considering that statistical outliers may reflect interesting specific experimental conditions, they were considered in the analysis of interfering factors.
Results
Meta-design of the databases
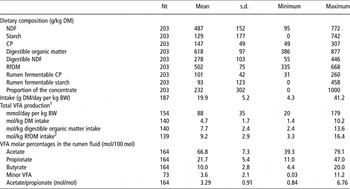
In the VFA-Prod database, experimental treatments presented wide variability in intake level and a diversity of dietary composition (Table 1). The DMi, expressed as g DM/day per kg BW, differed between species and physiological stages (P < 0.001), but was not significantly correlated to dietary composition criteria, that is, CP (P = 0.74), NDF (P = 0.50), starch (P = 0.19), dOM (P = 0.24), RfOM (P = 0.26), dNDF/dOM (P = 0.86). Experiments were focused on the effects of DMi (Nexp = 14, Nt = 36), of dietary composition (Nexp = 24, Nt = 71) or of both (Nexp = 27, Nt = 84). The other experiments (Nexp = 12) involved only one dietary treatment. Eighty percent of the measurements were made under steady-state conditions (i.e. ⩾8 meals/day). The VFA-PR measurements were made using continuous infusion of tracers for 57% of the treatments (v. 43% using pulse dose). The total VFA-PR was determined for 165 treatments, with 70% using only one tracer (mostly 1-14C or 1,2-14C acetate) assuming that total VFA was a homogenous pool and 30% using two or more, often three isotopes. The total VFA-PR exhibited wide variability when expressed in mmol/day per kg BW (20 to 179, mean = 88 ± 35). In addition, the efficiency of total VFA-PR widely varied among treatments (2.4 to 13.6 mmol/kg dOM intake, mean = 7.7 ± 2.4). The individual VFA-PR was determined in 63 dietary treatments for C2 (mostly with 1-14C or 1,2-14C), 44 dietary treatments for C3 (mostly with 1-14C or 1,2-14C) and 42 dietary treatments for C4 (mostly with 1-14C or 2,3-3H). The VFA molar percentages (mol/100 mol) in the rumen fluid presented wide variability, 39% to 79% for C2, 11% to 47% for C3, 4% to 20% for C4, and 0.03% to 11.2% for the minor VFA.
Description of the VFA-Prod database used for the meta-analysis of ruminal production of VFA
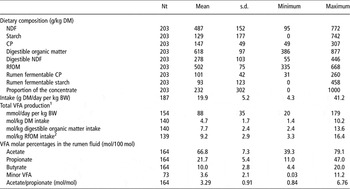
VFA = volatile fatty acids; Nt = number of treatments; DM = dry matter; RfOM = rumen fermentable organic matter.
Minor VFA = total VFA − acetate − propionate − butyrate. It includes mainly valerate, iso-butyrate and iso-valerate.
1Five treatments (two publications) excluded due to aberrant values.
2One treatment suppressed due to inaccurate estimation of RfOM.
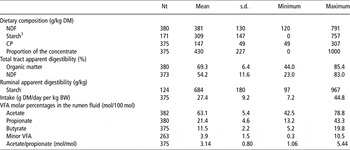
In the VFA-Conc database, sufficient variations in measured dNDF/dOM (|Residuals|>0.01) were observed in 136 experiments (381 dietary treatments). There was a wide range of variability in intake level and dietary composition (Table 2). Experiments mainly quantified the effects of DMi (Nexp = 21, Nt = 43), proportion of the concentrate (Nexp = 83, Nt = 202) or starch source (Nexp = 51, Nt = 107). The VFA molar percentages (mol/100 mol) in the rumen fluid widely ranged from 44% to 79% for C2, 13% to 44% for C3, 5% to 20% for C4, 0.3% to 10.5% for the minor VFA.
Description of data used for the meta-analysis of individual VFA molar proportion in the rumen (VFA-Conc database)
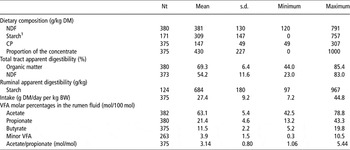
VFA = volatile fatty acids; Nt = number of treatments; DM = dry matter.
Minor VFA = total VFA − acetate − propionate − butyrate. It includes mainly valerate, iso-butyrate and iso-valerate.
1Only experiments with at least one diet containing starch.
In the DOMR database, the RfOM fraction was measured for 237 experiments (599 treatments). The dietary content of RfOM represented 402 ± 109 g/kg DM and RfOM intake averaged 10.59 ± 3.75 g/day per kg BW. These data were mainly issued from experiments focused on the proportion of the concentrate (Nexp = 43, Nt = 105), starch source (Nex = 55, Nt = 114), N level (Nexp = 75, Nt = 186) and particle size (Nexp = 25, Nt = 52).
Response laws of ruminal total VFA-PR to intake and diet composition
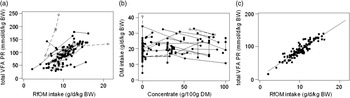
The total VFA-PR (mmol/day per kg BW) was linearly related to dOM and RfOM intake (g/day per kg BW). The model based on RfOM intake is presented in Figure 1. The models were adjusted according to the following equations:


Within-experiment relationship between the estimated (INRA tables) rumen fermentable organic matter (RfOM) intake and the observed total volatile fatty acids (VFA) production rate (PR): raw data (a), associated meta-design (b) and regression model with residuals inter-experiment variations excluded (c): Total VFA-PR = 8.9ns (±6.6) + 8.03*** (±0.64), RfOM intake (Nexp = 35; Nt = 107; R 2 = 0.89; Syx = 11.8). On (a) and (b), statistical outliers are presented in dotted lines and excluded from the model. Results from the VFA-Prod database.

The slopes suggested an average increase of 6.13 and 8.03 mol total VFA/kg dOM and RfOM intake, respectively. The overall intercepts were positive in both models but did not significantly differ from 0 in the RfOM intake model. Although the R 2 was comparable for both models, the contribution of the covariable to the explained variability was slightly higher for the RfOM intake model (27%) than for the dOM intake model (22%). The RMSE was slightly lower for the RfOM than for the dOM intake model. The CV of the slopes was low for both models (8%) and no significant interfering factor was shown on the slopes. Changes in dOM or RfOM intake were caused by changes in DMi (25% of experiments) or in dietary composition (27% of experiments) or both (48% of experiments). For both models, the average slope and intercept did not significantly depend on the cause of changes in dOM or RfOM intake. Compared to aggregated models based on dOM or RfOM intake, precision of models dissociating respective effects of DMi (g/day per kg BW) and dOM or RfOM contents (g/kg DM) on total VFA-PR were similar (not shown).
Factors related to dietary N level (CP, fermentable CP, Rmic) were positively related to the LSMeans and residuals of both dOM and RfOM intake models. However, in experiments in which dietary N level was the experimental factor (Nexp = 28, Nt = 74), no significant effect of CP, fermentable CP or Rmic on the total VFA-PR was evidenced and their introduction as an additional covariable did not improve the models based on dOM or RfOM intake.
The total VFA-PR, when expressed in mol total VFA/kg RfOM intake, appeared slightly affected by DMi: −0.166 (±0.044, P < 0.01) mol total VFA/kg RfOM (Nexp = 13; Nt = 32) when DMi increased by 1 g/day per kg BW. In contrast, it was not affected by dietary composition.
Estimation of ruminal total VFA-PR from measured RfOMa
The estimation of total VFA-PR from measured RfOMa led to an average ratio of 8.35 ± 1.21 mol total VFA/kg RfOM (minimum = 3.89, maximum = 11.98). This ratio was not influenced by the intake level. In contrast, it significantly decreased as the proportion of concentrate increased (−0.11 ± 0.03 per 10% of concentrate).
Response laws of individual VFA molar percentages in the rumen fluid, to intake and diet composition
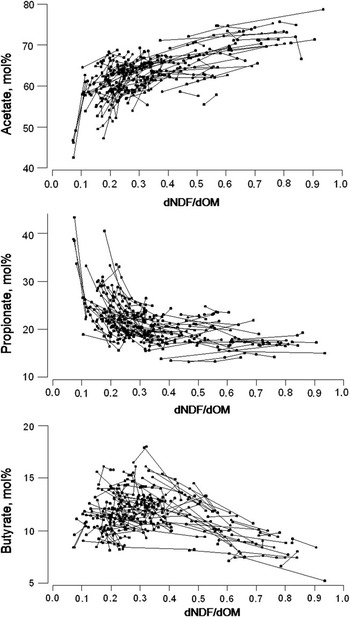
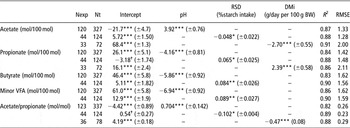
The molar percentages of individual VFA and C2/C3 ratio were related to dNDF/dOM. Raw data are presented in Figure 2. The relationships were not linear for C2, C3, C2/C3 and were linear for C4 and minor VFA. Exponential adjustment was tested using the NLIN procedure but failed to converge for C4 and minor VFA. Logarithmic transformation was performed and did not allow linearization, because models based on log (100 dNDF/dOM) exhibited a significant quadratic term for C2, C3, C4, minor VFA and C2/C3 (Table 3). The residuals of these quadratic models were significantly related to pH, RSD and DMi (Table 4). When RSD and DMi were included as covariables (Nexp = 44, Nt = 124, mean dNDF/dOM = 0.294, mean RSD = 68.4%, mean DMi = 2.88 g DM/day per kg BW), the quadratic term of log (dNDF/dOM) became not significant, and models were significantly improved for C2, C3, C4 and C2/C3 (Table 5). No other interfering factor (including pH) was detected for these models.
Within-experiment relationships between the observed proportion of digested NDF in the digested organic matter (dNDF/dOM) and the observed individual volatile fatty acids (VFA) molar percentages in the rumen: raw data. Results from the VFA-Conc database.

Responses of individual VFA molar percentages to variations in the proportion of dNDF in the dOM expressed as log (100 dNDF/dOM)

VFA = volatile fatty acids; dNDF = digested NDF; dOM = digested organic matter; Nexp = number of experimental groups; Nt = number of treatments; RMSE = residual mean square error.
Minor VFA = total VFA − acetate − propionate − butyrate. It includes mainly valerate, iso-butyrate and iso-valerate.
Results are from the VFA-Conc database.
ns = P > 0.10; *P < 0.05; **P < 0.01; ***P < 0.001.
Responses of individual VFA molar percentages to variations in pH, RSD (%starch intake) and DMi (g/day per 100 g BW)

VFA = volatile fatty acids; RSD = ruminal starch digestibility; DMi = dry matter intake; Nexp = number of experimental groups; Nt = number of treatments; RMSE = residual mean square error; dNDF = digested NDF; dOM = digested organic matter.
Minor VFA = total VFA − acetate − propionate − butyrate. It includes mainly valerate, iso-butyrate and iso-valerate.
Analysis is performed on residuals (predicted–observed) of quadratic models based on log (100 dNDF/dOM) presented in Table 3. Only significant (P > 0.10) relationships are presented. Results are from the VFA-Conc database.
†P < 0.10; *P < 0.05; **P < 0.01; ***P < 0.001.
Responses of individual VFA molar percentages to variations in the proportion of dNDF in the dOM (log 100 dNDF/dOM), RSD (%starch intake) and DMi (g/day per 100 g BW)

dNDF = digested NDF; dOM = digested organic matter; RSD = ruminal starch digestibility; DMi = DM intake; Nexp = number of experimental groups; Nt = number of treatments; RMSE = residual mean square error.
Results are from the VFA-Conc database.
ns = P > 0.10; †P < 0.10; *P < 0.05; **P < 0.01; ***P < 0.001.
The total VFA-PR also significantly affected the VFA profiles (VFA-Prod database). An increase in total VFA-PR of 100 mmol/day per kg BW induced a decrease in C2 and in C2/C3, averaging −4.0 (±1.7) mol/100 mol (Nexp = 30; Nt = 97, P = 0.02) and −0.75 (±0.24) mol/mol (Nexp = 28; Nt = 94, P = 0.003), respectively. The extent of the decrease was independent of factors inducing changes in total VFA-PR, that is, DMi and/or dietary composition (P = 0.91). The molar proportion of the other VFA tended to increase, although it failed to be statistically significant.
Individual VFA molar percentages: production v. concentration in the rumen fluid
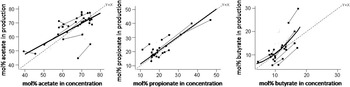
Simultaneous determination of individual and total VFA-PR was reported for 63 (C2), 44 (C3) and 42 (C4) treatments. These data were issued from experiments focused on effects of DMi and/or dietary composition (60%) or on the effects of other factors, that is, additives or animal species (40%), and covered a large range of DMi, dietary composition and VFA profiles. Within this data set, individual VFA molar percentages (mol/100 mol) were significantly related between production and concentrations. Within-experiment relationships were linear for C2 and C3 and quadratic for C4 (Figure 3). No significant interfering factors were detected for C3. A significant effect of the methodology of tracer infusion was observed for the intercepts for C2 (+2 mol/100 mol) and C4 (−2 mol/100 mol) for continuous infusion compared to pulse dose.
Within-experiment relationships between the observed individual volatile fatty acids (VFA) molar percentages in the concentrations (%conc, X) and in the production flux (%prod, Y). The raw data are presented, the dotted lines represent the first bisector (Y = X), and the bold lines represent the regression models: %C2prod = 18* (±6) + 0.74*** (±0.09) %C2conc (Nexp = 22; Nt = 56; R 2 = 0.96; Syx = 2.1); %C3prod = 1.4ns (±1.5) + 0.98*** (±0.07) %C3conc (Nexp = 17; Nt = 41; R 2 = 0.98; Syx = 1.4); %C4prod = 5.2*** (±0.6) + 0.052*** (±0.004) %C4conc2 (Nexp = 17; Nt = 39; R 2 = 0.96; Syx = 1.1). Results from the VFA-Prod database.

Determination of stoichiometric coefficients
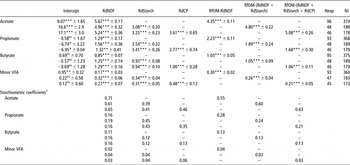
The calculated stoichiometric coefficients for ruminally fermented fractions are reported in Table 6. For C2, C3, C4 and minor VFA, they averaged 66%, 17%, 14% and 3% for RdNDF, 41%, 44%, 12% and 4% for ruminally digested starch (Rdstarch), 46%, 35%, 13% and 6% for ruminally digested CP (RdCP), 63%, 21%, 13% and 3% for the other fractions (RfOM–RdNDF–Rdstarch–RdCP). These coefficients had a low s.e. and were stable whatever the number of fermented fractions considered.
Responses of individual VFA-PR (mmol/day per kg BW) to variations in the amount of RdNDF, Rdstarch, RdCP and the other fractions of the truly fermented OM RfOM (g/day per kg BW) and the derived stoichiometric coefficients (mol/mol total VFA)
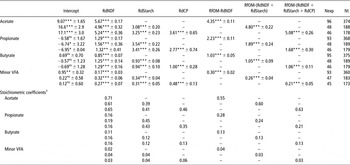
VFA-PR = volatile fatty acids-production rate; RdNDF = ruminally digested NDF; Rdstarch = ruminally digested starch; RdCP = ruminally digested CP; OM = organic matter; RfOM = rumen fermentable organic matter; Nexp = number of experimental groups; Nt = number of treatments.
Minor VFA = total VFA − acetate − propionate − butyrate. It includes mainly valerate, iso-butyrate and iso-valerate.
1For each fermented substrate and each individual VFA the stoichiometric coefficient was calculated as the ratio between the response of the individual VFA production (slope) and the response of the total VFA production (sum of slopes) to the amount of fermented susbstrate.
Results are from the DOMR database.
ns = P > 0.10; *P < 0.05; **P < 0.01; ***P < 0.001.
Discussion
Although the prediction of rumen VFA-PR is essential for the elaboration of new feed evaluation systems based on knowledge of the nutrients available for absorption, it remains clearly unsatisfying in the current mechanistic rumen models (Bannink et al., Reference Bannink, De Visser and Van Vuuren1997; Offner and Sauvant, Reference Offner and Sauvant2004a). In this study, an alternative approach is proposed. Our empirical approach is based on the quantitative review of previously published results, using principles of meta-analysis allowing dissociating between- and within-experiment variations (Sauvant et al., Reference Sauvant, Schmidely, Daudin and St-Pierre2008).
Total VFA-PR
We aimed to assess the relationship between total VFA-PR and the amount of OM fermented in the rumen. The quantification of VFA-PR in vivo with tracers has not been extensively addressed, with <80 publications during the last four decades. This is mainly due to the cost of measurements requiring isotopes. Nevertheless, the available data exhibit a wide diversity of experimental dietary treatments. While it is likely that total VFA-PR closely depends on the amount of RfOM, we know only two publications reporting simultaneous measurement of both in vivo total VFA-PR and actual RfOM (Mercer et al., Reference Mercer, Allen and Miller1980; Siddons et al., Reference Siddons, Arricastres, Gale and Beever1984). We assessed this relationship by fitting results of measured total VFA-PR (VFA-Prod database) to the amount of OM fermented in the rumen estimated by a homogeneous characterization of feed and diets according to INRA feed tables. Additivity was assumed, given the low level of digestive interactions in this data set, estimated at 3.1% ± 1.2% for OM digestibility, according to the empirical model of Sauvant (Reference Sauvant2003). This approach was used previously to predict net portal appearance of the energy nutrients in ruminants (Loncke et al., Reference Loncke, Ortigues-Marty, Vernet, Lapierre, Sauvant and Nozière2009). It allows studying simultaneously a wide diversity of putative interfering factors reflecting intake level, dietary composition, methods or animal characteristics. We identified a close relationship between measured total VFA-PR and estimated RfOM intake. This relationship presents no significant interfering factors and is independent of whether changes in RfOM intake are due to changes in DMi and/or in diet composition. The slope of the relationship shows an increment of total VFA-PR averaging 8.0 (±0.6) mol per kg RfOM. Using the same approach, Loncke et al. (Reference Loncke, Ortigues-Marty, Vernet, Lapierre, Sauvant and Nozière2009) found an average net portal appearance of total VFA of 5.9 (±0.5) mol per kg RfOM. Taken together, these results suggest an average net portal recovery of 75% for total VFA. This is consistent with the average net portal recovery of individual VFA infused in the rumen previously reported (Nozière and Hoch, Reference Nozière and Hoch2006), that is, 71%, 69% and 26%, for C2, C3 and C4, respectively, despite the fact that the quantitative interpretation of the non-recovered VFA remains subject to debate (Kristensen and Harmon, Reference Kristensen and Harmon2006). Moreover, using a different approach based on the estimation of ruminal total VFA-PR from measured RfOMa (DOMR database), we observed an average ratio of 8.3 ± 1.2 mol total VFA/kg RfOM. Both approaches, although entirely distinct and conducted on independent databases, provided similar estimates.
The total VFA-PR expressed per kg RfOM, exhibits substantial variability. While this variability appears slightly related to DMi with the VFA-Prod database, it appears mainly related to dietary composition (percentage of the concentrate) with the DOMR database. This apparent discrepancy between the approaches could largely be related to digestive interactions, because with the VFA-Prod database, RfOM was calculated from tabulated values assuming additivity. Our results confirm that RfOM is the pivot of C partitioning in the rumen and suggest that the composition of RfOM can affect energy partitioning between VFA yield, microbial synthesis and gas production.
Individual VFA molar percentages in the rumen fluid
We aimed to produce equations based on explanatory variables resulting from measured digestion data, which could be estimated from feed tables and are physiologically relevant for all diets. Across a wide diversity of experimental diets, changes in dNDF/dOM are the main variable explaining changes in VFA molar percentages in the rumen. Statistical outliers of the initial model based on dNDF/dOM (Table 3) represented <4% of the initial data set. At a given dNDF/dOM level, we identified additional effects of the site of starch digestion and of DMi on VFA molar percentages. The effect of intake level was also observed by Sveinbjörnsson et al. (Reference Sveinbjörnsson, Huhtanen and Udén2006) for a large data set on dairy cows fed Nordic diets. Factors other than intake level that may affect VFA profiles without substantially affecting dNDF/dOM or RSD (i.e. particle size, buffer supply) may contribute to the residual variability but could not be quantified in this study. However, the final models including dNDF/dOM, RSD and DMi, despite being derived from a limited data set (Nexp = 44; Nt = 124, Table 5), exhibited a very low RMSE compared to other published models derived either from stoichiometric models and not corrected for the experimental effect (Bannink et al., Reference Bannink, Kogut, Dijkstra, Kebreab, France, Tamminga and Van Vuuren2006) or from within-experiment models based on a more aggregated covariable, such as percentage of the concentrate (Lescoat and Sauvant, Reference Lescoat and Sauvant1995) or dNDF content (Sauvant, Reference Sauvant2003). While rumen pH was an interfering factor for the model based solely on dNDF/dOM, it was not an interfering factor when RSD and DMi were included as additional variables. This suggests that the effect of pH on VFA stoichiometry was largely confounded with RSD and/or DMi.
The response laws of VFA molar percentages to intake and diet composition proposed in this study are based on digestive fluxes of OM, NDF and starch actually measured across a wide diversity of experimental conditions (see structure of meta-design). The use of these models for predicting purposes by using tabulated data of RfOM, dOM, dNDF or RSD, requires the user to take into account digestive interactions on these parameters, using mechanistic and/or empirical models (Archimède et al., Reference Archimède, Sauvant and Schmidely1997; Sauvant, Reference Sauvant2003; Offner and Sauvant, Reference Offner and Sauvant2004b).
Individual VFA molar percentages: production v. concentration in the rumen fluid
We aimed to assess whether the changes in the VFA profiles in the rumen fluid can reflect the changes in VFA profiles in the production. In all published studies, in which PR of individual VFA have been measured (i.e. considering C2, C3 and C4 as separated pools linked by interconversion fluxes), a discrepancy in VFA profiles between production and concentration in the rumen fluid is reported (Sutton et al., Reference Sutton, Dhanoa, Morant, France, Napper and Schuller2003). Within-studies relationships obtained in this study over a wide range of VFA profiles, show that changes in individual VFA molar percentages in the production, are slightly overestimated for C2 and underestimated for C4, by changes in their molar percentages in the rumen fluid. This can originate in differences between VFA in their fractional absorption rate (C2 < C3 < C4, Bergman, Reference Bergman1990) and from the differential effect of pH on the absorption rates of the VFA. This effect increases with chain length (Dijkstra et al., Reference Dijkstra, Boer, van Bruchem, Bruining and Tamminga1993), as a function of pKa (Pitt et al., Reference Pitt, van Kessel, Fox, Pell, Barry and van Soest1996; Nozière and Hoch, Reference Nozière and Hoch2006). Despite good within-experiment relationships between the VFA profiles in the production and the VFA profiles in the rumen fluid, inter-experiment variability remained high, particularly for C4. To assess whether different absorption rates may explain the differences across studies, we performed dynamic simulations of rumen VFA pools, with VFA fractional absorption rates depending on rumen pH (estimated from VFA concentration if not reported in the publications), VFA concentration and rumen volume (Dijkstra et al., Reference Dijkstra, Boer, van Bruchem, Bruining and Tamminga1993; Nozière and Hoch, Reference Nozière and Hoch2006). The simulations suggested that the differences in pH, VFA concentrations or rumen volume were insufficient to explain the differences between production and concentration profiles across studies. These inter-experiment differences also had a methodological origin. Consequently, and given that within-experiment relationships were close to the first bisector over a wide range of VFA molar proportion, the changes in VFA profiles based on the production rates can be assumed to be equal to the changes in the VFA profiles in the rumen fluid concentrations, within the experiment. On the basis of this assumption, predicted individual VFA-PR (i.e. total VFA-PR × individual VFA molar proportion in the rumen fluid) were compared to their measured portal appearance and the relationships proved to be highly consistent with quantitative knowledge on VFA metabolism by portal-drained viscera (Nozière et al., Reference Nozière, Glasser, Loncke, Ortigues-Marty, Vernet and Sauvant2010a).
Determination of stoichiometric coefficients
In parallel to the development of equation responses of VFA molar percentages to dietary factors, we assessed a new way to determine stoichiometric coefficients for use across a wide diversity of diets. In current mechanistic models (Baldwin et al., Reference Baldwin, Thornley and Beever1987; Dijkstra et al., Reference Dijkstra, Neal, Beever and France1992; Pitt et al., Reference Pitt, van Kessel, Fox, Pell, Barry and van Soest1996), separate coefficients for roughage and concentrate diets are considered (Murphy et al., Reference Murphy, Baldwin and Koong1982; Bannink et al., Reference Bannink, Kogut, Dijkstra, Kebreab, France, Tamminga and Van Vuuren2006; Sveinbjörnsson et al., Reference Sveinbjörnsson, Huhtanen and Udén2006) and their use requires accurate knowledge of five fermented substrates (soluble carbohydrates, starch, hemicellulose, cellulose and protein), although the precision of the analytical determination of some of these substrates (i.e. hemicellulose) remains questionable. The limits of these coefficients for a generic application have been pointed out by several authors (Bannink et al., Reference Bannink, De Visser and Van Vuuren1997; Friggens et al., Reference Friggens, Oldham, Dewhurst and Horgan1998; Offner and Sauvant, Reference Offner and Sauvant2004a). A previous attempt to avoid the discontinuity between roughage and concentrate data sets was developed by Friggens et al. (Reference Friggens, Oldham, Dewhurst and Horgan1998) using an experimental approach that was restricted to sheep fed grass-based diets. As reviewed by Nozière et al. (Reference Nozière, Ortigues-Marty, Loncke and Sauvant2010b), whereas for each dietary component the stoichiometric coefficients may vary according to diet, the effect of diet appears not homogeneous among studies and largely depends on the data sets used by the authors, as well as on the assumptions made for the derivation of the stoichiometric estimates, that is, hypothesis for VFA production and absorption rates. In our modelling approach, the individual VFA-PR was estimated from measured RfOM intake and VFA ruminal molar percentages. Consequently, our approach is less dependent on the assumptions made for the derivation of the stoichiometric estimates. In addition, compared to previous studies in which the cell wall components were dissociated between cellulose and hemicellulose (Murphy et al., Reference Murphy, Baldwin and Koong1982; Bannink et al., Reference Bannink, Kogut, Dijkstra, Kebreab, France, Tamminga and Van Vuuren2006), we considered NDF as a unique entity, because ruminal digestion of NDF is frequently reported and accurately measured in the publications. Consequently, we propose in this study several coefficient sets depending on the measured digested fractions in the rumen (only OM and NDF or OM, NDF and starch or OM, NDF, starch and CP). These coefficients were very stable across dietary conditions, reflecting the robustness of this approach.
Stoichiometric coefficients derived in this study for NDF (66:17:14:3 for C2:C3:C4:minor VFA, respectively) are in good agreement with the average coefficients reported previously by other authors for the cell wall component (64:14:18:4 on average by Murphy et al., Reference Murphy, Baldwin and Koong1982; Bannink et al., Reference Bannink, Kogut, Dijkstra, Kebreab, France, Tamminga and Van Vuuren2006; Sveinbjörnsson et al., Reference Sveinbjörnsson, Huhtanen and Udén2006). In contrast, for starch, our results showed a highly propionic pattern (41:44:12:3) compared to the coefficients reported by the other authors (on average 53:23:18:6), but our coefficients are highly consistent with those reported for amylolytic bacteria (48:45:5:1) by Nagorcka et al. (Reference Nagorcka, Gordon and Dynes2000) who set up separate coefficients for bacteria and protozoa. Finally, for CP, our results showed a pattern low in minor VFA (46:35:13:6) compared to the coefficients reported by the other authors (on average 46:26:15:13). As fermented CP generally contributes to <20% of RfOM, this should slightly impact on the prediction of VFA profiles.
Besides digested substrates, we assessed the sensitivity of stoichiometric coefficients to ruminal conditions. We used the present stoichiometric coefficients to predict the VFA molar proportion in the rumen and the differences between observed and predicted values (residuals) were calculated. Residuals were not significantly related to DMi, dNDF/dOM or the concentrate level. Only diets presenting an extremely low fibrosity (dNDF/dOM < 0.12), that is, in the study by Corona et al. (Reference Corona, Owens and Zinn2006) with 73% corn grain, exhibited large residuals. A significant quadratic relationship between residuals and pH was observed. This confirms a specific effect of rumen pH on stoichiometry of VFA, already considered by Argyle and Baldwin (Reference Argyle and Baldwin1988), Pitt et al. (Reference Pitt, van Kessel, Fox, Pell, Barry and van Soest1996) and Bannink et al. (Reference Bannink, Kogut, Dijkstra, Kebreab, France, Tamminga and Van Vuuren2006 and Reference Bannink, France, Lopez, Gerrits, Kebreab, Tamminga and Dijkstra2008). However, our results show that the residuals were fairly low (<5 mol/mol for C3, <2 mol/mol for C4) within a large range of ruminal pH (5.7 to 6.6).
Conclusion and perspectives
The objectives of this study were to establish empirical response equations of the total VFA-PR and of the individual VFA molar percentages in the rumen to variations in intake level and dietary composition. The RfOM intake, estimated from INRA Feed Tables (2007), was an accurate explanatory variable of total VFA-PR over a wide range of intake levels and dietary composition, with no significant interfering factors. We showed that the VFA molar percentages were related to DMi and measured dOM, dNDF and RSD, which reflect the nature of energy, as well as the site and extent of digestion. The use of these models for predictive purposes using tabulated data of RfOM, dOM, dNDF and RSD requires digestive interactions to be taken into account. The individual VFA molar percentages in the total VFA production are close to those measured from their concentration in rumen fluid. Using this result, we propose new stoichiometric coefficients for NDF, starch, CP and the remaining OM fermented in the rumen, which could be used across a wide range of dietary conditions.