Introduction
ipRGCs transmit their sustained ON photoresponses not only to higher visual nuclei to evoke image-forming and nonimage-forming responses (Sondereker et al., Reference Sondereker, Stabio and Renna2020; Aranda & Schmidt, Reference Aranda and Schmidt2021) but also to other neurons within the retina to modulate retinal physiology (Hankins & Lucas, Reference Hankins and Lucas2002; Barnard et al., Reference Barnard, Hattar, Hankins and Lucas2006; Milosavljevic et al., Reference Milosavljevic, Storchi, Eleftheriou, Colins, Petersen and Lucas2018), overturning the long-held assumption that ganglion cells signal only extraretinally. The intraretinal ipRGC output uses both chemical and electrical synapses, signaling via glutamate to sustained dopaminergic amacrine cells (ACs) (Zhang et al., Reference Zhang, Wong, Sollars, Berson, Pickard and McMahon2008) and via gap junctions to some displaced ACs, that is, ACs with somas in the ganglion-cell layer (GCL) (Sekaran et al., Reference Sekaran, Foster, Lucas and Hankins2003; Reifler et al., Reference Reifler, Chervenak, Dolikian, Benenati, Li, Wachter, Lynch, Demertzis, Meyers, Abufarha, Jaeckel, Flannery and Wong2015). Whereas the glutamatergic output is known to originate from M1-type ipRGCs, participate in light adaptation, and regulate clock gene expression (Dkhissi-Benyahya et al., Reference Dkhissi-Benyahya, Coutanson, Knoblauch, Lahouaoui, Leviel, Rey, Bennis and Cooper2013; Prigge et al., Reference Prigge, Yeh, Liou, Lee, You, Liu, McNeill, Chew, Hattar, Chen and Zhang2016), the organization and function of electrical ipRGC-AC coupling are less understood.
We previously learned that all displaced ACs with spiking, tonic excitatory light responses receive gap-junction input from ipRGCs, and that they include ON-stratifying and ON/OFF-stratifying varieties (Reifler et al., Reference Reifler, Chervenak, Dolikian, Benenati, Li, Wachter, Lynch, Demertzis, Meyers, Abufarha, Jaeckel, Flannery and Wong2015). More recently, some nonspiking displaced ACs were also found to receive gap junctional ipRGC input (Pottackal et al., Reference Pottackal, Walsh, Rahmani, Zhang, Justice and Demb2021). All six known ipRGC types couple with displaced ACs (Muller et al., Reference Muller, Do, Yau, He and Baldridge2010; Harrison et al., Reference Harrison, Chervenak, Resnick, Reifler and Wong2021a), which contain at least four neuromodulators (Harrison et al., Reference Harrison, Chervenak, Resnick, Reifler and Wong2021a; Pottackal et al., Reference Pottackal, Walsh, Rahmani, Zhang, Justice and Demb2021). But many fundamental questions remained: (1) Do ipRGCs couple with additional morphological/physiologic types of ACs? (2) Do the six ipRGC types couple with different AC types? M2 cells had been shown to couple with ON-stratifying displaced ACs (Muller et al., Reference Muller, Do, Yau, He and Baldridge2010; Sabbah et al., Reference Sabbah, Berg, Papendorp, Briggman and Berson2017), but the other ipRGC types remained unexamined. (3) Besides transmitting ipRGC photoresponses to ACs, does ipRGC-AC coupling perform any of the myriad roles electrical synapses are known to play in other neural circuits (Connors, Reference Connors2017)? To answer them, we used a gap junction-permeable fluorescent tracer, PoPro1 (Hoshi et al., Reference Hoshi, O’Brien and Mills2006), to identify ipRGC-coupled ACs in living retinas for electrophysiological and morphological analysis. We also examined the functional consequences of disrupting ipRGC-AC coupling by knocking out the gap junction protein connexin36 (Cx36) selectively in ipRGCs (Harrison et al., Reference Harrison, Chervenak, Resnick, Reifler and Wong2021a).
Materials and methods
Animals
All procedures were approved by the University of Michigan Institutional Animal Care and Use Committee. Opn4Cre/+; Z/EG and Opn4Cre/+; Cx36flox/flox; Z/EG mice, both with green fluorescent protein (GFP)-labeled ipRGCs, were generated as previously described (Ecker et al., Reference Ecker, Dumitrescu, Wong, Alam, Chen, LeGates, Renna, Prusky, Berson and Hattar2010; Harrison et al., Reference Harrison, Chervenak, Resnick, Reifler and Wong2021a) and housed in a 12-h light 12-h dark cycle, with experiments performed during the light phase. Mice were 2–9 months old and both sexes were used. Each mouse was dark-adapted overnight, euthanized by CO2 and cervical dislocation under dim red light, and both eyes enucleated under infrared binoculars. After hemisection of the eyes, the retinas were isolated in room-temperature Ames’ medium gassed with 95% O2 5% CO2 and kept in darkness for up to 7 h before being used.
PoPro1 iontophoresis and whole-cell recording
A piece of retina was flattened on a recording chamber with the ganglion cell side up, positioned on a Leica TCS SP5 II confocal microscope, and superfused by 32°C Ames’ medium at 3 ml/min. An 890 nm Mai Tai DeepSee multiphoton laser (Spectra-Physics, Santa Clara, CA) was used to visualize GFP+ ipRGC somas, which were impaled with a sharp electrode (˜100 MΩ tip resistance) containing 1 m KCl and 1–2 mM PoPro1 (from Stephen Mills, University of Texas Health Science Center at Houston). A MultiClamp 700B amplifier (Molecular Devices, San Jose, CA) was used to generate +2 nA pulses at 3 Hz for 30–60 min to iontophorese PoPro1. After electrode removal, the retina was kept in darkness for 1–2 h to allow PoPro1 to diffuse from the injected ipRGC to coupled somas. PoPro1-stained somas were then visualized by the same multiphoton laser and whole-cell-recorded using an Alexa568-containing K+-based intracellular solution as previously detailed (Zhao et al., Reference Zhao, Stafford, Godin, King and Wong2014). Stimuli with intensities between 7.5 log and 13.5 log quanta/cm2/s were full-field white light presented from a miniature OLED display (eMagin, Bellevue, WA) through a camera port, and were calibrated as described (Zhao et al., Reference Zhao, Stafford, Godin, King and Wong2014). To more strongly excite melanopsin, a blue LED mounted on a separate camera port was used to deliver full-field 16.1 log quanta/cm2/s light to the retina. To record melanopsin-mediated photoresponses selectively, light-evoked rod/cone signaling was blocked by 20–50 μM L-(+)-2-amino-4-phosphonobutyrate (L-AP4), 16–40 μM 6,7-dinitroquinoxaline-2,3-dione (DNQX), and 10–25 μM D-2-amino-5-phosphonovalerate (D-AP5) (Wong, Reference Wong2012; Zhao et al., Reference Zhao, Stafford, Godin, King and Wong2014). This cocktail was also used during some dual-cell recordings to reduce chemical synaptic activity so that gap-junction transmission could be better discerned.
Right after recording from a cell, its Alexa568 fill was imaged using the multiphoton laser at 1.98 μm z-stack spacing. The ipRGCs’ PoPro1 staining enabled identifying them as M1–M6 per published criteria. Specifically, M1 stratifies only in the OFF sublamina of the inner plexiform layer; M2 has sparse dendrites stratifying only in the ON sublamina; M3 has sparse dendrites in both sublaminas; M4 has a very large soma and radiate, ON-stratifying dendrites; M5 has dense, bushy dendrites in the ON sublamina; and M6 has not only dense, M5-like ON dendrites but also additional OFF-stratifying dendrites (Ecker et al., Reference Ecker, Dumitrescu, Wong, Alam, Chen, LeGates, Renna, Prusky, Berson and Hattar2010; Schmidt & Kofuji, Reference Schmidt and Kofuji2011; Estevez et al., Reference Estevez, Fogerson, Ilardi, Borghuis, Chan, Weng, Auferkorte, Demb and Berson2012; Stabio et al., Reference Stabio, Sabbah, Quattrochi, Ilardi, Fogerson, Leyrer, Kim, Kim, Schiel, Renna, Briggman and Berson2018; Quattrochi et al., Reference Quattrochi, Stabio, Kim, Ilardi, Michelle Fogerson, Leyrer and Berson2019).
Multielectrode-array recording
Multielectrode-array (MEA) recordings were made from ipRGCs in isolated retinas as detailed previously (Wong, Reference Wong2012), with L-AP4, DNQX and D-AP5 in the bath to block rod/cone-dependent light responses. To calculate the final-to-peak ratio of each photoresponse, a spike histogram during the 60 s illumination was constructed with 1 s bins, and the 60th column was divided by the tallest column. To extrapolate each photoresponse beyond the 60 s illumination, a first-order exponential decay equation was used to fit the spike counts between the tallest column and the 60th column. All fits had R 2 values of at least 80%.
Statistics
All statistical comparisons used the Mann–Whitney U test, with P < 0.05 indicating significant differences. All data spreads are represented as s.d.
Results
Using PoPro1 tracing to identify ipRGC-coupled amacrine cells
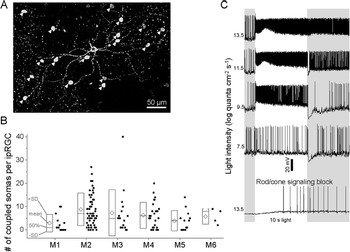
We iontophoresed PoPro1 into GFP-labeled ipRGCs in Opn4Cre/+; Z/EG retinas to identify the AC somas that coupled with each ipRGC. Fig. 1A shows a representative example, of a PoPro1-injected M2 ipRGC with 17 coupled somas in the GCL. In total, 129 ipRGCs were injected, and Fig. 1B shows population-averaged numbers of PoPro1-stained somas per ipRGC for all ipRGC types, including uncoupled ipRGCs. These numbers largely mirrored those previously obtained via Neurobiotin tracing (Harrison et al., Reference Harrison, Chervenak, Resnick, Reifler and Wong2021a), though PoPro1 identified significantly more M2-coupled somas (P = 0.037). Of the 895 somas PoPro1-traced from those 129 ipRGCs, 874 (97.7%) were in the GCL, and the rest in the inner nuclear layer (INL). Due to the rarity of PoPro1-stained INL somas, this project focused on displaced ACs except for the nondisplaced AC described in the next section.
Using PoPro1 tracer to identify ipRGC-coupled somas. (A) PoPro1 injected into this M2 ipRGC (asterisk) stained 17 somas (arrowheads) in the GCL. (B) Population-averaged numbers of somas that were PoPro1-traced from each M1–M6 ipRGC, including ipRGCs lacking coupled somas. Each data point shows the number of somas coupled to an injected ipRGC. Each diamond represents the mean number of coupled somas per ipRGC for that ipRGC type, and the box plot depicts the 50th percentile, mean + S.D., and mean ‒ S.D. Numbers of ipRGCs injected: 13 M1, 57 M2, 16 M3, 26 M4, 13 M5, and 4 M6. (C) Exemplary light responses of a displaced AC PoPro1-traced from an M3 ipRGC. Rod/cone signaling was blocked by 20 μM L-AP4, 16 μM DNQX, and 10 μM D-AP5.

To evaluate the specificity of PoPro1 staining, we whole-cell-recorded from 71 of the 895 PoPro1-stained ACs and tested for ipRGC-mediated photosensitivity during rod/cone signaling block by L-AP4, DNQX, and D-AP5. Sixty-six ACs remained photosensitive (Fig. 1C, bottom), suggesting that at least 93% of the ACs had been PoPro1-traced specifically, that is, via gap junctions with the injected ipRGCs; such ipRGC input could not have been received through glutamate receptors, which would have been blocked by DNQX and D-AP5. While the remaining 7% could have been nonspecifically stained by the iontophoresis electrode hitting a non-ipRGC neurite, it is possible that they were ipRGC-coupled, but their presynaptic ipRGCs had been compromised by prolonged iontophoresis and could no longer respond to light. It is also possible that ipRGCs do not propagate photoresponses to all coupled ACs.
Morphological types of ipRGC-coupled ACs
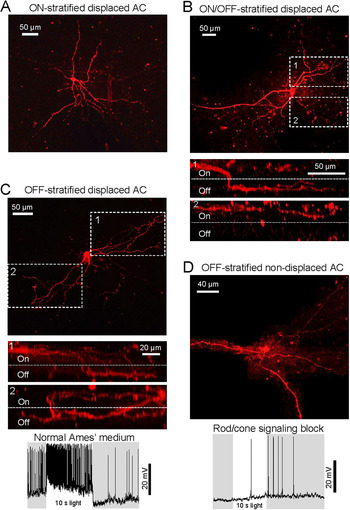
We previously found that ipRGCs transmit light responses through electrical synapses to ON- and ON/OFF-stratified displaced ACs (Reifler et al., Reference Reifler, Chervenak, Dolikian, Benenati, Li, Wachter, Lynch, Demertzis, Meyers, Abufarha, Jaeckel, Flannery and Wong2015). To learn whether ipRGCs also couple with OFF-stratified displaced ACs, we injected PoPro1 into 73 ipRGCs to stain their coupled somas, and for each injected ipRGC we filled a subset of its coupled GCL somas (1–5 somas per ipRGC) with Alexa568 via whole-cell recording to visualize their neurites in the inner plexiform layer. Out of 126 Alexas568-filled GCL somas, 98 (77.8%) were ON-monostratified, and 25 (19.8%) were ON/OFF-bistratified; Fig. 2A,B shows representative examples. The remaining three ACs (2.4%) had neurites terminating exclusively in the OFF sublayer. For two of these cells, most neurites stayed in the ON sublayer over fairly long distances before abruptly descending into the OFF sublayer (Fig. 2C, top and middle). The third cell’s neurites dived deep into the OFF sublayer shortly after leaving the soma, but unfortunately were incompletely imaged. All three OFF-stratified ACs displayed tonic ON photoresponses (Fig. 2C, bottom).
Morphological types of ipRGC-coupled amacrine cells. (A) Alexa568 fill of an ON-stratified displaced AC PoPro1-traced from an M2 ipRGC. (B) Top: Alexa568 fill of an ON/OFF-bistratified displaced AC traced from an M3 ipRGC. Bottom: Orthogonal views of the dendrites highlighted in the top panel. (C) Top: Alexa568 fill of an M1-coupled, OFF-stratified displaced AC. Middle: Orthogonal views of the dendrites highlighted above. Bottom: This cell’s response to 10.5 log quanta/cm2/s. (D) Top: Alexa568 fill of an M3-coupled, OFF-stratified AC with soma in the INL. As this soma was much deeper than the displaced ACs’ (A–C), far more positive pressure was applied to the electrode before recording, causing widespread extracellular Alexa568 staining of nearby cells. Such staining was manually masked on all focal planes to allow visualizing this cell’s neurites. Bottom: Even without rod/cone input, this AC depolarized to 16.1 log quanta/cm2/s light, confirming ipRGC input.

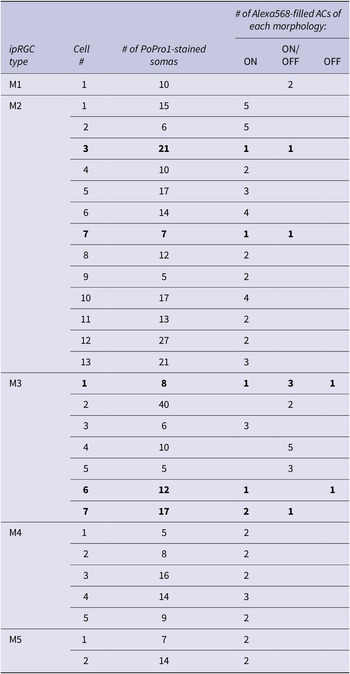
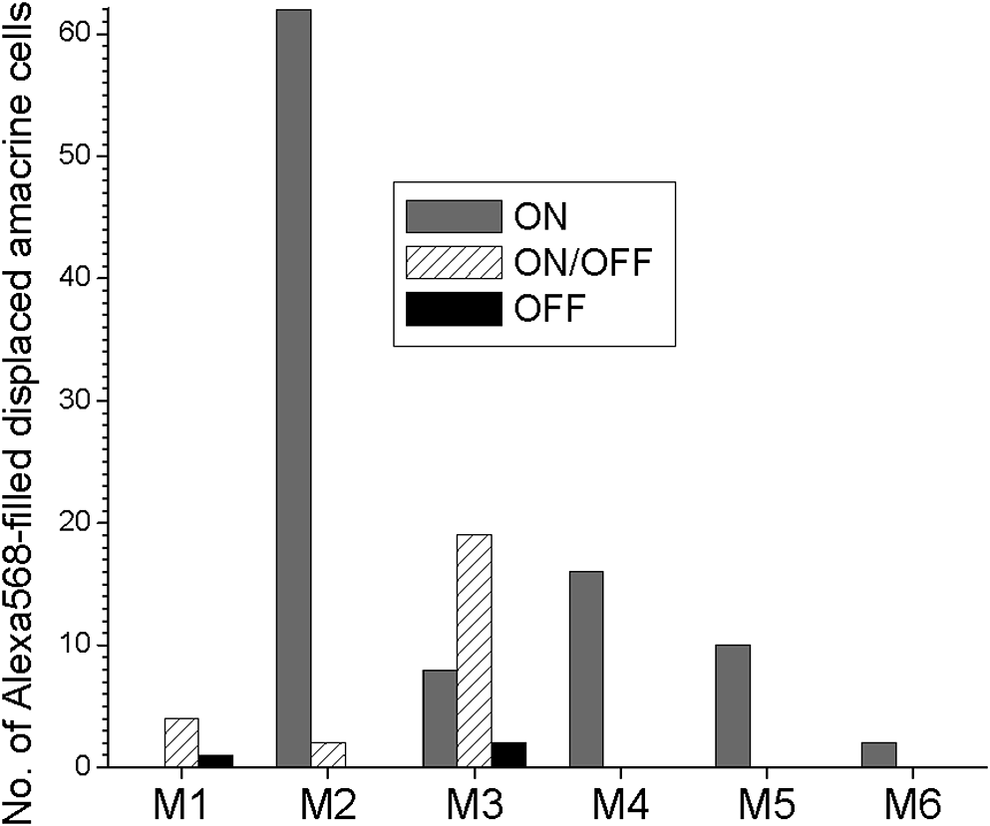
This analysis of the 126 Alexa568-filled displaced ACs revealed that different ipRGC types couple preferentially with different morphological types of displaced ACs. In Fig. 3, each column depicts the total number of Alexa568-filled displaced ACs of a given morphology (ON-, ON/OFF-, or OFF-stratified) that were PoPro1-traced from all the ipRGCs of each type. The M1-coupled ACs included ON/OFF- and OFF-stratified cells but not ON-stratified ones, with the caveat of a fairly small sample size. The M2-coupled ACs were overwhelmingly ON-stratified, though a few were ON/OFF-stratified. All three AC varieties were traced from M3, with ON/OFF-stratified ACs being the most common. All the M4/M5/M6-coupled ACs were ON-stratified. To learn whether multiple morphological types of ACs might couple with the same ipRGC, for 28 of the 73 ipRGCs (1 M1, 13 M2, 7 M3, 5 M4, and 2 M5) we injected Alexa568 into multiple (2–5) coupled ACs per ipRGC. Table 1 summarizes the results, showing that two M2 and one M3 ipRGCs coupled with both ON- and ON/OFF-stratified ACs, while another M3 cell coupled with ON- and OFF-stratified ACs, and a third M3 cell coupled with all three AC morphologies.
The 28 ipRGCs for which Alexa568 was injected into multiple coupled ACs per ipRGC. After each ipRGC had been injected with PoPro1 to trace coupled ACs, 2–5 of the latter were filled with Alexa568 to visualize their morphologies. The two M2 cells and three M3 cells with multiple morphological types of coupled ACs are highlighted in bold.

Several ipRGC types couple with different morphological classes of displaced amacrine cells. PoPro1 was injected into 73 ipRGCs (4 M1, 42 M2, 11 M3, 10 M4, 4 M5, and 2 M6) to trace coupled displaced AC somas, and for each ipRGC, Alexa568 was then introduced into some of its coupled somas (1–5 ACs per ipRGC) to visualize their neurites, allowing classifying each cell as “ON,” “ON/OFF,” or “OFF” based on stratification levels. In total, 126 ACs were Alexa568-filled. This chart summarizes how many displaced ACs of each morphology were traced from all the PoPro1-injected ipRGCs of each type.

As mentioned, we recorded from one PoPro1-stained INL soma. This M3-coupled AC had OFF-stratified neurites, and gave a sluggish depolarizing light response in the presence of rod/cone signaling blockers, indicating ipRGC input (Fig. 2D).
Novel light responses of ipRGC-coupled ACs
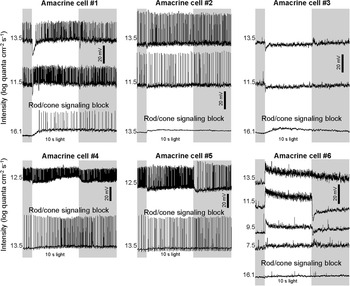
In our original search for ipRGC-coupled displaced ACs we screened specifically for spiking, tonic ON light responses (Reifler et al., Reference Reifler, Chervenak, Dolikian, Benenati, Li, Wachter, Lynch, Demertzis, Meyers, Abufarha, Jaeckel, Flannery and Wong2015), and would have missed any ipRGC-coupled ACs with OFF, transient ON, or nonspiking responses. To test this possibility, we whole-cell-recorded from 71 PoPro1-traced displaced ACs in normal Ames’ medium and measured their responses to full-field white light. While 36 cells gave spiking, tonic ON responses at all stimulus intensities tested (e.g., Figs. 1C and 2C, bottom), 35 cells had other kinds of responses at one or more intensities, especially hyperpolarizing responses at low intensities. However, in our experience recording from multiphoton-targeted neurons (Zhao et al., Reference Zhao, Stafford, Godin, King and Wong2014, Reference Zhao, Reifler, Schroeder, Jaeckel, Chervenak and Wong2017a,Reference Zhao, Wong and Zhangb), we had noticed that excessive prior laser exposure often causes ON cells (e.g., ipRGCs) to hyperpolarize to low-intensity light. As a control in the present study, we recorded from 17 ipRGCs after subjecting them to multiphoton exposure comparable to that experienced by the PoPro1-traced ACs, and 7 (41.2%) hyperpolarized at 7.5 log − 9.5 log quanta/cm2/s, although all 17 ipRGCs gave normal, tonic ON responses at 10.5 log − 13.5 log quanta/cm2/s, suggesting the responses at these higher intensities were probably reliable. Thus, when searching for new photoresponses among the 71 PoPro1-traced ACs, we analyzed only responses at 11.5 log − 13.5 log quanta/cm2/s. Sixty-four ACs had spiking, sustained ON responses, but five ACs hyperpolarized transiently at light onset (Fig. 4, cells #1–5). The two remaining cells gave tonic ON responses at all light intensities, but generated few action potentials; one of them is shown in Fig. 4 bottom right. All seven ACs were ON-stratified.
Novel photoresponses of ipRGC-coupled displaced amacrine cells. In the presence of normal Ames’ medium, cells #1–#5 hyperpolarized transiently at the onset of light steps 11.5 log − 13.5 log quanta/cm2/s in intensity. All five cells gave depolarizing light responses in the presence of rod/cone signaling blockers (L-AP4, DNQX, and D-AP5), indicating ipRGC input. In the presence of normal Ames, cell #6 gave nonspiking, sustained excitatory responses at all stimulus intensities. Blocking rod/cone signaling rendered this cell nonphotoresponsive, suggesting this cell could have been nonspecifically stained by PoPro1, or the PoPro1-injected ipRGC had been sickened by prolonged iontophoresis, or ipRGCs do not transmit photoresponses to all coupled ACs. AC #1, #4, #5, and #6 were PoPro1-traced from M2 ipRGCs, #2 from an M4 ipRGC, and #3 from an M3 ipRGC. All six cells were ON-stratified.

Additional functional roles of ipRGC-amacrine coupling
So far we have considered just one function of ipRGC-AC coupling, namely, propagating photoresponses from ipRGCs to coupled ACs. In the remainder of this study, we hypothesized four additional roles: bidirectional transmission, spike synchronization, promoting regular spiking, and modulating ipRGC photoresponses.
Bidirectional electrical transmission
For about 20 ipRGCs, after PoPro1 iontophoresis we removed the sharp electrode and tried to obtain dual whole-cell recordings from the ipRGC and a coupled AC. It proved extremely difficult to seal onto these previously impaled ipRGCs, and we successfully recorded from just one ipRGC-AC pair, consisting of an M2 ipRGC and an ON-stratified AC. In the presence of L-AP4, DNQX and D-AP5 to reduce chemical synaptic activity so that electrical synaptic transmission could be discerned more easily, we alternately applied −150 pA into each cell, performing eight trials per direction, and detected a response in the other on all trials, indicating bidirectional electrical transmission (Fig. 5A, left). But such transmission was asymmetric because the coupling coefficient, defined as (mean ΔV in the postjunctional cell) ÷ (mean ΔV in the prejunctional cell), was 0.0549 ± 0.0071 in the ipRGC➔AC direction but only 0.0249 ± 0.0171 in the AC➔ipRGC direction (P = 0.0019). Confirming ipRGC➔AC transmission, the ipRGC’s action potentials appeared as ≤1 mV spikelets in the coupled AC (Fig. 5A, right).
Bidirectional transmission between an ipRGC and a coupled amacrine cell, and between two amacrine cells that coupled to the same ipRGC. (A) Dual whole-cell recordings were made from an M2 ipRGC and a PoPro1-traced ON-stratified displaced AC. Left: A −150 pA step applied to one cell evoked a response in the other. Right: A +150 pA step was applied to the ipRGC and the AC’s response contained spikelets time-locked to the ipRGC’s spikes. (B) PoPro1 was injected into another M2 ipRGC to trace coupled displaced ACs, and dual whole-cell recordings were made from two of these ACs, both ON-stratified. Left: A −100 pA step applied to one AC induced a response in the other. Right: In the absence of current injection, AC #1 spiked spontaneously while AC #2 exhibited spikelets, some of which appeared time-locked to AC #1’s spikes.

We also recorded from four pairs of ON-stratified ACs, which had been PoPro1-traced from four different M2 cells. We again injected currents in alternating directions in the presence of L-AP4, DNQX and D-AP5, and detected bidirectional transmission in two of the AC–AC pairs. For one of these communicating pairs, the coupling coefficient was 0.0261 ± 0.0207 in one direction but significantly smaller in the other direction, 0.0098 ± 0.0043 (P = 0.0308). For the other communicating pair, transmission was relatively symmetric, with statistically similar (P = 0.2150) coupling coefficients of 0.0144 ± 0.0119 and 0.0104 ± 0.0206 in the two directions (Fig. 5B, left). Action potentials in one AC could be seen as ≤0.5 mV spikelets in the other (Fig. 5B, right). For the remaining two AC–AC pairs, none of the coupling coefficients were significantly different from 0, suggesting a lack of electrical transmission.
Spike synchronization
When superfused by normal Ames’ medium, the above dual-recorded ipRGC-AC pair fired action potentials spontaneously at sufficiently high rates that allowed us to probe for concerted firing. A cross-correlogram comparing the two cells’ spike times over a 60 s period had a prominent peak at t = 0, indicating correlated spiking (Fig. 6A). Similarly, when a cross-correlogram comparing 160 s of spontaneous action potentials was made for the above asymmetrically communicating AC–AC pair, a peak around t = 0 was seen (Fig. 6B, top left). We were able to dual-record from two more AC pairs that coupled with two additional M2 ipRGCs and their cross-correlograms, based on 148 and 120 s of spontaneous spiking, likewise suggested spike synchrony (Fig. 6B, top right and bottom left). By contrast, two ACs coupled to an M3 ipRGC lacked spike synchrony over an 80 s interval (Fig. 6B, bottom right).
Spike synchrony between an ipRGC and a coupled amacrine cell, and between some amacrine cells that couple to the same ipRGC. These cross-correlograms compare the timings of spontaneous spikes recorded from each pair of neurons. (A) Cross-correlogram for an M2 ipRGC and a coupled ON-stratified displaced AC. (B) The three cross-correlograms showing spike synchrony (top left, top right, and bottom left) are from three pairs of ON-stratified ACs that coupled with three M2 ipRGCs, whereas the cross-correlogram suggesting a lack of synchrony (bottom right) is from a pair of ON-stratified ACs that coupled to an M3 ipRGC.

Promotion of spike-time regularity
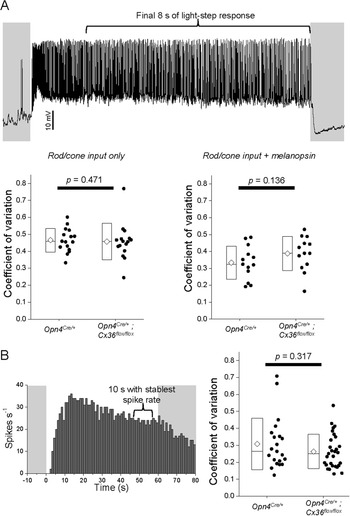
Early work noted unusually regular spiking in irradiance-detecting ganglion cells (Barlow & Levick, Reference Barlow and Levick1969), now known to be ipRGCs (Dacey et al., Reference Dacey, Liao, Peterson, Robinson, Smith, Pokorny, Yau and Gamlin2005; Wong, Reference Wong2012). Computational models suggest that gap junctions can induce rhythmicity (Manor et al., Reference Manor, Rinzel, Segev and Yarom1997), and pharmacologically blocking gap junctions abolished oscillatory activity in some ACs (Aboelela & Robinson, Reference Aboelela and Robinson2004). Thus, we hypothesized that ipRGC-AC coupling enhances spiking regularity in ipRGCs. We whole-cell-recorded from 16 ipRGCs (5 M1, 3 M2, 5 M4, 3 M5) in Opn4Cre/+; Z/EG control retinas, and from the same numbers of these types in Opn4Cre/+; Cx36flox/flox; Z/EG retinas with Cx36-knockout ipRGCs, excluding M3 as its AC coupling is Cx36-independent (Harrison et al., Reference Harrison, Chervenak, Resnick, Reifler and Wong2021a); M6 was not encountered. We first presented to each cell 7.5–9.5 log quanta/cm2/s steps to selectively induce rod/cone-driven responses, and used the flattest of these responses to calculate the coefficient of spike-interval variation (Maimon & Assad, Reference Maimon and Assad2009) as explained in Fig. 7A, top—the lower this coefficient, the higher the spiking regularity—and found it unaltered by Cx36 knockout (P = 0.471; Fig. 7A, bottom left). To learn whether activating melanopsin as well as rod/cone input would reveal a Cx36 contribution to spiking regularity, we then tested several intensities above the melanopsin threshold. But we found that as intensity increased, many cells became more prone to depolarization block (Hu et al., Reference Hu, Hill and Wong2013; Milner & Do, Reference Milner and Do2017; Stinchcombe et al., Reference Stinchcombe, Hu, Walch, Faught, Wong and Forger2021), so we calculated coefficients of spike-interval variation using just the lowest suprathreshold responses (10.5 log for M1, 11.5 log for non-M1) (Zhao et al., Reference Zhao, Stafford, Godin, King and Wong2014). We again found no significant Cx36 effect (P = 0.136; Fig. 7A, bottom right).
ipRGC-amacrine coupling does not affect the regularity of ipRGC spiking. The regularity of spike timing was quantified by the coefficient of variation: (s.d. of interspike intervals)/(mean interspike interval). (A) Top: Whole-cell recordings were made from 16 Opn4Cre/+ and 16 Opn4Cre/+; Cx36flox/flox ipRGCs in normal Ames’ medium to measure each cell’s responses to an intensity series of 10 s-duration light steps. The coefficient of variation was calculated from the final 8 s of each response, to avoid the rapidly changing spike rate during the first 2 s. Bottom left: Coefficients of variation for rod/cone-driven responses. Each ipRGC was presented with three light intensities below the melanopsin threshold, and the flattest of these responses was used to calculate that cell’s coefficient of variation. The elements of the box plots are as illustrated in Fig. 1B. Bottom right: Coefficients of variation for responses mediated by melanopsin as well as rod/cone input, calculated from 10.5 log quanta/cm2/s responses for M1 and 11.5 log quanta/cm2/s responses for non-M1. (B) Left: MEA recordings were made from 21 Opn4Cre/+ and 29 Opn4Cre/+; Cx36flox/flox ipRGCs during rod/cone signaling block to measure each cell’s melanopsin-based response to a 60 s-duration 480 nm step with an intensity of 14.7 log quanta/cm2/s. After generating a spike histogram of each response, the coefficient of variation was calculated from the 10 s segment exhibiting the stablest spike rate. Right: Population-averaged coefficients of variation for the two genotypes.

However, a caveat is that Opn4Cre/+ mice express Cre recombinase in not only ipRGCs but also some photoreceptors (Ecker et al., Reference Ecker, Dumitrescu, Wong, Alam, Chen, LeGates, Renna, Prusky, Berson and Hattar2010), so gap-junction coupling is presumably disrupted between Cre+ rods and cones in Opn4Cre/+; Cx36flox/flox; Z/EG mice (Jin et al., Reference Jin, Zhang, Keung, Youn, Ishibashi, Tian, Marshak, Solessio, Umino, Fahrenfort, Kiyama, Mao, You, Wei, Wu, Postma, Paul, Massey and Ribelayga2020). While such disruption probably alters rod/cone signaling to ipRGCs, it is unlikely to affect the latter’s spiking regularity, but given the preceding negative result, we wanted to isolate ipRGCs from rod/cone influence. Further, two-photon imaging of GFP could conceivably have affected spiking regularity. To avoid these potential issues, we used MEAs to record ipRGC photoresponses during rod/cone signaling block by L-AP4, DNQX and D-AP5. We presented 60s light steps at four intensities between 12.9 log and 15.7 log quanta/cm2/s, of which only 14.7 log quanta/cm2/s caused all recorded ipRGCs to spike throughout the 60 s, so we only analyzed this intensity. The responses of 21 Opn4Cre/+ ipRGCs and 29 Opn4Cre/+; Cx36flox/flox ipRGCs at this intensity included a 10s segment with relatively stable spike rates (Fig. 7B, left), and we calculated coefficients of spike-interval variation within this segment. These coefficients were statistically similar between the genotypes (P = 0.317; Fig. 7B, right). While this MEA experiment had the drawback of including M3 cells and sampling from different proportions of ipRGC types in the two genotypes, that two independent approaches came to the same conclusion suggests ipRGC-AC coupling does not promote regular spiking in ipRGCs.
Modulation of ipRGCs’ intrinsic photoresponse
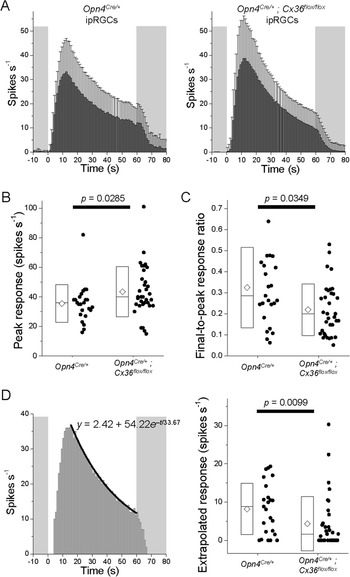
Finally we hypothesized that ipRGC-AC coupling influences the amplitude and/or kinetics of ipRGC photoresponses. Considering the above potential caveats of two-photon imaging and Cre+ photoreceptors, we again used MEAs to measure photoresponses during rod/cone signaling block, and we again tested 14.7 log quanta/cm2/s stimulus intensity so that all cells would spike throughout a 60 s step. We kept the stimulus duration so short because ipRGCs depend partly on the pigment epithelium to sustain their intrinsic photoresponse for longer than several minutes (Zhao et al., Reference Zhao, Pack, Khan and Wong2016), and at the time of these recordings we had not yet developed a mouse retinal preparation preserving connectivity with the epithelium (Harrison et al., Reference Harrison, Reifler, Chervenak and Wong2021b). We recorded from 24 Opn4Cre/+ ipRGCs and 34 Opn4Cre/+; Cx36flox/flox ipRGCs, and Fig. 8A shows the averaged spike histograms. Compared with Opn4Cre/+ ipRGCs, Opn4Cre/+; Cx36flox/flox ipRGCs had significantly higher peak light-evoked spike rates (P = 0.0285; Fig. 8B) though similar spike rates during the final second of illumination (P = 0.3524), causing the Opn4Cre/+; Cx36flox/flox responses to appear more transient (Fig. 8A) and have lower final-to-peak response ratios (P = 0.0349; Fig. 8C), a measure of photoresponse sustainedness (Zhao et al., Reference Zhao, Pack, Khan and Wong2016; Zhao et al., Reference Zhao, Reifler, Schroeder, Jaeckel, Chervenak and Wong2017a; Harrison et al., Reference Harrison, Reifler, Chervenak and Wong2021b).
ipRGC-amacrine coupling shapes the intrinsic photoresponses of ipRGCs. MEA recordings were obtained from 24 Opn4Cre/+ and 34 Opn4Cre/+; Cx36flox/flox ipRGCs in the presence of rod/cone signaling blockers to measure each cell’s melanopsin-based response to a 60 s-duration 14.7 log quanta/cm2/s 480 nm stimulus. (A) Averaged spike histograms. (B) The peak light-evoked spike rates. (C) The final-to-peak response ratios quantifying photoresponse sustainability. (D) Left: The first-order exponential decay fit (black curve) of an example ipRGC’s spike histogram between the tallest column and the final column during a 60 s light step. To predict how this cell would respond to a 300 s light, the equation for this fit (y = 2.42 + 54.22e –t/33.67) was used to extrapolate this cell’s spike rate to t = 300. Right: The extrapolated spike rates at t = 300 for all recorded ipRGCs.

Fig. 8A seems to show that, near the end of the 60 s light, the population-averaged Opn4Cre/+ response was beginning to stabilize whereas the Opn4Cre/+; Cx36flox/flox response was still decaying rapidly, suggesting Opn4Cre/+ ipRGCs might be better able to respond continuously to extended illumination. To test this possibility, we fit each ipRGC’s spike histogram with a first-order exponential decay curve (Fig. 8D, left) and extrapolated the fit to 300 s to estimate what the cell’s spike rate would be near the end of a 300 s light step. The extrapolated spike rates differed significantly between the genotypes, 8.17 ± 6.70 spikes s‒1 for Opn4Cre/+ but only 4.35 ± 7.10 spikes s‒1 for Opn4Cre/+; Cx36flox/flox (P = 0.00988; Fig. 8D, right).
Discussion
Our previous studies of ipRGC-AC coupling had several limitations. In Reifler et al. (Reference Reifler, Chervenak, Dolikian, Benenati, Li, Wachter, Lynch, Demertzis, Meyers, Abufarha, Jaeckel, Flannery and Wong2015), we randomly targeted displaced ACs for recording and had no information on which ipRGC types they received input from. We also had no direct proof of electrical coupling since our only evidence was that a gap junction blocker could abolish the displaced ACs’ rod/cone-independent input whose spectral sensitivity matched that of melanopsin. Moreover, we screened only for cells with tonic ON photoresponses; in fact, after detecting just rod/cone-driven responses in a few nonspiking tonic ON ACs, we further restricted our search to spiking tonic ON ACs, potentially missing additional response varieties. In Harrison et al. (Reference Harrison, Chervenak, Resnick, Reifler and Wong2021a), we injected Neurobiotin into ipRGCs to learn which types couple with ACs, but since this tracer can only be visualized by streptavidin binding after tissue fixation, we could not study those ACs electrophysiologically. Further, Neurobiotin labeled only the ACs’ somas, so their neurites’ stratification was unknown. Here, the fluorescent tracer PoPro1 has overcome those limitations by allowing us to record from ipRGC-coupled ACs in living retinas. This is the first successful application of PoPro1 in a nonrabbit retina since Hoshi et al. (Reference Hoshi, O’Brien and Mills2006) discovered its ability to cross retinal gap junctions. We have found it crucial to iontophorese at least 1 mM and for at least 30 min, via sharp electrodes instead of whole-cell recording as the latter causes widespread extracellular staining.
We had previously shown that ipRGCs signal to ON- and ON/OFF-stratified displaced ACs via gap-junction coupling (Reifler et al., Reference Reifler, Chervenak, Dolikian, Benenati, Li, Wachter, Lynch, Demertzis, Meyers, Abufarha, Jaeckel, Flannery and Wong2015). In the current study we came across three ipRGC-coupled displaced ACs with OFF-stratifying neurites, although they represented only 2.4% of all displaced ACs analyzed. Two of those three ACs were completely imaged and somewhat resembled Perez De Sevilla Muller et al.’s (Reference Perez De Sevilla Muller, Shelley and Weiler2007) PA-S1 type. We could have underestimated the prevalence of this type, because the proximal portions of its neurites travel within the ON sublamina for quite a distance before terminating in the OFF sublamina. If some cells of this type were so large that only their proximal neurites could be captured within the field of view, we would likely have misclassified them as ON-stratifying. These OFF-stratified ACs generate ON photoresponses, which are presumably driven by the ipRGCs with which they couple, and/or ON bipolar cells that form ribbon synapses in the OFF sublamina (Dumitrescu et al., Reference Dumitrescu, Pucci, Wong and Berson2009; Hoshi et al., Reference Hoshi, Liu, Massey and Mills2009).
Using Neurobiotin tracing we recently showed that five ipRGC types, especially M3, couple with conventionally placed as well as displaced ACs (Harrison et al., Reference Harrison, Chervenak, Resnick, Reifler and Wong2021a). This was surprising because Muller et al. (Reference Muller, Do, Yau, He and Baldridge2010) had injected Neurobiotin into M1–M3 ipRGCs and found them to couple exclusively with displaced ACs. We proposed that our significantly longer injection time (15 min vs. 3 min) had allowed us to label somas in the INL, although it was also possible that we had labeled them nonspecifically. Using a different tracer in the present study, we again observed ipRGC coupling with INL somas, and recorded from one to show that it remained photosensitive during pharmacological block of light-driven rod/cone input. This M3-coupled AC was OFF-stratified, adding to the above-discussed evidence that ipRGCs couple with OFF-stratified ACs.
These morphological results show that ipRGC-coupled ACs encompass the same stratification patterns exhibited by ipRGCs: OFF (M1), ON (M2, M4, M5), and ON/OFF (M3, M6) (Viney et al., Reference Viney, Balint, Hillier, Siegert, Boldogkoi, Enquist, Meister, Cepko and Roska2007; Ecker et al., Reference Ecker, Dumitrescu, Wong, Alam, Chen, LeGates, Renna, Prusky, Berson and Hattar2010; Quattrochi et al., Reference Quattrochi, Stabio, Kim, Ilardi, Michelle Fogerson, Leyrer and Berson2019). Though each ipRGC type could theoretically couple with any of the three AC varieties—for instance, even an M1 cell’s dendrites could contact an ON-stratified displaced AC as they traverse the ON sublamina before reaching the OFF sublamina—we found the various ipRGC types to couple preferentially with certain AC types. All four OFF-stratified ACs, including the nondisplaced one, were PoPro1-traced from M1 or M3 which have OFF-stratifying dendrites, and most (23 of 25) ON/OFF-stratified ACs were also traced from M1 or M3. While M6 ipRGCs likewise possess OFF dendrites, we found them to couple only with ON-stratified ACs, although the sample size was small. The three ipRGC types containing only ON dendrites were found to couple almost exclusively with ON-stratified ACs: only 2 of their 90 coupled ACs were ON/OFF-stratified, and none were OFF-stratified. Our earlier immunohistochemical data suggested that each ipRGC may couple with ACs containing different neuromodulators (Harrison et al., Reference Harrison, Chervenak, Resnick, Reifler and Wong2021a). The present data further indicate that an M2 or M3 ipRGC may couple with multiple morphological types of ACs.
We also observed new photoresponses among ipRGC-coupled ACs, namely, transient hyperpolarizing responses. All five ACs showing such responses generated purely depolarizing melanopsin-driven responses, suggesting that their hyperpolarizing response components derived from synaptic input, possibly inhibition from other ACs. While these responses could have been an artifact of excessive multiphoton laser exposure, fairly similar responses have been reported in some irradiance-encoding displaced ACs (Jia et al., Reference Jia, Lee, Zhuo and Zhou2020), reinforcing their validity. Pottackal et al. (Reference Pottackal, Walsh, Rahmani, Zhang, Justice and Demb2021) recently described M5-coupled displaced ACs generating nonspiking photoresponses; see also Jacoby et al. (Reference Jacoby, Zhu, DeVries and Schwartz2015) and Park et al. (Reference Park, Pottackal, Ke, Jun, Rahmani, Kim, Singer and Demb2018). While we did detect nonspiking photoresponses in an M2-coupled AC and an M3-coupled AC, all five M5-coupled ACs we sampled gave spiking responses. Thus, our PoPro1-guided search for ipRGC-coupled ACs did not capture all AC types.
All previous electrophysiological studies had investigated just one role of ipRGC-AC coupling: the retrograde transmission of ipRGC photoresponses (Reifler et al., Reference Reifler, Chervenak, Dolikian, Benenati, Li, Wachter, Lynch, Demertzis, Meyers, Abufarha, Jaeckel, Flannery and Wong2015; Sabbah et al., Reference Sabbah, Berg, Papendorp, Briggman and Berson2017; Pottackal et al., Reference Pottackal, Walsh, Rahmani, Zhang, Justice and Demb2021). We now recognize several additional physiologic impacts of such coupling. First, we observed bidirectional electrical transmission between not only an ipRGC and a coupled AC, but also between two ACs coupled via an ipRGC. Whereas transmission was symmetric for one of the two AC–AC pairs recorded, the ipRGC-AC pair showed asymmetric signaling, possibly due in part to a significant mismatch in membrane resistances (Apostolides & Trussell, Reference Apostolides and Trussell2013). Thus, it is conceivable that ipRGCs not only signal retrogradely to most (≥93%) coupled ACs, but also receive input from some coupled ACs. Since most ipRGC-coupled ACs generate ON photoresponses, and electrical synapses are generally sign-preserving (Connors, Reference Connors2017), such AC input would probably be excitatory and add to ipRGCs’ ON photoresponses. Another potential effect of bidirectional transmission is coincidence detection: excitatory inputs to two coupled cells trigger more spikes if the inputs hit the cells at the same time than if they are asynchronous (Galarreta & Hestrin, Reference Galarreta and Hestrin2001; Veruki & Hartveit, Reference Veruki and Hartveit2002). Coincidence detection could cause the ipRGC-AC network to respond more strongly to wide-field illumination that excites many cells simultaneously than to spatially restricted stimuli.
Earlier studies had used paired-cell recordings to demonstrate spike synchrony among directly coupled ACs (Veruki & Hartveit, Reference Veruki and Hartveit2002) and directly coupled ganglion cells (Brivanlou et al., Reference Brivanlou, Warland and Meister1998; Hu & Bloomfield, Reference Hu and Bloomfield2003). Our dual recordings provide the first evidence for synchronized firing between a ganglion cell and a coupled AC, and between two ACs that couple via a ganglion cell; however, we cannot eliminate the possibility that some of the ACs PoPro1-traced from the same ipRGC were also directly coupled with one another. Concerted spiking in the visual system has been proposed to enhance the salience of visual responses (Usrey & Reid, Reference Usrey and Reid1999) and compress information for efficient transmission (Meister & Berry, Reference Meister and Berry1999), and could serve similar functions in ipRGCs’ gap-junction network.
Finally, we have shown that ipRGC-AC coupling shapes the intrinsic light response of ipRGCs, reducing its peak amplitude and transience, but increasing its steady-state spike rate during extended illumination. The lower peak amplitude can easily be explained by the melanopsin photocurrent leaking through gap junctions into ACs, and the resultant decrease in transience may make ipRGCs less sensitive to rapidly changing visual stimuli and hence more selective for low-frequency stimuli. The higher steady-state spike rate should augment ipRGCs’ ability to signal irradiance. Thus, ipRGC-AC coupling adds to the list of diverse mechanisms that promote tonic and long-lasting photoresponses in ipRGCs (Emanuel & Do, Reference Emanuel and Do2015; Mure et al., Reference Mure, Hatori, Zhu, Demas, Kim, Nayak and Panda2016; Zhao et al., Reference Zhao, Pack, Khan and Wong2016; Zhao et al., Reference Zhao, Reifler, Schroeder, Jaeckel, Chervenak and Wong2017a; Harrison et al., Reference Harrison, Reifler, Chervenak and Wong2021b). Light-evoked ipRGC transmission to the coupled ACs could activate excitatory voltage-gated channels in the latter, which then signal back to the ipRGCs via gap junctions to help sustain the photoresponse. Another plausible positive feedback signal is the secretion of certain neuromodulators from the coupled ACs onto the ipRGCs (Harrison et al., Reference Harrison, Chervenak, Resnick, Reifler and Wong2021a; Pottackal et al., Reference Pottackal, Walsh, Rahmani, Zhang, Justice and Demb2021).
In summary, PoPro1 has enabled us to answer the three questions posed in the Introduction: (1) ipRGCs couple with not just ON- and ON/OFF-stratified displaced ACs that exhibit tonic excitatory light responses, but also ON-stratified displaced ACs with transient inhibitory photoresponses, as well as OFF-stratified ACs in both the INL and GCL. (2) While M1 and M3 ipRGCs couple mainly to ON/OFF- and OFF-stratified displaced ACs, the other ipRGCs couple mostly to ON-stratified ones. (3) ipRGC-AC coupling not only serves to transmit light responses from ipRGCs to ACs, but also: supports AC-to-ipRGC signaling; allows bidirectional signaling between ipRGC-coupled ACs; synchronizes spiking; and increases the sustainability of ipRGCs’ melanopsin-based photoresponse. These physiologic effects could boost the responses of ipRGCs and coupled ACs to prolonged, wide-field illumination, thereby improving these neurons’ ability to signal overall ambient irradiance. We hypothesize that ipRGC-AC coupling enhances both irradiance-dependent ipRGC signaling to higher brain regions, and irradiance-dependent intraretinal neuromodulator secretion from ipRGC-coupled ACs. Testing this hypothesis will require currently unavailable tools that selectively disrupt gap junctions between ipRGCs and ACs, as the present Opn4Cre mouse lines express Cre recombinase in not only ipRGCs but also some photoreceptors (Hatori et al., Reference Hatori, Le, Vollmers, Keding, Tanaka, Buch, Waisman, Schmedt, Jegla and Panda2008; Ecker et al., Reference Ecker, Dumitrescu, Wong, Alam, Chen, LeGates, Renna, Prusky, Berson and Hattar2010).
Acknowledgments
The authors thank Stephen Mills for providing PoPro1, Austra Liepa for animal husbandry, and Andrew Chervenak and Aaron Reifler for genotyping.
Funding statement
This work was funded by NIH grants R01 EY023660 and P30 EY007003, and a Research to Prevent Blindness Special Scholar Award.
Competing interests
The authors declare none.