




1. Introduction
The shear instability in a granular medium is involved in many natural hazards such as seismic fault slips and landslides. One of the important and challenging issues in seismic hazard investigation is to understand how small-amplitude seismic waves (of the order of micro-strain) generated by an earthquake can remotely trigger other earthquakes hundreds of kilometres from the source (Hill et al. Reference Hill1993; Gomberg et al. Reference Gomberg, Reasenberg, Bodin and Harris2001). Also, recent observations showed that perturbations from local foreshock activity are probably a part of the earthquake nucleation process (Bouchon et al. Reference Bouchon, Durand, Marsan, Karabulut and Schmittbuhl2013) and that large rockfall events and avalanches can be triggered by volcanic seismicity (Keefer Reference Keefer2002; Durand et al. Reference Durand2018). Dynamic stress from seismic waves can destabilize granular solids and force failure earlier in time relative to an unperturbed fault or slope. Indeed, static and dynamic properties of dense granular media are determined by inhomogeneous contact force networks, exhibiting multiple metastable configurations. Sound waves propagating from grain to grain provide not only a unique probe of such optically opaque networks (Liu & Nagel Reference Liu and Nagel1992; Jia, Caroli & Velicky Reference Jia, Caroli and Velicky1999) but also a controlled perturbation via vibration-induced softening and dissipation (Johnson & Jia Reference Johnson and Jia2005; Jia, Brunet & Laurent Reference Jia, Brunet and Laurent2011). Granular media undergo a transition from a jammed solid state to a flowing liquid state when the external shear exceeds the static yield stress (figure 1a,b).
(a) Two-dimensional schematic illustration of granular flows triggered by small-amplitude ultrasonic or seismic vibration (indicated by double arrows) where the granular layer of thickness  $H$ is deposited on a slope at angle
 $\theta$ below the maximum angle of stability
 $\theta _m$. The inertial flow triggered by ultrasonic vibration is mostly uniform and continuous. (b) Sketch of the normalized stress–strain rate relation in a sheared granular medium: static state (
 $V = 0$), unstable flow (velocity weakening) and stable flow (velocity strengthening). Under a shear
 $\mu$ between
 $\mu _s$ and
 $\mu _d$, the metastable state can be switched abruptly to a flowing state by acoustic perturbation (lubrication).

Previous works denoted this transition as a bifurcation phenomenon (Jaeger et al. Reference Jaeger, Liu, Nagel and Witten1990; Quartier et al. Reference Quartier, Andreotti, Douady and Daerr2000; Baldassarri et al. Reference Baldassarri, Dalton, Petri, Zapperi, Pontuale and Pietronero2006; Dijksman et al. Reference Dijksman, Wortel, van Dellen, Dauchot and van Hecke2011), similar to solid friction at multicontact interfaces (Baumberger & Caroli Reference Baumberger and Caroli2006) described by the rate and state friction law (Marone Reference Marone1998; Scholz Reference Scholz2019). Here, the friction coefficient is defined as  $\mu = \tau / \sigma _n$, as the ratio of the shear stress normalized by the normal stress from which the static and dynamic coefficients of friction
 $\mu _{s,d} = \tau _{s,d}/\sigma _n$ follow, where
 $\tau _s$ is the static friction stress at yield while
 $\tau _d$ is the dynamic friction stress. In the inclined plane geometry considered in this paper (figure 1a), we have
 $\mu = \tan \theta$ and
 $\mu _s = \tan \theta _m,$ with
 $\theta _m$ the (maximum) angle of the avalanche. The angle of repose
 $\theta _r$ being a few per cent lower than
 $\theta _m$ (Pouliquen & Renaut Reference Pouliquen and Renaut1996; Daerr & Douady Reference Daerr and Douady1999; Coussot et al. Reference Coussot, Nguyen, Huynh and Bonn2002; Wyart Reference Wyart2009) corresponds to the dynamic friction
 $\mu _d = \tan \theta _r$ at the minimum shear load (figure 1b). It has been shown (Nasuno, Kudrolli & Gollub Reference Nasuno, Kudrolli and Gollub1997; Bureau, Baumberger & Caroli Reference Bureau, Baumberger and Caroli2001; Parteli, Gomes & Brito Reference Parteli, Gomes and Brito2005; Baumberger & Caroli Reference Baumberger and Caroli2006) that for shear forces far below the static threshold
 $\mu \ll \mu _s$, both granular layers and rough solid interfaces respond elastically as shown in figure 1(b), in the jammed state (region I). For
 $\mu \lesssim \mu _s$, a shear lower than the threshold, a nonlinear response occurs with creep-like irreversible motion. For
 $\mu \gtrsim \mu _s$, the system yields and starts to slide or flow over a transient characteristic distance (Marone Reference Marone1998; Baumberger & Caroli Reference Baumberger and Caroli2006; Scholz Reference Scholz2019) before reaching the steady flow region II/III at a velocity
 $V$ or shear rate
 $\dot {\gamma }$ imposed by the load.
The possible failure of a granular medium, such as a sand pile, caused by external vibrations, has been known for a long time in engineering and geophysical applications; however, a unified physical description is still lacking. The vibrations considered are most of the time of large amplitude  $U_0 \gtrsim d$ with
 $d$ the grain size and low frequency
 $f < f_0$, where
 $f_0$ is a characteristic frequency determined by the stiffness of interfacial contacts (Bureau et al. Reference Bureau, Baumberger and Caroli2001). The amount of shaking is usually estimated by the reduced peak acceleration of the grain
 $\varGamma = a/g$ with
 $a$ the instantaneous acceleration and
 $g$ the gravity. When
 $\varGamma > 1$, vertical vibrations cancel almost normal forces exerting on the grain (confined under gravity) and modify consequently the spatial arrangement of the grains, resulting in phenomena such as compaction, convection, shear banding, to mention a few (Jaeger, Liu & Nagel Reference Jaeger, Liu and Nagel1989; Clement & Rajchenbach Reference Clement and Rajchenbach1991; D'Anna et al. Reference D'Anna, Mayor, Barrat, Loreto and Nori2003). This is similar to the oscillation effect on the normal stress facilitating sliding (Zaloj, Urbakh & Klafter Reference Zaloj, Urbakh and Klafter1999; Cochard, Bureau & Baumberger Reference Cochard, Bureau and Baumberger2003) and also to the scenario of the acoustic lubrication in a confined continuous medium. In this scenario, the acoustic pressure
 $p_a = (\rho c)v_a$, with
 $c$ the sound speed and
 $v_a$ the vibration velocity, is expected to temporally relieve the pressure of the overburden, thereby decreasing the yield stress (Melosh Reference Melosh1996).
The above scenarios, however, involving large-amplitude vibrations, cannot explain the dynamic earthquake triggering by seismic waves at micro- and nano-strain amplitudes (Gomberg et al. Reference Gomberg, Reasenberg, Bodin and Harris2001; Scholz Reference Scholz2019), nor the laboratory experiments using nanometre amplitude ultrasound to soften the material modulus by 30 % via nonlinear dynamics (Johnson & Jia Reference Johnson and Jia2005; Jia et al. Reference Jia, Brunet and Laurent2011). Also, some modifications of the stick-slip cycle by ultrasound remain unexplained (Johnson et al. Reference Johnson, Savage, Knuth, Gomberg and Marone2008). In these situations, the oscillation frequency of ultrasound  $f \geq 40\,{\rm kHz}$ is high compared with the characteristic frequency of
 $f_0 \simeq 5\,{\rm kHz}$ in millimetre-thick granular layers (Bureau et al. Reference Bureau, Baumberger and Caroli2001; Baumberger & Caroli Reference Baumberger and Caroli2006) so that grains cannot have enough inertial normal motion to suppress the weight of the overburden. On the other hand, for a nanometre ultrasonic vibration, the collision-like pressure estimated as
 $p_c \simeq 10^{-4}\,{\rm Pa} \ll \sigma _n\ (\simeq 10\,{\rm Pa})$ is too small to be considered.
Recently, it was evidenced by lab experiments (Leópoldès et al. Reference Leópoldès, Jia, Tourin and Mangeney2020) that the triggering of granular instabilities by small-amplitude ( ${U_0}/d \simeq 10^{-5}$) and high-frequency (
 $\,f = 70\,{\rm kHz}$) ultrasound waves can be explained by acoustic shear lubrication of grain contacts. This interparticle friction reduction consequently lowers the effective friction coefficient on the macroscopic scale and triggers the granular flow at an inclined angle below
 $\theta _m$ (figure 1b) without causing the rearrangement of grain positions. However, it remains unclear how such local effects could give rise to collective motion and also their possible delay of response (Durand et al. Reference Durand2018). In particular, the micro processes of triggering remain poorly understood, as small-amplitude ultrasound does not induce grain displacement per se at the relevant length scale (i.e. grain diameter
 $d$) during avalanches.
In this paper we address these questions by presenting numerical simulations of the onset of flows of a granular layer initially static on an inclined plane, triggered by ultrasound applied from the basal plane. To do so, we propose an original coupling model, relying on a time-scale separation, with one time scale representing the grain-scale dynamics (called the grain-motion time scale) and the other representing the ultrasonic vibration in the granular medium (called the vibration time scale). At the vibration time scale, the granular packing (particles) is considered quasi-static. Therefore, our methodology involves coupling a discrete element model (DEM) for grain flows with a mass-spring model (network) for wave vibration. The latter is investigated in the steady (harmonic) regime through vibrational (eigen) modes. Once the amplitudes of the vibration field are computed, the acoustic lubrication effect on the (entire) granular medium is taken into account through modifications of the interparticle friction coefficients, according to the Mindlin model (Leópoldès et al. Reference Leópoldès, Jia, Tourin and Mangeney2020). To our knowledge, this is the first time such a coupling numerical methodology has been employed to study the acoustic lubrication effect on the granular flow.
The advantages of this time-scale separation are twofold. Firstly, it simplifies (isolates) the simulation of acoustic propagation through a ‘frozen’ (or a snapshot of) granular network at a given flowing instance. Here the interparticle friction coefficients may be modified solely by the irreversible ultrasound-matter interaction (Johnson & Jia Reference Johnson and Jia2005; Jia et al. Reference Jia, Brunet and Laurent2011; Leópoldès et al. Reference Leópoldès, Jia, Tourin and Mangeney2020) and are not affected by particle collisions or other phenomena occurring at the grain-motion time scale. Additionally, this approach offers high computational efficiency since we can use relatively large time steps ( $\Delta t_g = 1\,{\rm ms}$ at the grain-motion time scale) without losing the ultrasound-induced effects, thereby allowing for the consideration of large assemblies of grains that can be compared with experimental data in laboratory settings (see typical times of simulations in Martin et al. (Reference Martin, Mangeney, Lefebvre-Lepot, Maury and Maday2023a)). The computational time efficiency is discussed in § 2.4. The model utilized at the grain-motion time scale is the convex optimization contact dynamics (COCD) discrete element method, which has been proposed and validated in Martin et al. (Reference Martin, Mangeney, Lefebvre-Lepot, Maury and Maday2023a), and compared with other granular models in Martin et al. (Reference Martin, Peruzzetto, Viroulet, Mangeney, Lagrée, Popinet, Maury, Lefebvre-Lepot, Maday and Bouchut2023b).
The numerical method is presented at various time scales in § 2. Section 3 contains all the results we obtain, both with and without destabilization due to basal vibrations. In § 4 we then discuss the physical interparticle mechanisms responsible for the destabilization we have identified, the changes that occur when we alter the vibration parameters and compare our results with experiments.
2. Numerical models for granular flows and ultrasonic vibrations
To model the acoustic triggering of granular flows induced by basal ultrasounds at the laboratory scale, our strategy is to take into account the vibration-induced change of the interparticle friction coefficient  $\mu _p$. This is done by considering the very different time scales of grain motion and ultrasounds, respectively. We then consider a grain-motion time scale that is of the order of small grain motions and a vibration time scale.
Concerning the grain-motion time scale, for a granular flow on a slope, the horizontal velocity scale is given by  $U = \sqrt {g H \cos \theta }$, where
 $g$ is the gravitational constant,
 $H$ is the thickness of the granular mass and
 $\theta$ is the slope angle. In our configuration,
 $H$ lies between
 $3d$ and
 $14.4d$, where
 $d$ is the mean diameter of the grains (0.7 mm), resulting in
 $0.002 \leq H \leq 0.011\,{\rm m}$, and thus,
 $0.14 \lesssim U \lesssim 0.32\,{\rm m}\,{\rm s}^{-1}$. We use a time scale where a grain moving at velocity
 $U$ covers its own radius, i.e.
 $L = 0.35\,{\rm mm}$. This time scale is then given by
 $T = L / U$, and it falls within the range of approximately
 $10^{-3} \lesssim T \lesssim 2.5\times 10^{-3}\,{\rm s}$. We adopt the smallest value as the common time scale for all our grain displacement simulations, i.e. the grain-motion time scale is
 $\Delta t_g = 1\,{\rm ms}$.
Regarding the vibration time scale, experimental measurements of the speed of sound in a granular assembly at rest and maintained by a low confined stress (for instance, by gravity) have been made where small but finite values of sound speed  $c = 10\unicode{x2013}100\,{\rm m}\,{\rm s}^{-1}$ were measured (Liu & Nagel Reference Liu and Nagel1992; Bonneau, Andreotti & Clément Reference Bonneau, Andreotti and Clément2008; van den Wildenberg, van Hecke & Jia Reference van den Wildenberg, van Hecke and Jia2013; Brum et al. Reference Brum, Gennisson, Fink, Tourin and Jia2019). These values are much larger than the sound speed predicted by the effective medium theory based on the simplified normal contact force (i.e. the Hertz model),
 $c \simeq p^{1/6}$ in a granular pack loaded by a hydrostatic pressure
 $p = \rho g h$. This would give rise to
 $c \simeq 0.1\,{\rm m}\,{\rm s}^{-1}$ for
 $h = 5\unicode{x2013}10\,{\rm mm}$. Such a discrepancy may stem from the interlocking effect (i.e. arching) due to frictional contact (tangential) forces and heterogeneous anisotropic stress networks (i.e. force chains), which depend on the sample configuration and loading history (memory effect) as well as the confining boundary (Jaeger et al. Reference Jaeger, Liu, Nagel and Witten1990). As shown in Khidas & Jia (Reference Khidas and Jia2010) and Johnson et al. (Reference Johnson, Schwartz, Elata, Berryman, Hornby and Norris1998), elastic wave velocities (longitudinal and transversal) do remain finite in a compacted granular packing after the removal of the applied stress, likely due to the tight wedging or interlocking of grains that result in a residual stress network. Using again the mean grain radius as a characteristic distance, we get a time scale approximately from
 $T = L / c$, i.e.
 $T \simeq 12\,\mathrm {\mu }$s, estimated with
 $c = 30\,{\rm m}\,{\rm s}^{-1}$ (Leópoldès et al. Reference Leópoldès, Jia, Tourin and Mangeney2020). Hence, we adopt this value as the time scale for sound propagation
 $\Delta t_w = 10\,\mathrm {\mu }$s. Note that it is smaller than the grain displacement time scale by a factor of 100, justifying our approach that separates these two-time scales.
Consequently, at the vibration time scale  $\Delta t_w$, the granular assembly can be considered as frozen. We thus consider two different models at these two different time scales. At the grain-motion time scale
 $\Delta t_g$, grain motion is described based on the discrete element method COCD (Martin et al. Reference Martin, Mangeney, Lefebvre-Lepot, Maury and Maday2023a), which represents the macroscopic motion of each particle in a granular assembly. Then, at the vibration time scale, the vibration model computes the infinitesimal perturbations of each grain position, around an equilibrium configuration provided by the grain-motion model. We first briefly introduce the grain-motion model COCD developed by Martin et al. (Reference Martin, Mangeney, Lefebvre-Lepot, Maury and Maday2023a) (§ 2.1). Then we present the the wave equation and the vibration model (§ 2.2), and finally describe the Mindlin model (§ 2.3) that deals with the vibration-induced reduction of interparticle friction coefficients. We close this modelling section by briefly presenting the computational time efficiency (§ 2.4).
2.1. Grain-motion model COCD
In our grain-motion model COCD, the granular media is represented by a collection of rigid particles (see figure 1a) like glass spheres (Martin et al. Reference Martin, Mangeney, Lefebvre-Lepot, Maury and Maday2023a). The equations of motion are solved for each particle at every time step to determine their respective contact forces. These interactions are traditionally described using the Hertz theory, utilizing nonlinear damped springs as commonly seen in the molecular dynamics (MD) framework (see Cundall's pioneering work in Cundall & Strack (Reference Cundall and Strack1979)). However, in this paper we adopt an alternative method called contact dynamics (CD), originally introduced by Moreau and Jean in the 1990s (Moreau Reference Moreau1988; Jean & Moreau Reference Jean and Moreau1992; Moreau Reference Moreau1994, Reference Moreau1999; Jean Reference Jean1999; Moreau Reference Moreau2004). In contrast to MD, where contact forces are modelled using functions derived from the Hertz theory, CD employs linear impulses. These impulses adhere to contact laws governing both normal repulsion and tangential friction.
Numerous numerical techniques have been put forth for CD models (Staron & Hinch Reference Staron and Hinch2005; Anitescu Reference Anitescu2006; Maury Reference Maury2006; Tasora, Negrut & Anitescu Reference Tasora, Negrut and Anitescu2008; Radjai & Richefeu Reference Radjai and Richefeu2009; Acary et al. Reference Acary, Cadoux, Lemaréchal and Malick2011; Seguin et al. Reference Seguin, Lefebvre-Lepot, Faure and Gondret2016; Bloch & Lefebvre-Lepot Reference Bloch and Lefebvre-Lepot2023; Martin et al. Reference Martin, Mangeney, Lefebvre-Lepot, Maury and Maday2023a). Close to the framework of the SCoPI Software (2022), in COCD's approach, particle velocities and positions are computed simultaneously through an implicit scheme, necessitating the solution of a convex minimization problem during each time integration step.
Within the CD framework, two contact laws are validated at each contact and time step. The first law establishes a complementarity problem between the normal distance and the intensity of the normal contact force. This implies that grains cannot overlap or engage in interaction unless they are in contact, and the force between any two grains is inherently repulsive. In mathematical terms, this relationship is represented as
 \begin{equation} f_n^{ij} \geq 0,\quad {D}_{ij}\geq 0,\quad f_n^{ij} {D}_{ij} =0, \end{equation}
where  $i$ and
 $j$ denote two particles,
 ${D}_{ij}$ is their normal distance and
 $f_n^{ij}$ represents the intensity of the normal force between them (see figure 2a,b). The second validated contact law pertains to the Coulomb friction law (figure 2a,c), encompassing both the tangential and normal components of the contact force belonging to Coulomb's cone, expressed as
 \begin{equation} \left.\begin{gathered} \boldsymbol{f}_t^{ij} ={-} \mu_{ij} f_n^{ij} \boldsymbol{v}_t^{ij} / \|\boldsymbol{v}_t^{ij}\|,\quad \text{if} \|\boldsymbol{v}_t^{ij}\| > 0, \\ \|\,\boldsymbol{f}_t^{ij}\| \leq \mu_{ij} f_n^{ij},\quad \text{if}\ \|\boldsymbol{v}_t^{ij}\| = 0, \end{gathered}\right\} \end{equation}
where  $\|{\cdot }\|$ denotes the Euclidean norm,
 $\mu _{ij}$ is the interparticle friction coefficient (
 $\mu _p$),
 $\boldsymbol {f}_t^{ij} \in \mathbb {R}^3$ denotes the tangential force vector and
 $\boldsymbol {v}_t^{ij} \in \mathbb {R}^3$ is the tangential relative velocity vector between the two spheres
 $i$ and
 $j$. To be as general as possible, we subsequently introduce the equations of motion in three dimensions despite the fact that the simulations that are presented in this paper are in two dimensions.
Two-dimensional schematic depiction of the two contact laws. (a) Representation of a three-disk situation: disks 1 and 2 are not in contact, while disks 2 and 3 are. Here  ${D}_{ij}$, (
 $1 \leq i < j \leq 3$) indicates the normal distance between disks
 $i$ and
 $j$,
 $f_n^{ij}$ is the normal force's intensity at the contact,
 $\boldsymbol {n}_{2,3}$ (respectively
 $\boldsymbol {t}_{2,3}$) is the unit normal (respectively tangential) vector at the contact between disks 2 and 3,
 ${\boldsymbol {f}_t}^{2,3}$ denotes the tangential force vector and
 ${\boldsymbol {v}_t}^{2,3}$ is the tangential relative velocity vector between disks 2 and 3. (b) Graph representing the normal law. (c) Graph depicting the Coulomb friction law. Here
 $\boldsymbol {x} \boldsymbol {\cdot } \boldsymbol {y}$ denotes the dot product of vectors
 $\boldsymbol {x}$ and
 $\boldsymbol {y}$. (d) Notations in three dimensions.

Consider a mechanical system in  $\mathbb {R}^3$, consisting of
 $N$ rigid spheres capable of rotation, each with specified fixed radii
 $r_i > 0$ and masses
 $m_i > 0$,
 $i = 1, \ldots, N$. The centre of the sphere
 $i$ is represented by
 $\boldsymbol {c}_i \in \mathbb {R}^3$ and its instantaneous velocity by
 $\boldsymbol {v}_i \in \mathbb {R}^3$. As we are exclusively dealing with spheres, we do not track the orientation of bodies; instead, we focus solely on the instantaneous rotation vector, denoted as
 $\boldsymbol {\omega }_i\in \mathbb {R}^3$. We denote by
 \begin{equation} \boldsymbol{c} = (\boldsymbol{c}_1, \ldots,\boldsymbol{c}_N)\in \mathbb{R}^{3N}\quad \text{and}\quad \boldsymbol{u} = (\boldsymbol{v}_1,\boldsymbol{\omega}_1,\ldots,\boldsymbol{v}_N,\boldsymbol{\omega}_N) \in\mathbb{R}^{6N} \end{equation}
the generalized position and velocity field vectors.
The signed distance between spheres  $i$ and
 $j$ is defined by
 \begin{equation} {D}_{ij} (\boldsymbol{c})= \|\boldsymbol{c}_i - \boldsymbol{c}_j\| - (r_{i} + r_j), \end{equation}
so that the non-overlapping condition writes  ${D}_{ij} \geq 0$.
For any pair of grains  $i$ and
 $j$, with respective centres represented by
 $\boldsymbol {c}_i$ and
 $\boldsymbol {c}_j$, we use
 $\boldsymbol {C}_i$ and
 $\boldsymbol {C}_j$ to indicate the points that establish the distance (with
 $\boldsymbol {C}_i = \boldsymbol {C}_j$ when the spheres are in contact; refer to figure 2d). We define the corresponding position vectors as
 $\boldsymbol {r}_i = \boldsymbol {C}_i - \boldsymbol {c}_i$,
 $\boldsymbol {r}_j = \boldsymbol {C}_j - \boldsymbol {c}_j$.
We define the direction perpendicular to the surfaces of the particles at points  $\boldsymbol {C}_i$ and
 $\boldsymbol {C}_j$, a direction common to both particles. We introduce the unit vector
 $\boldsymbol {n}_{ij} \in \mathbb {R}^3$, which is defined as the corresponding normal vector pointing towards particle
 $i$. Given that we are dealing with spherical particles, we have
 \begin{equation} \boldsymbol{n}_{ij} = \frac{\boldsymbol{c}_i - \boldsymbol{c}_j}{\|\boldsymbol{c}_i - \boldsymbol{c}_j\|}. \end{equation}
We denote by  $\boldsymbol{\mathsf{P}}_{ij} \boldsymbol {v} = \boldsymbol {v} - (\boldsymbol {v}\boldsymbol {\cdot } \boldsymbol {n}_{ij}) \boldsymbol {n}_{ij} \in \mathbb {R}^3$ the projection of
 $\boldsymbol {v}$ on
 $\varPi _{ij}$, the plane that is orthogonal to
 $\boldsymbol {n}_{ij}$ and, thus, parallel to the tangent planes in
 $\boldsymbol {C}_i$ and
 $\boldsymbol {C}_j$.
We also define  $\boldsymbol{\mathsf{A}}_{ij}$ from
 $\mathbb {R}^{6N}$ to
 $\mathbb {R}^3$ as the linear operator that maps the generalized velocity field
 $\boldsymbol {u}\in \mathbb {R}^{6N}$ to the relative velocity between the points
 $\boldsymbol {C}_i$ and
 $\boldsymbol {C}_j$ at which the distance between spheres
 $i$ and
 $j$ is attained, i.e.
 \begin{equation} \boldsymbol{\mathsf{A}}_{ij} \boldsymbol{u}= \boldsymbol{v}_i + \boldsymbol{\omega}_i \wedge \boldsymbol{r}_i - (\boldsymbol{v}_j + \boldsymbol{\omega}_j \wedge \boldsymbol{r}_j) \in \mathbb{R}^{3}. \end{equation}
Direct calculations demonstrate that, for any generalized velocity  $\boldsymbol {u}\in \mathbb {R}^{6N}$ and any vector
 $\boldsymbol {f} \in \mathbb {R}^3$, we obtain
 $\boldsymbol{\mathsf{A}}_{ij} \boldsymbol {u} \boldsymbol {\cdot } \boldsymbol {f} = \boldsymbol {u} \boldsymbol {\cdot } \boldsymbol{\mathsf{A}}_{ij}^\textrm {T} \boldsymbol {f}$ with
 \begin{equation} \boldsymbol{\mathsf{A}}_{ij}^{\rm T} \boldsymbol{f} = ({\mathbf 0},\ldots, {\mathbf 0}, \underbrace{\boldsymbol{f}, \boldsymbol{r}_i \wedge \boldsymbol{f}}_{{position\ i}}, {\mathbf 0}, \ldots, {\mathbf 0}, \underbrace{- \boldsymbol{f}, - \boldsymbol{r}_j \wedge \boldsymbol{f}}_{{position\ j}}, {\mathbf 0},\ldots,{\mathbf 0}) \in \mathbb{R}^{6N}, \end{equation}
so that  $\boldsymbol{\mathsf{A}}_{ij}^\textrm {T}$ maps a vector
 $\boldsymbol {f}\in \mathbb {R}^{3}$ to the generalized force/moment vector corresponding to the force
 $\boldsymbol {f}$ exerted on particle
 $i$ at point
 $\boldsymbol {C}_i$ and the opposite force
 $-\boldsymbol {f}$ exerted on particle
 $j$ at point
 $\boldsymbol {C}_j$.
The vector  $\boldsymbol{\mathsf{P}}_{ij} \boldsymbol{\mathsf{A}}_{ij} \boldsymbol {u} = \boldsymbol {v}_t^{ij} \in \mathbb {R}^3$ represents the tangential relative velocity. Consequently, when two spheres are in contact without any relative normal motion (i.e.
 $\boldsymbol {n}_{ij} \boldsymbol {\cdot } \boldsymbol{\mathsf{A}}_{ij} \boldsymbol {u} = 0$), the expression
 $\|\boldsymbol{\mathsf{P}}_{ij} \boldsymbol{\mathsf{A}}_{ij} \boldsymbol {u}\| = 0$ indicates a rolling motion with no slip, while
 $\|\boldsymbol{\mathsf{P}}_{ij} \boldsymbol{\mathsf{A}}_{ij} \boldsymbol {u}\| > 0$ corresponds to a sliding motion.
At any time, we shall denote by  $I_c$ the set of all possible pairs of contacts:
 $I_c = \{(i,j)\ 1\leq i < j \leq N \}$. Note that the pair of grains
 $i$ and
 $j$ is represented only once in
 $I_c$ through the couple
 $(i,j)$ if
 $i< j$ and
 $(j,i)$ if
 $j< i$. We denote by
 ${N_c}$ the total number of potential pairs of spheres, which is also the cardinal of set
 $I_c$, i.e.
 ${N_c} = \mathrm {card}(I_c) = N(N-1)/2$.
We consider that no external torque is exerted on the grains. If  $\boldsymbol {f}_i^{ext}\in \mathbb {R}^{3}$ is the external force exerted on particle
 $i$, we define the generalized force vector as
 $\boldsymbol {f}^{ext}=(\boldsymbol {f}_1^{ext},0, \ldots, \boldsymbol {f}_n^{ext},0)\in \mathbb {R}^{6N}$. We then define the
 $6N\times 6N$ generalized mass matrix (masses and moments of inertia) as
 \begin{equation} \boldsymbol{\mathsf{M}} = \mbox{diag}(m_1,m_1,m_1,J_1,J_1,J_1, m_2,\ldots, J_{N},J_{N},J_{N}). \end{equation}
Finally, the equations of motion write
 $$\begin{gather} \boldsymbol{\mathsf{M}} \frac{\mathrm{d} \boldsymbol{u}}{\mathrm{d} t} = \boldsymbol{f}^{ext} + \sum_{\alpha \in I_c} \boldsymbol{\mathsf{A}}_{\alpha}^{\rm T} (f ^{\alpha}_n \boldsymbol{n}_{\alpha} + \boldsymbol{f} ^{\alpha}_t), \end{gather}$$
 $$\begin{gather}f^{\alpha}_n \geq 0,\quad {D}_\alpha\geq 0,\quad f^{\alpha}_n {D}_\alpha = 0,\quad \alpha \in I_c, \end{gather}$$
 $$\begin{gather}\mbox{if } {D}_\alpha (\boldsymbol{c})= 0 \mbox{ then } (\boldsymbol{\mathsf{A}}_\alpha \boldsymbol{u}^+) \boldsymbol{\cdot}\boldsymbol{n}_{\alpha}= 0,\quad \alpha \in I_c, \end{gather}$$
 $$\begin{gather}\mbox{if } \|\boldsymbol{\mathsf{P}}_{\alpha} \boldsymbol{\mathsf{A}}_{\alpha} \boldsymbol{u}^+\| > 0 \mbox{ (sliding motion)},\quad {\boldsymbol{f}^\alpha _t} ={-} \mu_\alpha f^\alpha_n \frac{\boldsymbol{\mathsf{P}}_{\alpha} \boldsymbol{\mathsf{A}}_\alpha \boldsymbol{u}^+}{\|\boldsymbol{\mathsf{P}}_{\alpha} \boldsymbol{\mathsf{A}}_\alpha \boldsymbol{u}^+\|},\quad \alpha \in I_c, \end{gather}$$
 $$\begin{gather}\mbox{if } \|\boldsymbol{\mathsf{P}}_{\alpha} \boldsymbol{\mathsf{A}}_{\alpha} \boldsymbol{u}^+\| = 0 \mbox{ (no slip)},\quad \|{\boldsymbol{\,f}^\alpha _t }\| \leq \mu_\alpha f^\alpha_n, \quad \alpha \in I_c. \end{gather}$$
Equation (2.11) is added to the normal (2.10) and tangential contact laws (2.12)–(2.13). It specifies an inelastic collision law (the coefficient of restitution is zero). Observe that translational and rotational velocities are prone to being non-smooth, experiencing instantaneous jumps during collisions. Specifically, the post-collision velocity  $\boldsymbol {u}^+$ may differ from the pre-collision velocity
 $\boldsymbol {u}^-$. Consequently, the mentioned evolution is to be interpreted in a weak, distributional sense.
Let us provide some additional remarks on the preceding equations. For a pair of grains  $\alpha =(i,j)\in I_c$, where
 $I_c$ denotes the set of contacts, the corresponding vector
 $f ^{ij}_n \boldsymbol {n}_{ij} + \boldsymbol {f}^{ij}_t \in \mathbb {R}^3$ is transmitted to both particles
 $i$ and
 $j$ through the transpose of
 $\boldsymbol{\mathsf{A}}_{ij}$. To elaborate, let us introduce the following definitions:
 \begin{equation} f^{ji}_n = f^{ij}_n,\quad \boldsymbol{f}^{ji}_t ={-} \boldsymbol{f}^{ij}_t,\quad \forall\ \alpha =(i,j)\in I_c. \end{equation}
Then, utilizing the expression for  $\boldsymbol{\mathsf{A}}_{ij}^\textrm {T}$, (2.9) can be reformulated as follows:
 \begin{equation} \left.\begin{gathered} m_i \dot{\boldsymbol{v}}_i = \boldsymbol{f}^{ext}_i + \sum_{j, j \neq i} (f ^{ij}_n \boldsymbol{n}_{ij} + \boldsymbol{f}^{ij}_t ),\quad \forall\ i=1\cdots N,\\ J_i \dot{\boldsymbol{\omega}}_i = \sum_{j, j \neq i} (\boldsymbol{r}_i \wedge \boldsymbol{f}^{ij}_t),\quad \forall\ i=1\cdots N. \end{gathered}\right\} \end{equation}
This corresponds to Newton's second law, where the contact between particles  $i$ and
 $j$ induces the force
 $f^{ij}_n \boldsymbol {n}_{ij} + \boldsymbol {f} ^{ij}_t$ on particle
 $i$. The reciprocity of this contact's action on both particles is evident from the definitions of
 $f^{ji}_n$ and
 $\boldsymbol {f}^{ji}_t$, derived from
 $f^{ij}_n$ and
 $\boldsymbol {f}^{ij}_t$. The normal force exerted on sphere
 $i$ due to this contact is
 $f ^{ij}_n \boldsymbol {n}_{ij}$, and
 $\boldsymbol {f}^{ij}_t \in \varPi _{ij}$ represents the frictional (tangential) force, which lies in the plane orthogonal to
 $\boldsymbol {n}_{ij}$.
From (2.10), we deduce  $f^{ij}_n = f^{\alpha }_n \geq 0$. This, combined with the orientation of
 $\boldsymbol {n}_{ij}$ from particle
 $j$ to particle
 $i$, ensures that this force is repulsive, as anticipated. Equation (2.10) also guarantees that the distances between the particles remain positive, and the normal force is null whenever the distance is strictly positive (i.e. the particles are not in contact).
The mechanical characteristics of such granular media arise from a synergy of geometrical particle rearrangements and interparticle friction forces. To be precise, the macroscopic static friction coefficient  $\mu _s=\tan (\theta _m)$ – with
 $\theta _m$ the (maximum) angle of the avalanche – can be understood as a composite of the interparticle friction coefficient
 $\mu _p$ and the geometric confinement effect (dilatancy)
 $\mu _g$ (Leópoldès et al. Reference Leópoldès, Jia, Tourin and Mangeney2020). The coefficient
 $\mu _g$ is influenced by factors such as grain shapes, masses or inertia, while
 $\mu _p$ serves as a defined parameter within the model, integral to the classical Coulomb law of friction for all grain-to-grain or grain-to-wall interactions.
The value of  $\mu _p$ employed in this paper is
 $\mu _p=0.25$. This choice falls within a comparable range to the friction coefficient
 $\mu _p=0.3$, calibrated through three-dimensional simulations and experiments (Martin et al. Reference Martin, Mangeney, Lefebvre-Lepot, Maury and Maday2023a,Reference Martin, Peruzzetto, Viroulet, Mangeney, Lagrée, Popinet, Maury, Lefebvre-Lepot, Maday and Bouchutb), and the friction coefficient measured for an ideal glass-to-glass contact,
 $\mu _p = 0.4$ (The Engineering ToolBox 2022), as well as that determined using DEM,
 $\mu _p = 0.16$ (Tang et al. Reference Tang, Song, Dong and Song2019).
2.2. Wave equation and vibrational modes
2.2.1. Wave equation
At the wave propagation or vibration time scale, the grains motions may be supposed quasi-static or frozen. As mentioned above, however, the quantitative description of sound propagation in such weakly confined amorphous-like granular media is not available (Makse et al. Reference Makse, Gland, Johnson and Schwartz2004). To capture qualitatively the interaction between ultrasounds and the granular flow (see § 2.3), we model the vibration of grains, for a first approximation, as in a two-dimensional network of mass spring (mimicking a normal contact stiffness). Here the tangential force and rotational motion are neglected, i.e. the particles are considered as frictionless. Neglecting the disturbances propagating through tangential forces is a working hypothesis that could potentially underestimate quantitatively the effective shear modulus and wave velocity due to the cancellation of tangential contact stiffness (Makse et al. Reference Makse, Gland, Johnson and Schwartz2004) and neglect the frictional dissipation during the wave propagation (Brunet, Jia & Mills Reference Brunet, Jia and Mills2008). However, such an assumption should not affect the qualitative behaviour of the wave vibration in granular networks (Leibig Reference Leibig1994; Harazi et al. Reference Harazi, Yang, Fink, Tourin and Jia2017), and our results show that considering only the normal forces already produces qualitatively satisfactory results (see § 3). Nevertheless, the friction forces are accounted for in the grain-motion model COCD and for investigating the lubrication effect at grain contacts induced by shear acoustic waves (see § 2.3). The sound propagation is characterized by the perturbed positions of the centres of the masses  $\boldsymbol {c}_i \in \mathbb {R}^3$; see e.g. a similar model proposed in Somfai et al. (Reference Somfai, Roux, Snoeijer, van Hecke and van Saarloos2005). Thanks to an expansion around an assumed equilibrium configuration, we establish a wave equation for infinitesimal perturbations from this equilibrium position. The full description of the equations derivation can be found in Appendix A.
Similarly to the operator  $\boldsymbol{\mathsf{P}}_{ij} \boldsymbol{\mathsf{A}}_{ij}$ and since we do not account for rotational motion, we define
 $\boldsymbol{\mathsf{N}}_{ij}$ as the linear operator from
 $\mathbb {R}^{3N}$ to
 $\mathbb {R}$ that maps the generalized grain velocity vector of translation
 $\bar {\boldsymbol {u}} = (\boldsymbol {v}_1, \boldsymbol {v}_2, \ldots, \boldsymbol {v}_N) \in \mathbb {R}^{3N}$ to the relative normal velocity between the spheres
 $i$ and
 $j$ (grains), projected on the line generated by the normal vector
 $\boldsymbol {n}_{ij}$, i.e.
 \begin{equation} \boldsymbol{\mathsf{N}}_{ij} \bar{\boldsymbol{u}} = ( \boldsymbol{v}_i - \boldsymbol{v}_j ) \boldsymbol{\cdot} \boldsymbol{n}_{ij} \in \mathbb{R}. \end{equation}
Straightforward computations show that for any generalized velocity  $\bar {\boldsymbol {u}} \in \mathbb {R}^{3N}$ and any scalar
 $f_n \in \mathbb {R}$, we have
 $f_n \boldsymbol{\mathsf{N}}_{ij} \bar {\boldsymbol {u}} = \bar {\boldsymbol {u}} \boldsymbol {\cdot } \boldsymbol{\mathsf{N}}_{ij}^\textrm {T} f_n$ with
 \begin{equation} \boldsymbol{\mathsf{N}}_{ij}^{\rm T} f_n = ({\mathbf 0},\ldots, {\mathbf 0}, \underbrace{f_n \boldsymbol{n}_{ij}}_{{position\ i}},\ {\mathbf 0}, \ldots, {\mathbf 0}, \underbrace{-f_n \boldsymbol{n}_{ij}}_{{position\ j}},\ {\mathbf 0},\ldots,{\mathbf 0}) \in \mathbb{R}^{3N}, \end{equation}
so that  $\boldsymbol{\mathsf{N}}_{ij}^\textrm {T}$ maps a scalar
 $f_n \in \mathbb {R}$ to the generalized force vector corresponding to the force
 $f_n \boldsymbol {n}_{ij}$ exerted on particle
 $i$ at point
 $\boldsymbol {c}_i$ and the opposite force
 $-f_n \boldsymbol {n}_{ij}$ exerted on particle
 $j$ at point
 $\boldsymbol {c}_j$.
We then define the linear operator  $\boldsymbol{\mathsf{N}}$ from
 $\mathbb {R}^{3N}$ into
 $\mathbb {R}^{N_c}$ corresponding to the combination of all maps
 $\boldsymbol{\mathsf{N}}_\alpha$,
 $\alpha \in I_c$, i.e. for any
 $\boldsymbol {v} \in \mathbb {R}^{3N}$, we have
 $\boldsymbol{\mathsf{N}} \boldsymbol {v} = ( \boldsymbol{\mathsf{N}}_{1,2} \boldsymbol {v}, \boldsymbol{\mathsf{N}}_{1,3} \boldsymbol {v}, \ldots, \boldsymbol{\mathsf{N}}_{N-1,N} \boldsymbol {v}) \in \mathbb {R}^{N_c}$ and, for any
 $\boldsymbol {f} \in \mathbb {R}^{N_c}$, we have the equality
 $\boldsymbol{\mathsf{N}} \boldsymbol {v} \boldsymbol {\cdot } \boldsymbol {f} = \boldsymbol {v} \boldsymbol {\cdot } \boldsymbol{\mathsf{N}}^\textrm {T} \boldsymbol {f}$.
We now define the  ${N_c} \times {N_c}$ diagonal square matrix
 $\boldsymbol{\mathsf{K}}$, which contains the elastic properties of the system:
 \begin{align}
\boldsymbol{\mathsf{K}} &= \tfrac{3}{2} \mathrm{diag}
((\kappa_{1,2})^{2/3} (\,{f_n^{1,2}})^{1/3},\ldots,
(\kappa_{ij})^{2/3} (\,{f_n^{ij}})^{1/3}, \nonumber\\ &\quad
\ldots, (\kappa_{N -1, N})^{2/3} (\,{f_n^{N -1,N
}})^{1/3})\in \mathbb{R}^{{N_c} \times {N_c}}. \end{align}
Here  $f_n^{ij}$ still represents the intensity of the normal force between particles
 $i$ and
 $j$ and where
 $\kappa _{ij} > 0$ is a constant depending on grains properties; see Appendix A.1.
We finally define the  $3N\times 3N$ generalized mass matrix (masses only) as
 \begin{equation} \bar{\boldsymbol{\mathsf{M}}} = \mbox{diag}(m_1,m_1,m_1,m_2,m_2,m_2\ldots, m_{N},m_{N},m_{N}). \end{equation}
At the end, a wave equation is defined for any  $\boldsymbol {e} \in \mathbb {R}^{3N}$ by
 \begin{equation} \bar{\boldsymbol{\mathsf{M}}} \frac{\mathrm{d}^2 \boldsymbol{e}}{{\mathrm{d} t}^2} + \boldsymbol{\varLambda} \boldsymbol{e} = 0, \end{equation}
where the linear map defined by the matrix
 \begin{equation} \boldsymbol{\varLambda} = \boldsymbol{\mathsf{N}}^{\rm T} \boldsymbol{\mathsf{K}} \boldsymbol{\mathsf{N}} \in \mathbb{R}^{3N \times 3N} \end{equation}
can be seen as a kind of discrete Laplace operator, and where  $\varepsilon$ indicates that
 $\boldsymbol {e}$ is only an infinitesimal perturbation of configuration
 $\boldsymbol {c}$.
The operator  $\boldsymbol {\varLambda }$ depends on the contact network through operator
 $\boldsymbol{\mathsf{N}}$, formed by the generalized position vector at equilibrium
 $\boldsymbol {c}$ and embeds the elastic properties of the granular assembly, characterized by the constant normal force intensities exerted between any particles
 $i$ and
 $j$, i.e.
 $f_n^{ij} \geq 0$ for
 $1 \leq i < j \leq n$. These normal force intensities
 $f_n^{ij}$ are provided by the grain-motion model resolving the normal, tangential and collision laws (see § 2.1 and Maury Reference Maury2006; Martin et al. Reference Martin, Mangeney, Lefebvre-Lepot, Maury and Maday2023a) and they are not modified by the vibrations at the vibration time scale.
In the classical form of the wave equation ( $\partial _t^2 u - c^2 \Delta u =0$), the square of the sound speed (constant)
 ${c}^2$ is before the Laplace operator
 $\varDelta$. In our framework (2.20), the (local) sound speeds are then proportional to
 $( (\kappa _{ij})^{2/3} (\,{f_n^{ij}})^{1/3} / m_i )^{1/2}$ so to the 1/6th power of the normal forces
 ${f_n^{ij}}$, computed at the grain-motion time scale, i.e.
 $c \propto (f_n^{ij})^{1/6}$ (see discussions above and in Appendix A.1).
2.2.2. Vibration model
We now present the vibration model that describes the asymptotic limit of the ultrasound vibrations (perturbations) induced in a quasi-static (frozen) granular packing. The generalized position vector of a grain at equilibrium, denoted  $\boldsymbol {c} \in \mathbb {R}^{3N}$, is excited at a mono-frequency by an external vibration applied from the basal plane. More precisely, the grains in contact with the bottom are submitted to a sinusoidal motion, at a given frequency
 $f = {\omega }/{2 {\rm \pi}}$ and amplitude
 $U_0$.
At this vibration time scale, we seek for the vibrational (eigen) modes of the granular assembly, along the lines of Leibig (Reference Leibig1994) and Somfai et al. (Reference Somfai, Roux, Snoeijer, van Hecke and van Saarloos2005), and consider the asymptotic limit regime (i.e. steady harmonic vibrations) of the perturbed positions of all grains at the forced external vibration frequency  $f$. Accordingly, the solution to the wave equation (2.20)
 $\boldsymbol {e} \in \mathbb {R}^{3N}$ is separable, and can be written as
 $\boldsymbol {e}(t) = U_0 \exp (\textrm {i} \omega t) \boldsymbol {q},$ where
 $\boldsymbol {q} \in \mathbb {R}^{3N}$ is a constant vector that does not depend on time and is a solution for the vibration model – or the Helmoltz equation (Somfai et al. Reference Somfai, Roux, Snoeijer, van Hecke and van Saarloos2005; Couto Reference Couto2013). This equation writes
 \begin{equation} (\omega^2 \boldsymbol 1_{3N} + \boldsymbol{\varLambda}) \boldsymbol{q} = \boldsymbol{0} \in \mathbb{R}^{3N}, \end{equation}
associated to the Dirichlet kind of boundary condition
 \begin{equation} {q_i}_y = 1,\quad \forall\ i \in \mathcal{J}, \end{equation}
where  $\mathcal {J} \subset \mathbb {N}$ is the set of grain indexes in contact with the bottom,
 ${q_i}_y \in \mathbb {R}$ is the vertical component of the vector
 $\boldsymbol {q}$ and
 $\boldsymbol 1_{3N}$ is the
 $3N \times 3N$ identity matrix. Note that since the basal boundary condition is set only on the spheres vertical component, the particles belonging to
 $\mathcal {J}$ are free to move on the horizontal plane.
The square matrix  $\boldsymbol {\varLambda }$ is positive semi-definite and the vibrational (eigen) modes of the entire granular mass are directly given by its eigenvalues. Consequently, (2.22) is ill-posed when
 $\omega ^2$ is one of its eigenvalues, which may generate resonance effects. Nevertheless, except in these situations, one has the existence and the uniqueness of the solution given by
 $\boldsymbol {e}$. Figure 3 shows the histogram of the system normal (eigen) modes computed for a plane slope
 $\theta = 14^{\circ }$ and a layer height
 $H/d = 14.4$ at
 $t = 1.2\,\textrm {s}$ of simulated flow time – a typical set of parameters used for our simulations presented in § 3. In order to mimic the sound speed
 $c \simeq 10\,\textrm {m}\,\textrm {s}^{-1}$ (and associated effective contact stiffness) observed in the experiments mentioned above, we have adjusted empirically the contact coefficients
 $\kappa _{ij}$ (as a kind of fit parameter) in our simplified Hertz model (see Appendix A.1).
Histogram of the vibrational (i.e. eigen) modes of the quasi-static system considered at the vibration time scale, computed for a plane slope  $\theta = 14^{\circ }$, flow height
 $H/d = 14.4$ at
 $t = 1.2\,\textrm {s}$. There are about 32 000 modes presented in this figure.

Note that the anomalous density of vibrational modes in granular media has been observed in low-frequency ranges due to soft modes at unjamming transition (loses rigidity) (Wyart Reference Wyart2005; Xu et al. Reference Xu, Vitelli, Wyart, Liu and Nagel2009; Vitelli Reference Vitelli2010). However, the vibration model used here is too heuristic to account for the possible longitudinal and transversal mode conversion in the frictional packing (only the normal contact stiffness is considered). We seek to overcome this limit in the future and to more precisely infer the stress fields at a given instant (at the time scale of flow) from the DEM modelling.
2.3. Interparticle friction reduction through acoustic lubrication
Let us outline here the coupling between the grain-motion model COCD (see § 2.1) and the vibration model (2.22)–(2.23), and the role played by the acoustic lubrication given by the Mindlin model. More precisely, the purpose of the vibration model associated to the Mindlin model is to compute a new coefficient of friction for each contact, which embedded the vibrational perturbations into the dynamics that occurs at the grain-motion time scale. We consider that we are in the framework described in § 2.2.2, where a mono-frequency sinusoidal vibration is imposed on the basal grains of a pile. In the following, we consider a temporal discretization of the grain-motion model; refer to Martin et al. (Reference Martin, Mangeney, Lefebvre-Lepot, Maury and Maday2023a) for the full description of the numerical scheme that is used for computing a numerical solution to COCD.
The coupling algorithm that we present in this paper consists in running one iteration of the numerical scheme used to compute the solution of the grain-motion model with a typical time step  $\Delta t_g = 1\,\textrm {ms}$, providing the current generalized position vector
 $\boldsymbol {c} \in \mathbb {R}^{3N}$ and a set of the normal force intensities
 $f_n^{ij}$,
 $1 \leq i < j \leq N$. We then compute the solution
 $\boldsymbol {q} \in \mathbb {R}^{3N}$ to the vibration model. From the basal frequency
 $f$ and infinitesimal amplitudes
 $U_0$, the Mindlin model gives us new values of the interparticle friction coefficients
 $\mu _{ij}$ that are used in Coulomb's law of the next iteration of the grain-motion model; see (2.12)–(2.13). In the following, we describe more precisely the way the friction coefficients are modified.
When the vibration model is solved, the vector  $U_0 \boldsymbol {q} \in \mathbb {R}^{3N}$ corresponds to the ultrasound-induced perturbations applied on the generalized position vector
 $\boldsymbol {c} \in \mathbb {R}^{3N}$ at each contact for the basal amplitude
 $U_0$ and frequency
 $f$. From there, the normal (respectively tangential) infinitesimal displacements at contact are given by
 $U_0 \boldsymbol{\mathsf{N}}_{ij} \boldsymbol {q} \in \mathbb {R}^{3N}$ (respectively
 $U_0 \boldsymbol{\mathsf{P}}_{ij} \boldsymbol {q} \in \mathbb {R}^{3N}$ with
 $\boldsymbol{\mathsf{P}}_{ij}$ introduced in § 2.1). The question now arises of how to account for the infinitesimal perturbations of grains onto their macroscopic motion. The observations made in Leópoldès et al. (Reference Leópoldès, Jia, Tourin and Mangeney2020) show that the ultrasounds lead to modifying the static friction coefficient at the contact. That is why we choose to model the feedback of the acoustic waves on the grains motion through the modification of the interparticle friction coefficient
 $\mu _p$, which is involved only in the tangential contact law (
 $\mu _{ij}$ in Coulomb's law) at the grain-motion time scale. Without the vibrations, we consider, for the sake of simplicity, the same static friction coefficient for every contact. Note that having different values of
 $\mu _p$ does not change the method.
More precisely, the static friction coefficient  $\mu _s$ includes both the interparticle friction
 $\mu _p$ and the geometric trapping
 $\mu _g$ (dilatancy effect). Because of the small amplitude of ultrasound, we assume that the sound-matter interaction only modifies
 $\mu _p$ but not
 $\mu _g$; hence, the new vibration-induced static friction coefficient
 $\mu _s^\star$ results from the modification of
 $\mu _p^\star \neq \mu _p$, only. It means that due to ultrasound propagation, the static friction coefficient
 $\mu _{ij}$ changes depending on perturbation amplitudes between grains. We then denote the vibration-induced interparticle static friction coefficient
 $\mu _{ij}^\star$. From the Mindlin model (see Léopoldès, Conrad & Jia Reference Léopoldès, Conrad and Jia2013), we consider that the decreased rate of the interparticle friction coefficient
 $\Delta \mu _p^\star /\mu _p$ is approximately proportional to the ratio of the microscopic oscillating tangential force to the static normal force intensities times the coefficient of friction (this product being actually the bound of the tangential force
 $\boldsymbol {f}_t^{ij}$; see (2.12)–(2.13)), i.e.
 $\Delta \mu _p^\star /\mu _p \propto - \delta {{f}_t^{ij}}/(\mu _p {f_n^{ij}}),$ where
 $\delta {{f}_t^{ij}}$ is the microscopic oscillating tangential force intensities. Accordingly, we adopt here this scaling formula for the granular layer to describe the acoustic lubrication of the interparticle friction coefficient
 \begin{equation} \frac{\mu_{ij}^\star}{\mu_p} = 1 - C_\mu \frac{\delta {{f}_t^{ij}}}{\mu_p {f_n^{ij}}}, \end{equation}
where  $C_\mu \geq 0$.
The remaining task is then to compute an estimation of ultrasound-induced oscillating tangential force intensities  $\delta {{f}_t^{ij}}$. We approximate these intensities through a linear elastic law, meaning that they are computed thanks to the microscopic tangential grains displacements, i.e.
 $\delta {{f}_t^{ij}} = {k^{ij}_t} U^{ij}_t$, with
 ${k^{ij}_t}$ the shear contact stiffness and
 $U^{ij}_t$ the tangential displacement between the particles
 $i$ and
 $j$ given by
 $U^{ij}_t = U_0 \|\boldsymbol{\mathsf{P}}_{ij} \boldsymbol {q}\|$. Concerning the shear stiffness
 ${k^{ij}_t}$, we assume it verifies equation
 ${k^{ij}_t} / {k^{ij}_n} = 2/7$, which is a classical value used in DEMs (Lemrich et al. Reference Lemrich, Carmeliet, Johnson, Guyer and Jia2017). Finally, the normal stiffness
 ${k^{ij}_n}$ is given by the system elasticity embedded in matrix
 $\boldsymbol {\varLambda }$, i.e.
 ${k^{ij}_n} = ({3}/{2}) (\kappa _{ij})^{2/3} (\,{f_n^{ij}})^{1/3}$ (see § 2.2.1). We can deduce the final form of
 $\mu _{ij}^\star$ as being
 ${\mu _{ij}^\star } / {\mu _p} = 1 - ({3 U_0 (\kappa _{ij})^{2/3}})/({7\mu _p (\,{f_n^{ij}})^{2/3}}) {\|\boldsymbol{\mathsf{P}}_{ij} \boldsymbol {q}\|.}$ As a result, we then deduce a new set of interparticle friction coefficients that are provided to the grain-motion model before computing a new iteration (figure 4).
Illustration of the vibration-induced perturbations of the interparticle friction coefficients.

The Mindlin model provides a proportionality law linking the decrease in friction coefficients to the oscillating shear contact forces (see (2.24)). Under pure static normal loading,  $C_\mu = 1$, making the decrease proportional to the coefficient
 $\kappa _{ij}$ in Hertzian theory (see Appendix A.1). However, as pointed out in previous work (Leópoldès et al. Reference Leópoldès, Jia, Tourin and Mangeney2020), contact stiffness, governed solely by confining pressure (via Hertzian theory), is underestimated for disordered frictional grain packings. This is due to residual and heterogeneous stress fields caused by interlocking or frictional arching effects between grains and with boundary walls, which also affect the effective elastic modulus and wave velocity (Khidas & Jia Reference Khidas and Jia2010). To address such a discrepancy observed at the sample scale (i.e. mean-field approximation), we may empirically increase the contact stiffness by rescaling the coefficient
 $\kappa _{ij}$ – used as a fit parameter in our heuristic vibration model – by a factor of 100 (Leópoldès et al. Reference Leópoldès, Jia, Tourin and Mangeney2020). This adjustment results in a Mindlin equation value of
 $C_\mu = 100^{2/3}$ (an equivalent fit parameter). In a model that does not neglect the disturbances propagating through tangential forces, as is the case here (by hypothesis), the disturbances induced by the vibrations would be less underestimated and, consequently, the coefficient
 $C_\mu$ would likely be lower.
2.4. Computational time efficiency
At each time integration, the numerical scheme used to compute a numerical approximated solution to the grain-motion model requires solving a convex optimization problem. Additionally, the calculation of vibrational (eigen) modes and the modified friction coefficients are incorporated at each iteration. We utilize the Mosek APS (2010) solver to address the optimization problem – see details in Martin et al. (Reference Martin, Mangeney, Lefebvre-Lepot, Maury and Maday2023a) – and for computing vibrational modes. Consequently, MOSEK is called twice an iteration. Note that thanks to our two-time scale approach, we do not need to reduce the time step of the numerical method (i.e.  $\Delta t_g$) when integrating the influence of vibrations in our simulations. We maintain the same time step in cases with or without ultrasound. Computing the modes and new friction coefficients extends the total duration of each time integration. Table 1 provides some statistics on the computational times required for performing our simulations presented in § 3. In particular, we observe that the proportion of time spent on modes and coefficients calculation decreases as the number of grains
 $N$ increases (see the last column). For example, considering the vibrations increase the computation time of one iteration by 49 % for
 $N=8000$ grains, whereas it only increases by 26 % for 32 000 grains. This result is promising because it shows that our method of time-scale separation allows us to account for the rheological modification of the flow by ultrasound with a reasonable additional computation time, especially as the number of grains is large.
Statistics on computational time. Here  $H/d$ gives the normalized thickness of the granular layer,
 $N$ is the number of grains,
 $t_{int}^0$ and
 $t_{int}^{70}$ are the average computational times required to complete one time integration – a simulated time of
 $\Delta t_g$ – without (
 $\,f=0\,\textrm {kHz}$) and with vibrations (
 $\,f=70\,\textrm {kHz}$). The last column is the computational time (in percentage) spent for the calculation of vibrations and the reduction of the interparticle friction coefficients during one time integration. The MOSEK's tolerance parameter is set at the default value (
 $10^{-8}$, see details in Martin et al. (Reference Martin, Mangeney, Lefebvre-Lepot, Maury and Maday2023a)). The simulations were performed on one Intel
 $^{\circledR}$ Core
 $^\text {TM}$ i7-1065G7 CPU @
 $1.30\,\textrm {GHz} \times 8$.

3. Results
We now investigate the transition of the granular flow from the jammed solid state induced either by increasing shear or by basal ultrasound vibrations. The simulations presented in this section were all conducted in two dimensions, while we introduced the equations of the coupled model in three dimensions in § 2. Therefore, the two-dimensional static granular medium consists of layers of spherical grains (diameter  $d$) of various mean thicknesses (from
 $H = 3d$ to
 $14.4d$) put on an inclined plane at a slope
 $\theta$. The initial state is constructed by uniformly raining grains across the entire domain. Grains whose vertical position exceeds the required height are removed from the simulation. The plane is then abruptly inclined at
 $13^{\circ }$, and the state is allowed to relax so that no further grain rearrangements occur. We then begin the experiment by further inclining the plane. A layer of grains is stuck to the basal plane to form a rough bottom surface. These grains are thus tied to the movements of the plane, particularly its vertical vibrations. The grains interact with each other via a friction coefficient on the tangent plane at the contact point, a non-overlapping normal law and an inelastic collision law (the coefficient of restitution is zero; see § 2.1). The value of the friction coefficient employed in our simulations is
 $\mu _p = 0.25$ (see the last paragraph of § 2.1 for more details). Moving grains do not interact directly with the basal plane but do so in the same manner as with any other grain interacting with the grains glued to the basal plane. The lengths of the samples are much larger than the thicknesses with a free-stress boundary condition at both edges (figure 5). To observe the onset of grain motion, we focus on a specific observation domain, located at the middle of the full domain from 0.0 to 0.4 m (see the dashed rectangle in figure 5).

Granular assembly without basal vibrations ( $\,f=0\,\textrm {kHz}$) at
 $\theta = 16^{\circ }$ (a,b) and
 $17^{\circ }$ (c,d) for
 $H = 14.4d$. (a,c) A sequence of seven snapshots showing the evolution of a granular flow over time, ranging from
 $t=0$ to 1.2 s. The colour scale represents the magnitude of the grain velocity. The observation domain covers a distance of 0.4 m and corresponds to the dashed rectangle in figure 5. (b,d) Variation, over the same time period, of the normalized standard deviation
 $\sigma _l$ of the grains’ downslope velocity with respect to the average downslope velocity of the flow within two different layers decomposing the flow depth.

During a simulation, the slope of the basal plane is incrementally inclined (with a step  $\Delta \theta = 0.5^{\circ }$ between two consecutive slopes) for increasing shear. At each new slope, small amounts of grains may rearrange in the granular layer, increasing the kinetic energy
 $E_k$ of the system and the energy ratio
 $E_k / E_t$, with
 $E_t$ the total energy. The necessary condition to reach a new stable equilibrium (state) when the slope is increased from
 $\theta$ to
 $\theta + \Delta \theta$ is that this energy ratio satisfies the condition
 $E_k / E_t < \varepsilon _E$, during a simulated time of 0.1 s (equivalent to 100 iterations, since the grain-motion time step is
 $\Delta t_g = 1\,\textrm {ms}$). We used the value
 $\varepsilon _E = 3\times 10^{-8}$, which has been empirically determined during pretests. This delay of 0.1 s is chosen empirically and it does not preclude the possibility of new rearrangements occurring after 0.15 s. Nevertheless, it corresponds to 100 iterations at the grain-motion time step. In other words, the model calculates 100 iterations during which the kinetic energy is negligible compared with the total energy of the mass. Generally, this static period occurs after a phase in which grain rearrangements take place, sometimes lasting several tenths of a second in simulated time. When a portion of the mass detaches (and then
 $E_k / E_t \gg \varepsilon _E$), we check whether it is only a local rearrangement, e.g. as seen in figure 6(a) around
 $x=0.3\,\textrm {m}$ at
 $t=0.2\,\textrm {s}$ (which keeps moving slightly at 0.4 s but arrest flow at 0.6 s), or it leads to a generalized flow in space (figure 6c). In cases where the detachment (rearrangement) arrests on its own (i.e.
 $E_k / E_t < \varepsilon _E$ during 0.01 s), we continue the simulation by increasing the slope until there is a continuous flow. More specifically, in the case where grain motions triggered the ultrasound spread throughout the domain (
 $E_k / E_t$ remains greater than
 $\varepsilon _E$), we simulate the flow for about 1.2 s without changing the slope.
During the simulated time, the flow depth is considered to be split into two layers of equal depth (index 1 refers to the top surface layer and index 2 to the bottom layer). For each layer, we compute the normalized standard deviation  $\sigma _l$, with
 $l=1, 2$ of the grains’ velocity relative to the average velocity (figure 6b,d), i.e.
 \begin{equation} \sigma_l = \frac{1}{\overline{v_x}_l} \sqrt{\frac{1}{N_l} \sum_{i=1}^{N_l} ({v_i}_x - \overline{v_x}_l)^2}, \end{equation}
where  $N_l \in \mathbb {N}$ is the number of particles belonging to the layer
 $l$ in the observation domain (figure 5),
 ${v_i}_x$ is the downslope velocity component of disk
 $i$ and
 $\overline {v_x}_l$ is the mean downslope velocity of layer
 $l$, i.e.
 $\overline {v_x}_l = ({1}/{N_l}) \sum _{i=1}^{N_l} {v_i}_x$. If both
 $\sigma _l$ values converge to their limit such that these limits are below their associated given criterion
 $\varepsilon _{\sigma _l}$,
 $l = 1, 2$ (determined empirically), then the flow is considered as uniform (continuous flow) and we determine the angle as the avalanche angle and denote it by
 $\theta _{m}$ (see e.g. figure 6(d) at
 $t=0.8\,\textrm {s}$). We then assume the steady regime of inertial flow is reached when the two
 $\sigma _l$ values are roughly lower than 0.3 for the top layer (
 $\varepsilon _{\sigma _1} = 0.3$, vertical dashed line) and 0.9 for the bottom layer (
 $\varepsilon _{\sigma _2} = 0.9$, vertical plain line). Once the avalanche angle
 $\theta _{m}$ is reached, other simulations are conducted for increasing angles larger than
 $\theta _m$, up to
 $22^{\circ }$, starting each time from the final configuration of the largest angle where the layer remains static (i.e.
 $\theta _{m} - \Delta \theta$). The criteria for the quantities
 $\sigma _l$ are not universal and are determined empirically to be functional within our simulation framework. Nevertheless, they have the advantage of being relatively easy to compute and effectively discriminate here continuous flows from metastable ones.
The coupled model presented here takes into account the wave transmission through force chains generated by the basal vibration. It does not consider acoustic emissions resulting from interparticle collisions and rearrangements generated by the grain motion itself (Ferdowsi et al. Reference Ferdowsi, Griffa, Guyer, Johnson, Marone and Carmeliet2013; Johnson et al. Reference Johnson, Ferdowsi, Kaproth, Scuderi, Griffa, Carmeliet, Guyer, Le Bas, Trugman and Marone2013; Canel et al. Reference Canel, Jia, Campillo and Ionescu2024). However, our simulations reproduce well the experimental observations of acoustic triggering of granular instability such as avalanche or by the incoming coherent wave vibrations that capture the main mechanism of dynamic triggering via the acoustic fluidization (Melosh Reference Melosh1996; Johnson & Jia Reference Johnson and Jia2005). During the onset of flow driven by gravity (increasing the slope angle), grain motions are relatively slow (creep-like) and interparticle collisions are of low intensity (see § 4.2 for more discussions about non-local rheologies). Therefore, these resulting mechanical noises (acoustic emissions) of an incoherent nature (random and intermittent) and of low frequency (Nerone et al. Reference Nerone, Aguirre, Calvo, Bideau and Ippolito2003; Gibiat, Plazza & De Guibert Reference Gibiat, Plazza and De Guibert2008; Delannay, Duranteau & Tournat Reference Delannay, Duranteau and Tournat2015) are not expected to interfere constructively and create a dominant high-intensity pumping source.
We start by considering the case where the flow is solely induced by gravity-driven shear, i.e. by the inclination of the plane (§ 3.1), that is, without any vibration of the basal plane. Secondly, we present the effect of triggering and the dynamics generated by the dual effect of the slope inclination and basal vibration (§ 3.2).
3.1. Flow onset induced by gravity-driven shear: delay time to homogeneous flow
Figure 6(a–d) depicts grain motion in the zoomed regions for  $H = 14.4d$, at inclination angles close below (
 $16^{\circ }$) and equal to the avalanche angle
 $\theta _{m}$ (
 $17^{\circ }$). When the inertial flow is initiated, a delay time is clearly observed before all grains are in motion (downslope flow) initiated from the low edge (on the right) (figure 6a,c). Comparing the grains’ velocity norm at
 $\theta = 16^{\circ }$ and
 $17^{\circ }$ at
 $t = 1.2\,\textrm {s}$, we observe that the moving part of the domain (the low edge in figure 6(a) and the full domain in figure 6c) is intuitively 40 % slower at
 $16^{\circ }$ than at
 $17^{\circ }$. Additionally, figure 6(c) shows that in the first moments, the flow is initiated not only from the low edge but also in the middle of the domain; see e.g. the motion started by the collection of particles centred at
 $x=0.28\,\textrm {m}$ and 0.2 s and the motion initiated from the high edge (on the left) at 0.4 s (figure 6c). At 0.8 s, these two moving assembly of particles have merged (or percolated; see § 4.2), finally forming a continuous flowing mass. The normalized standard deviations
 $\sigma _l$ of the grain velocity at the top (blue) and the bottom (red) layers, respectively, are shown in figure 6(b,d). These simulations illustrate that the avalanche angle is well around
 $\theta _m = 17^{\circ }$. Indeed, at 0.8 s, the
 $\sigma _l$ values drop below the two criteria (figure 6d). Conversely, it is clear that at
 $16^{\circ }$ the normalized standard deviations
 $\sigma _l$ are far above the criteria for continuous flows (figure 6b).
Even when the whole flow reaches a high level of uniformity (both curves representing  $\sigma _l$ drop below the criteria), the flow uniformity in the top layer is larger than in the bottom layer, as the blue curve consistently remains below the red curve in figure 6(d). This behaviour is consistently observed in all our simulations whatever the layer thickness and is consistent with the laboratory experiments of Bachelet et al. (Reference Bachelet, Mangeney, Toussaint, de Rosny, Arran, Farin and Hibert2023), showing larger velocity fluctuations at the base of the flow.
Figure 7 highlights the avalanche angles for different thicknesses in the configuration where motion is solely generated by the inclination of the plane, i.e. without any basal vibrations. These angles represent the transition from a state where the granular mass is at rest (jammed solid state) to a continuous flow (for inclinations greater than the avalanche angle), sometimes passing from a metastable state where only a portion of the flow is slowly moving. In these simulations where flows are induced by gravity, metastable states correspond to a detachment of the front and the propagation of an erosion wave from the downstream to the upstream of the domain (see the example provided in figure 6a). They occur when the inclination angle is very close to that of the flow (within  $0.5^{\circ }$ or
 $1^{\circ }$). The boundary between the two limit states is depicted by the blue curve (and the dashed area) in a phase space composed, on the
 $x$ axis, of the inclination of the basal plane and, on the
 $y$ axis, of the average thickness of the granular mass in the initial state.
Phase space separating jammed and continuous regimes as a function of the avalanche angle  $\theta _m$ and the flow thickness ratio
 $H/d$. Each point represents the avalanche angle for the five thickness ratios
 $H/d = 3$, 6, 8.7, 11.4 and 14.4. The blue curves represent these avalanche angles without basal vibrations (
 $\,f = 0\,\textrm {kHz}$), contrary to the orange ones (
 $\,f = 70\,\textrm {kHz}$).

The shape of this blue curve (monotonic and decreasing) is similar to those reported in the literature (Daerr & Douady Reference Daerr and Douady1999; Pouliquen & Forterre Reference Pouliquen and Forterre2002; Mangeney et al. Reference Mangeney, Roche, Hungr, Mangold, Faccanoni and Lucas2010) showing that as the initial thickness increases, the avalanche angle decreases. The grey area represents the graph zone where the results strongly depend on the boundary conditions because the thickness of the granular layer is very thin (like  $H=3d$). Note that we do not study the effect of vibrations on the stopping angle
 $\theta _{{stop}}(H/d)$ in this paper since we focus on the initiation of the flow (unjamming transition) rather than on the arrest (jamming transition). Nevertheless, it has been shown both experimentally (Jaeger et al. Reference Jaeger, Liu and Nagel1989) and theoretically (Leópoldès et al. Reference Leópoldès, Jia, Tourin and Mangeney2020) that the angle of repose also decreases in the presence of vibrations. However, the difference between
 $\theta _{{stop}}$ and
 $\theta _{{start}}$ would also be reduced, i.e. with mitigating hysteresis, due to the acoustic lubrication effect. This phenomenon has been observed in similar stick-slip instability in granular media in the presence of vibration (Lastakowski, Géminard & Vidal Reference Lastakowski, Géminard and Vidal2015).
From angles greater than the avalanche angle  $\theta _m$, we measure the time
 $t_{con}$ it takes for
 $\sigma _l$ in the top and bottom layers to satisfy the criteria characterizing continuous flow. These times are represented in figure 8 for the three heights
 $H=6d$,
 $11.4d$ and
 $14.4d$. The times
 $t_{con}$ (without basal vibrations) represented by the blue curves are all decreasing. As expected, the larger the slope angle is, the shorter is the time required for the grains to reach a continuous flow.
Delay time of avalanche triggering by gravity or (and) ultrasound vibration as a function of the slope angle for different thickness ratios  $H/d= 6$, 11.4 and 14.4. The blue curves correspond to the measured times for flows without vibrations (
 $\,f = 0\,\textrm {kHz}$), in contrast to the orange curves (
 $\,f = 70\,\textrm {kHz}$). The stars indicate the maximum angles of stability corresponding to the avalanche angles
 $\theta _m$ (sometimes
 $\theta _{{start}}$ in the literature) measured for different thicknesses in figure 7, whereas the filled squares point to the inclined angles for which the flow has been initiated.

It is worth noting that the triggering duration decreases with the slope angle, but it seems to converge to a limit beyond a certain slope angle. This asymptotic behaviour is expected because, once the triggering angle is exceeded, the time  $t_{con}$ decreases as the angle increases, converging towards zero (or towards a value close to zero). This is reflected in figure 8 where the curves become almost horizontal for large angles. For example, for
 $H=14.4d$, if the flow becomes continuous 0.5 s earlier by increasing the slope angle from
 $17^{\circ }$ to
 $18^{\circ }$, it only becomes continuous 0.02 s earlier by increasing the slope angle from
 $21^{\circ }$ to
 $22^{\circ }$. Finally, one might have expected a clear relationship between the inclination angle
 $\theta$ and the time
 $t_{con}$ with the thickness of the granular layer
 $H$, but this is not what we observe here. In fact, while the thickness
 $H=6d$ has a slower triggering time than the other two at
 $20^{\circ }$, indicating that the thinner thickness is slower, this is not the case at
 $17^{\circ }$, where the triggering for the largest thickness
 $H=14.4d$ is faster than that for
 $11.4d$.
3.2. Flow onset induced by vibration: transition to continuous flows via percolation
In this section we investigate the triggering of granular flows in the presence of basal vibrations at a frequency of 70 kHz. As described before, this triggering is modelled by coupling the COCD model (§ 2.1) with the steady vibration model (§ 2.2.2), through the modification of interparticle friction coefficients  $\mu _p$, which are altered by the vibrations using the Mindlin model (§ 2.3). More specifically, we observe how this basal vibration affects the results obtained without basal vibrations. Note that the basal vibration frequency
 $f=70\,\textrm {kHz}$ is relatively high for a system with normal modes ranging from 1–75 kHz, as shown in figure 3. We discuss this choice in § 4.3.
Figure 9(a,b) presents the same types of results as figure 6(a,b), decomposed into simulation snapshots and curves representing the temporal evolution of the  $\sigma _l$ values in the top and bottom layers, still for a thickness of
 $H=14.4d$. The difference here is that the basal vibration is on. Thus, at
 $\theta = 16^{\circ }$, and contrary to the case without vibrations presented in figure 6(a,b), it is observed that a flow of the granular layer is triggered and converges towards a continuous flow after approximately
 $t=0.25\,\textrm {s}$ (figure 9a). There is therefore a notable difference since only a part of the layer was flowing after 1.2 s in the case without vibrations (figure 6a,b). As a result, the avalanche angle
 $\theta _m$ is clearly lower in the case of basal vibrations compared with the case without. Similarly to the
 $17^{\circ }$ angle without vibrations (figure 6c,d), the ‘top’ layer is more uniform than the ‘bottom’ layer, as indicated by the blue curve being significantly below the red curve (figure 9b). Unlike in the case without basal vibrations, we do not observe the initiation of flow occurring primarily at the front of the layer (low edge on the right in figure 6c). The mobilization of the granular layer is observed to be more uniform in the presence of vibrations. Another way to understand this is that the distinct triggering zones, which remain isolated for a considerable duration with vibrations off, percolate much faster with vibrations on (see § 4).
Granular assembly with basal vibrations ( $\,f=70\,\textrm {kHz}$) at
 $\theta = 16^{\circ }$ (a,b) and
 $13^{\circ }$ (c,d) for
 $H = 14.4d$. (a,c) A sequence of seven snapshots showing the evolution of a granular flow over time, ranging from
 $t=0$ to 1.2 s. The colour scale represents the magnitude of the grain velocity. The observation domain covers a distance of 0.4 m and corresponds to the dashed rectangle in figure 5. (b,d) Variation, over the same time period, of the normalized standard deviation
 $\sigma$ of the grains’ downslope velocity with respect to the average downslope velocity of the flow within two different layers decomposing the flow depth.

The decrease of avalanche angles due to vibration is observed in all simulations whatever the thickness and slope inclination, as shown in figure 7. Indeed, the orange curve, like the blue curve, is decreasing, but the important result here is that each of the avalanche angles in the orange curve (with vibrations) is lower than those in the blue curve by approximately  $2^{\circ }$. The only notable singularity is the avalanche angle for the thin thickness
 $H = 3d$, which is only
 $14.5^{\circ }$, which is
 $5.5^{\circ }$ smaller than in the case without basal vibrations. Such a difference can be explained by the dominance of boundary conditions as discussed in § 4.
Let us now investigate what happens at smaller angles, e.g. at  $13^{\circ }$ but still for the thickness
 $H = 14.4d$ (figure 9c,d). In the case of flows with vibrations, we no longer observe metastable states where an erosion wave propagates. However, we do observe regimes in which grains continually rearrange themselves without actually triggering a flow. The simulation presented in figure 9(c) is typical of these jammed states with rearrangement under vibrations. Indeed, we observe that rearrangements are active, even at
 $t = 1.2\,\textrm {s}$ (some areas are light blue on the surface after 1.2 s). However, these rearrangements remain local and are not sufficient to trigger a flow that would develop into a continuous flow. This is confirmed by the values of
 $\sigma _l$, which both remain well above the criteria characterizing a continuous flow (figure 9d).
When the avalanche angle is exceeded, the effect of basal vibrations is to decrease the triggering time, as shown in figure 8. Indeed, for the same layer thickness, the triggering times represented by the orange curves are consistently lower than the triggering times without vibrations, i.e. the blue curves in figure 8. For example, for a thickness of  $H = 6d$ and an angle
 $\theta = 19^{\circ }$, the triggering time decreases by approximately 74 % (from
 $t_{con} = 1.15\,\textrm {s}$ without vibrations to only 0.3 s with vibrations). Similarly to the case without vibrations, the triggering times appear to converge to a limit but for much smaller angles (for
 $H = 11.4d$ and
 $14.4d$, the triggering times with vibrations are roughly the same at
 $18^{\circ }$ as those at
 $22^{\circ }$ without vibrations). Note that, once again, there is no clear influence of thickness on the triggering time.
4. Discussion
4.1. Force chains, ultrasound-induced deformation and lubricated contacts
In the previous § 3.2 we quantified how much basal ultrasonic vibrations reduce the avalanche angle and triggering time. We focus here on the interparticle mechanisms responsible for these effects, namely, the vibration-induced lubrication that is accounted for in our simulation by weakening of interparticle friction coefficients, as described by the Mindlin model (§ 2.3).
Figure 10 shows the grain configuration, at two consecutive times in the simulation  $t = 0.051\,\textrm {s}$ and 0.052 s (the numerical time step is
 $\Delta t_g = 1\,\textrm {ms}$) for a slope angle
 $\theta =15^{\circ }$, a layer thickness
 $H = 14.4d$ and in a region between
 $x = 0.497$ and 0.505 m. The black lines in figure 10(a,d) represent the force chains formed between the grains (their width corresponds to normal force intensities
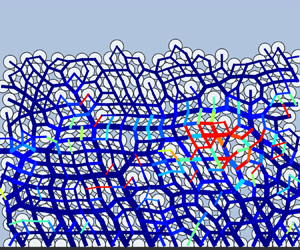
 ${f_n^{ij}}$; see § 2.1). The arrows shown in figure 10(b,e) represent the deformation fields computed with the steady vibration model (the vector
 $\boldsymbol {q} \in \mathbb {R}^{3N}$ solution to (2.22)–(2.23)). Note that the layer of grains in contact with the bottom has a unit displacement of 1, but for the sake of visibility of the deformation field, we did not use the same scale in figures 10(b,e), 12(b) and 13(b,e,h,k). The force chains are again depicted in figure 10(c,f) but on a logarithmic scale (which explains the different thicknesses compared with the linear scale in figure 10(a,d). The colours represent the rate of change of interparticle friction coefficients, i.e. the quantity
 $(\mu _p - \mu _{ij}^\star ) / \mu _p$ (see (2.24)). Where the force chains are blue, the coefficients are slightly modified, while where they are red, the coefficients are reduced to zero (thus, decreased by 100 %). In figure 10(b,e) the predominance of arrow orientation around the rupture zone (characterized by colours trending towards red in figure 10c,f) indicates the direction in which perturbations induced by vibrations propagate along the force chains. Figure 10 illustrates two destabilization mechanisms of the granular layer revealed by our simulations.
(a,d) Snapshots of the contact force chains, (b,e) vibration-induced displacements and (c,f) rate of vibration-induced perturbation of the interparticle friction, for  $\theta = 15^{\circ },\ H/d = 14.4,\ f = 70\,\textrm {kHz}$. In (a,d) the black lines represent the force chains formed between the grains on a linear scale (the coefficients
 ${f_n^{ij}}$ in § 2.2.2). In (b,e) the black arrows represent the computed vibration-induced displacement
 $\boldsymbol {q}$ in (2.22)–(2.23) (but not at the same scale). In (c,f) the lines between grains represent the force chains on a logarithmic scale, and the colour map represents the rate of decrease in the interparticle friction coefficients, i.e. the quantity
 $(\mu _p - \mu _{ij}^\star ) / \mu _p$ (see (2.24)). Snapshot times are
 $t = 0.051\,\textrm {s}$ (a–c) and
 $t = 0.052\,\textrm {s}$ (d–f).

The first mechanism, presented in figure 10(a–c), involves the transmission of deformation induced by basal vibrations in a preferential direction (in this case, horizontal around  $z=0.005\,\textrm {m}$ and between
 $x=0.496$ and 0.501 m) through a relatively dominant (strong) force chain in the corresponding region (thicker force chain in this particular region; see figure 10a). This transmission only slightly affects the interparticle friction coefficients along this force chain (the horizontal force chain appears as dark blue in figure 10c). On the contrary, the friction coefficients on contacts relatively perpendicular to this main force chain significantly changed (bright colours for vertical force chains surrounding the main force chain in figure 10c).
A second mechanism revealed by our simulations involves a kind of block destabilization. This mechanism is presented in figure 10(d–f). In this case, the destabilization does not follow a preferred direction but occurs in multiple directions (figure 10e), while remaining localized in a specific area of the granular layer (between  $z=0.002$ and 0.006 m and
 $x = 0.496$ and 0.501 m in figure 10d). A few strong-force chains are present in this area (figure 10d), but the friction coefficients are primarily modified on the less dominant (weak) force chains within the disturbed zone (figure 10f). Note that the different response of weak- and strong-force chains when getting close to instability was also observed in Deboeuf et al. (Reference Deboeuf, Dauchot, Staron, Mangeney and Vilotte2005).
In our simulations we have noticed that the first mechanism (destabilization along a preferred direction) can trigger the second mechanism, as seen here since the figures are taken at consecutive times. However, this is not always the case. Sometimes, only the first or the second mechanism occurs. We have not observed that the second mechanism can trigger the first mechanism.
4.2. Nucleation time (delay) to reach continuous flows
When the basal plane is inclined, localized rearrangement zones appear both with and without vibrations (figures 6a,c and 9a,c). Without vibrations, these zones can remain isolated for a significant period if the slope is not too steep (figure 6a). However, beyond the avalanche angle they can eventually merge (or ‘percolate’) and result in a relatively continuous flow (figure 6c). In simulations with vibrations, in addition to this triggering mechanism through inclination, there are also interparticle vibratory mechanisms that trigger specific zones within the granular layer (figure 10). The difference with vibrations is that the triggering zones are much more numerous and percolate much faster (figures 9a and 8), leading to a quick homogenization of the flow (figure 9b) and resulting in lower avalanche angles compared with cases without vibrations (figure 7). In our simulations, this phenomenon of percolation transition is faster and more uniform with vibrations on, and it increases with the slope, as shown in figure 11.
The percolation transition is accelerated with the presence of basal ultrasound vibrations when increasing the slope angle.

Several experimental (Nichol et al. Reference Nichol, Zanin, Bastien, Wandersman and van Hecke2010; Reddy, Forterre & Pouliquen Reference Reddy, Forterre and Pouliquen2011) and theoretical investigations (Kamrin & Koval Reference Kamrin and Koval2012; Bouzid et al. Reference Bouzid, Trulsson, Claudin, Clément and Andreotti2013) have revealed that the relation between applied stress and observed strain rate in one location depends on the strain rate in another location. These investigations suggest that the presence of a sheared region somewhere in a dense granular medium modifies the rheological properties of the sample everywhere (i.e. non-locality) as a function of distance and shear rate, etc, likely through the mechanical noise (passive) induced by the continuous flow itself. This scenario is indeed reminiscent of the acoustic triggering (active) of granular avalanches from the basal vibration.
4.3. Basal vibration frequency and amplitude
The ultrasound basal vibration has quite a high frequency ( $\,f=70\,\textrm {kHz}$) when compared with the system normal modes, which are mostly comprised between 5–45 kHz (figure 3). In our simulations, the disturbance is more effective when the frequency is well centred within the medium's spectrum and the results presented are qualitatively similar at a lower frequency. For example, the simulation we conducted with
 $f=30\,\textrm {kHz}$ shows a more significant and less localized disturbance of friction coefficients (figure 12). Figure 12 highlights that the fundamental disturbance was transmitted more effectively from the bottom of the medium to the grains in the upper layers, and this was achieved more efficiently than at the higher frequency of 70 kHz (figure 10).
(a) Snapshots of the contact force chains, (b) vibration-induced displacements and (c) rate of vibration-induced perturbation of the interparticle friction, for  $\theta = 15^{\circ },\ H/d = 14.4,\ f = 30\,\textrm {kHz}$, at
 $t = 0.072\,\textrm {s}$. (a) The black lines represent the force chains formed between the grains on a linear scale (the coefficients
 ${f_n^{ij}}$ in § 2.2.2). (b) The black arrows represent the computed vibrational displacement
 $\boldsymbol {q}$ in (2.22)–(2.23). (c) The lines between grains represent the force chains on a logarithmic scale, and the colour map represents the rate of decrease in the interparticle friction coefficients, i.e. the quantity
 $(\mu _p - \mu _p^\star ) / \mu _p$ (see (2.24)). The basal vibration amplitude is the same as in figure 10, about
 $U_0/d = 10^{-5}$.

Regarding the choice of the amplitude of the basal vibration  $U_0$, we used the same amplitude for all simulations,
 $U_0/d = 10^{-5}$, which is equivalent to a few tens of nanometres. Figure 13 illustrates the effects of the ultrasonic vibrations on the coefficients of friction for the same frequency,
 $f=70\,\textrm {kHz}$, but with amplitude
 $U_0$ ranging from
 $U_0/d=10^{-3}$ to
 $U_0/d=10^{-6}$. It can be observed that, even though the solution of the steady problem remains similar in terms of the distribution of perturbations (figure 13b,e,h,k), simulations conducted with larger amplitudes significantly alter the friction coefficients, obviously more than those with smaller amplitudes (figure 13c,f,i,l). Furthermore, the choice of amplitude made in this paper corresponds to an amplitude so small that the perturbations, although non-zero, remain small and generally localized (figure 13i).
(a,d,g,j) Snapshots of the contact force chains, (b,e,h,k) vibration-induced displacements (normalized by the basal amplitude) and (c,f,i,l) rate of vibration-induced perturbation of the interparticle friction, for  $\theta = 15^{\circ },\ H/d = 14.4,\ f = 70\,\textrm {kHz}$, and amplitudes
 $U_0/d = 10^{-n}$, for
 $n=3 \cdots 6$, at
 $t = 0.018\,\textrm {s}$.

By making these choices of frequency and amplitude of the ultrasound, we deliberately positioned the numerical simulations in an amplitude–frequency regime that makes disturbing the medium the most challenging, without inducing significant rearrangement of grain positions. The high-frequency domain is less explored than that of low-frequency vibrations, which are already well known for their significant triggering effects; see e.g. Hanotin et al. (Reference Hanotin, Kiesgen de Richter, Marchal, Michot and Baravian2012) and Lastakowski et al. (Reference Lastakowski, Géminard and Vidal2015). Decreasing (respectively increasing) the value of the basal vibration frequency (respectively amplitude) does not qualitatively alter the results presented in this paper. The coupling of numerical models we present in this paper is relevant in a frequency range from 5–80 kHz (figure 3) and with amplitudes ranging from  $10^{-6}d$ to
 $10^{-2}d$. We have not conducted studies beyond this range of parameters, but our model is likely to be less relevant in those cases since consideration of grain displacement at very low frequencies and/or large amplitudes may be necessary; see e.g. Bureau et al. (Reference Bureau, Baumberger and Caroli2001), Baumberger & Caroli (Reference Baumberger and Caroli2006) and Hanotin et al. (Reference Hanotin, Kiesgen de Richter, Marchal, Michot and Baravian2012).
4.4. Comparison with laboratory experiments: uniformity of granular flows
Finally, we investigate the uniformity of the granular flows, driven by gravity or triggered by ultrasound, and compare the simulations with the experiments realized under similar conditions. The objective of our comparison is to determine if the effects of vibrations are similar in our simulations and in the experiments, in terms of the uniformity of flow initiation. By examining the simulations and experiments at their respective avalanche angles (without vibrations) at  $t=0.15\,\textrm {s}$, we choose a sufficiently early time to observe this uniformity before percolation from various rupture points occurs (with or without waves). Note that the length of the domains in the experiments (6.5 cm) is much shorter than that of our simulations (a little over 80 cm). Therefore, we focus on comparing the experimental domain with the front of the simulation.
The experimental set-up is composed of a  $50 \times 65 \times 2.5\,\textrm {mm}$ PMMA plate, encircled by four 25 mm tall transparent PMMA walls, and the lower wall is removed once dry ceramic beads (of diameter
 $d = 425\unicode{x2013} 600\,\mathrm {\mu }$m) are poured into the box and the sample surface is flattened to get a constant thickness (about
 $z \simeq 8d$), so that the downstream edge of the sample is free. The plate surface (bottom) is made rough by gluing a layer of the same beads, and the box is fixed on the surface of an ultrasonic transducer with a diameter of 65 mm and nominal frequency of 28 kHz. The whole set-up can be tilted with a precision of
 $0.025^{\circ }$, and the grain motions are monitored by two cameras, from the top and through the transparent side wall (figure 14), respectively. Granular layers considered here are more than two times larger than the previous ones (Leópoldès et al. Reference Leópoldès, Jia, Tourin and Mangeney2020) in order to investigate the uniformity of flow. We actually monitor the motion of grains located on the upstream part of the sample (to avoid the boundary effect associated with the free downstream edge or erosion), as illustrated in figure 14 for
 $x$ from 0 to 25 mm (the sample has length
 $x = 65\,\textrm {mm}$ and width
 $y = 50\,\textrm {mm}$). The vibration amplitude of the ultrasonic transducer is about
 $0.1\,\mathrm {\mu }$m, a bit larger than those in our previous work, while the frequency is lower due to its larger diameter.
Experimental velocity fields of granular flows (side view) in a dry packing during the first 0.15 s interval: (a) driven by gravity at the avalanche angle  $\theta _m = 24^{\circ } \pm 1^{\circ }$. (b) Triggered by ultrasounds at
 $\theta = 22^{\circ }$. (c) Simulation snapshot at the front for
 $\theta _m = 17^{\circ }, H/d = 14.4,\ f = 0\,\textrm {kHz}$, at
 $t = 0.15\,\textrm {s}$. (d) Simulation triggered by ultrasounds (
 $\,f = 70\,\textrm {kHz}$). The total domain length for the experiments is 65 mm.

Figure 14(a) demonstrates how basal vibrations transition the triggering mechanism from being predominantly at the front of the granular layer to being uniformly distributed throughout the entire domain (figure 14b). Without vibrations, the velocities of grains represented by the red arrows are mostly large towards the front and small towards the back (figure 14a). Conversely, with vibrations on, the velocities are roughly the same magnitude across the entire domain (figure 14b).
In addition, in our simulations, the front systematically starts moving when the avalanche angle is exceeded (as illustrated in figure 14c, which shows the granular front, i.e. the right end of the mass in figure 5). Similarly, the experimental data also exhibit a configuration of a granular mass flowing near the front (figure 14a). In both experiments and simulations, we observe that vibration-triggered flows are more uniform (figure 14b,d) than the ones induced by gravity only (figure 14a,c).
We thus believe that the additional triggering mechanisms associated with basal vibrations, even if they are infinitesimal (ultrasounds in this paper and in the experiments), are sufficient to uniformly destabilize the granular layer and, consequently, lead to a more uniform destabilization, resulting in a reduction of the avalanche angle of the mass.
5. Conclusion
In summary, we have developed a two-time scale numerical simulation of wave-induced friction weakening in two-dimensional granular layers. Indeed ultrasound vibrations propagate with a time scale of the order of 10  ${\rm \mu} {\rm s}$ while grain motion occurs at a time scale of milliseconds. The triggering of granular flows is modelled by coupling the COCD model (§ 2.1) with the steady vibration model (§ 2.2.2), through the modification of interparticle friction coefficients
 $\mu _p$, which are altered by the vibrations using the Mindlin model (§ 2.3). This new two-time scale model has allowed us to investigate the nonlinear interaction between ultrasound and granular flows, in particular the vibration-induced reduction of the interparticle friction coefficient through the acoustic lubrication, without the contact opening and rearrangements of grain positions.
As expected, we find that ultrasound vibration is predominantly supported by the strong-force chains, but the vibration-induced decrease of friction occurs mainly in the weak-force chains perpendicular to the strong contact forces, causing eventually shear-transformation-zone-like regions at the mescoscopic scale. These local rearrangements nucleate to create a continuous flow through a percolation process with certain delay depending on the proximity to the failure, i.e. avalanche angles. The larger the vibration amplitude (or lower excitation frequency) is, the stronger the ultrasound-induced destabilization is. The difference in the behaviour of weak- and strong-force chains was also observed in the response of a granular packing (without vibration) during successive loading–unloading cycles close to the avalanche angle (Deboeuf et al. Reference Deboeuf, Dauchot, Staron, Mangeney and Vilotte2005).
Compared with gravity-driven flows, ultrasound-induced flows appear more spatially homogeneous. This is consistent with the effective temperature role played by sound vibration. The qualitative agreement between these simulations and experimental observations of granular flows triggered by ultrasound supports our numerical modelling. Although further improvement on the vibration model is still needed, this work helps to highlight underlying mechanisms of landslide and earthquake triggering by seismicity; see e.g. Durand et al. (Reference Durand2023).
Acknowledgements
We thank Mosek APS (2010) for the free academic license that made this paper possible. We thank J.-P. Vilotte for the enriching discussions related to this work.
Funding
This paper has been funded by the ERC contract no. ERC-CG-2013-PE10-617472 SLIDEQUAKES, supported by Horizon Europe MSCA Doctoral Network EnvSeis (no. 101073148) and by the European Union's Horizon 2020 research and innovation programme DT-Geo, grant agreement no. 101058129.
Declaration of interests
The authors report no conflict of interest.
Author contributions
H.A.M.: conceptualization, methodology, software, writing – original draft. A.M.: conceptualization, funding acquisition, methodology, project administration, supervision, writing – original draft. X.J.: conceptualization, methodology, experiment, supervision, writing – original draft. B.M.: conceptualization, methodology, supervision, writing – original draft. A.L.-L.: conceptualization, methodology, supervision, writing – original draft. Y.M.: conceptualization, funding acquisition, methodology, project administration, supervision, writing – original draft. P.D.: conceptualization, methodology, experiment.
Appendix. Wave equation
The purpose of this section is to present the derivation of the wave equation introduced by (2.20). We model the time evolution of an infinitesimal perturbation of a given configuration  $\boldsymbol {c}^0 \in \mathbb {R}^{3N}$ (the generalized position vector), supposed to be at rest. We first introduce a few elements of the Hertz theory in § A.1. In § A.2 we describe the way the resulting perturbation of the overlaps
 $\delta _{ij}$ is handled and its implication on the set of contact forces. Then, we show how this perturbation is related to the configuration itself in § A.3 and derive the wave equation in § A.4.
A.1. Embedding Hertz theory
In § 2.2.2 the normal force between two grains,  $i$ and
 $j$, is characterized, at the local scale, by a positive scalar
 ${f_n^{ij}} > 0$. The Hertz theory of contact provides a useful framework to model an elastic force at a contact between two particles. The general expression of the Hertz normal force between two grains is
 \begin{equation} F_n = \kappa_{ij} \delta_{ij}^{3/2}, \end{equation}
where  $\kappa _{ij}$ is a constant depending on the grains’ properties and
 $\delta _{ij}$ is the overlap between the particles
 $i$ and
 $j$, characterizing grain deformation.
Note the difference between the distances  ${D}_{ij}$, defined in (2.4), and
 $\delta _{ij}$: on the one hand, the distance
 ${D}_{ij}$ measures how far the grains are from each other, on the other hand, the overlap
 $\delta _{ij}$ models an overlap between the grains
 $i$ and
 $j$, which should be seen as quantifying a deformation of the bodies now considered as elastic. The two terms
 ${D}_{ij}$ and
 $\delta _{ij}$ evolve in an opposite way. When the distance
 ${D}_{ij}$ between
 $i$ and
 $j$ increases, their overlap
 $\delta _{ij}$ decreases. The scalars
 ${f_n^{ij}}$ can be provided by any model like COCD, as being the normal intensity of the contact force, while
 $F_n$ is the normal force intensity in the Hertz theory framework.
The prefactor can be found from the Hertz theory of elastic contact (see Johnson Reference Johnson1985 and Andreotti, Forterre & Pouliquen Reference Andreotti, Forterre and Pouliquen2013). In the case of a contact between two spheres  $i$ and
 $j$ of radii
 $r_i, r_j$, Young's moduli
 $E_i, E_j$ and Poisson's ratios
 $\nu _i, \nu _j$, we have
 $\kappa _{ij} = (4/3)E_{ij} \sqrt {r_{ij}}$, where
 $E_{ij}$ and
 $r_{ij}$ are defined by
 $1/{E_{ij}} = (1 - \nu _i^2)/{E_i} + (1 - \nu _j^2)/{E_j}$ and
 ${1}/{r_{ij}} = {1}/{r_i} + {1}/{r_j}.$ However, to compare qualitatively the sound speed or elastic modulus of granular layers measured in laboratory experiments (see discussions in § 2) with the present simplified Hertz (normal) contact model, we would need to upscale uniformly the coefficients
 $\kappa _{ij}$ by a factor of 100. This scaling does not qualitatively affect the results presented in this paper since the basal vibration frequency is chosen with respect to the system normal modes; see § 2.
A.2. First-order Taylor expansion of Hertz contact force
Let  $J_c$ be the set of contacts defined by
 $J_c = \{ (i, j) \,|\, 1 \leq i < j \leq N \ \textrm {and}\ \exists f_n^{0ij} > 0 \}$. We denote by
 ${N_c}$ the cardinal of set
 $J_c$. Let us assume that we have a generalized normal force intensity vector
 $\boldsymbol {f}^0 \in \mathbb {R}^{N_c}$, where
 $f_n^{0ij} > 0$, for any
 $(i,j) \in J_c$. We can define the overlap
 $\delta _{ij}^0$ by
 \begin{equation} \delta_{ij}^0 = \left(\frac{f_n^{0ij}}{\kappa_{ij}}\right)^{2/3}. \end{equation}
We assume that the quantities  $f_n^{0ij}$ and
 $\delta _{ij}^0$ remain constant at the vibration time scale and we study the effects of small perturbations around this equilibrium. We denote by
 $\varepsilon _{ij} \in \mathbb {R}$ the infinitesimal perturbation of
 $\delta _{ij}^0$ and the perturbation-induced overlap by
 ${\delta _{ij}} \in \mathbb {R}$, such that we have by definition
 \begin{equation} \delta_{ij} = \delta_{ij}^0 + \varepsilon_{ij}. \end{equation}
Only  $\delta _{ij}$ and
 $\varepsilon _{ij}$ depend on time while
 $\delta _{ij}^0$ remains constant. Consequently, when considering the perturbation-induced overlap
 $\delta _{ij}$, a Taylor expansion at the first order of (A2) provides the value of a perturbation-induced normal force intensity, denoted by
 ${f_n^{ij}} \in \mathbb {R}$. This can be formalized by
 \begin{align} {f_n^{ij}} &= \kappa_{ij} ({\delta_{ij}})^{3/2} \nonumber\\ &= \kappa_{ij} (\delta_{ij}^0 + \varepsilon_{ij})^{3/2} \nonumber\\ &= \kappa_{ij} (\delta_{ij}^0)^{3/2} + \frac{3}{2} \kappa_{ij} (\delta_{ij}^0)^{1/2} \varepsilon_{ij} + o \left(\frac{\varepsilon_{ij}}{\delta_{ij}^0}\right) \nonumber\\ &\simeq f_n^{0ij} + \underbrace{\frac{3}{2} \kappa_{ij} (\delta_{ij}^0)^{1/2} \varepsilon_{ij}}_{= f_{n}^{\varepsilon ij}}, \end{align}
where the term  $f_{n}^{\varepsilon ij}$ is the infinitesimal perturbation of
 $f_n^{0\,ij}$ that, for the perturbation-induced force
 ${f_n^{ij}}$, performs the role played by the term
 $\varepsilon _{ij}$ for
 ${\delta _{ij}}$ in (A3).
A.3. Perturbation-induced position vector
We now consider a generalized position vector of the mechanical system at the equilibrium that we denote  $\boldsymbol {c}^0 \in \mathbb {R}^{3N}$; see § 2.1. In the previous section, the perturbation-induced force
 ${f_n^{ij}}$ can be expressed as a linear function of the infinitesimal perturbation
 $\varepsilon _{ij}$ of the overlap
 $\delta _{ij}^0$ (see (A3)). Similarly, we define the perturbation-induced position vector
 $\boldsymbol {c}$ and
 $\boldsymbol {e}$, the infinitesimal perturbation of the constant position vector
 $\boldsymbol {c}^0$, all belonging to
 $\mathbb {R}^{3N}$, i.e.
 \begin{equation} {\boldsymbol{c} = \boldsymbol{c}^0 + \boldsymbol{e},} \end{equation}
where, at the vibration time scale,  $\boldsymbol {c}$ and
 $\boldsymbol {e}$ depend on time while
 $\boldsymbol {c}^0$ remains constant. We can write
 $\varepsilon _{ij}$, the infinitesimal perturbation of the overlap
 $\delta _{ij}^0$, as the image of
 $\boldsymbol {e}$ by the map
 $\boldsymbol{\mathsf{N}}_{ij}$; indeed, we have
 \begin{equation} \varepsilon_{ij} = (\delta_{ij} - \delta_{ij}^0) ={-} ((\boldsymbol{c}_i - \boldsymbol{c}_j) - (\boldsymbol{c}^0_i - \boldsymbol{c}^0_j )) \boldsymbol{\cdot} \boldsymbol{n}_{ij} ={-} (\boldsymbol{e}_{i}-\boldsymbol{e}_{j})\boldsymbol{\cdot} {\boldsymbol{n}_{ij}} ={-} \boldsymbol{\mathsf{N}}_{ij} \boldsymbol{e}. \end{equation}
We define also the perturbation-induced generalized force intensity vector  $\boldsymbol {f} \in \mathbb {R}^{N_c}$, resulting from the perturbation of the constant vector
 $\boldsymbol {f}^0 \in \mathbb {R}^{N_c}$ by the infinitesimal perturbation vector
 $\boldsymbol {f}^\varepsilon \in \mathbb {R}^{N_c}$, i.e.
 \begin{equation} \boldsymbol{f} = \boldsymbol{f}^0 + \boldsymbol{f}^\varepsilon. \end{equation}
Equations (A2), (A4) and (A6) give  $f_{n}^{\varepsilon ij} = - {3}/{2} (\kappa _{ij})^{2/3} (f_n^{0 ij})^{1/3} \boldsymbol{\mathsf{N}}_{ij} \boldsymbol {e},$ which can be written under its vector form as
 \begin{equation} \boldsymbol{f}^\varepsilon ={-}\boldsymbol{\mathsf{K}} \boldsymbol{\mathsf{N}} \boldsymbol{e} \in \mathbb{R}^{N_c}, \end{equation}
where the diagonal square matrix  $\boldsymbol{\mathsf{K}}$ contains the elastic properties of the system:
 \begin{align} \boldsymbol{\mathsf{K}} &= \tfrac{3}{2} \mathrm{diag} ((\kappa_{1,2})^{2/3} (\,{f_n^{01,2}})^{1/3}, \ldots, (\kappa_{ij})^{2/3} (\,{f_n^{0\,ij}})^{1/3}, \nonumber\\ &\quad \ldots, (\kappa_{N -1, N})^{2/3} (\,{f_n^{0N - 1,N }})^{1/3})\in \mathbb{R}^{{N_c} \times {N_c}}. \end{align}
A.4. Wave equation
The assumption is made on the system described in § 2.1 to be at rest, maintained by the gravity field. In this configuration, Newton's second law imposes that there exists a generalized reaction force vector that is necessary opposed to the global force vector  $\boldsymbol {w}^0 = (\boldsymbol {w}^0_1, \ldots, \boldsymbol {w}^0_N) \in \mathbb {R}^{3N}$, applied on the system. Coupled with the non-overlapping condition
 ${D}_{ij} \geq 0$, it is equivalent to saying that the inverse image of the vector
 $-\boldsymbol {w}^0$ by the map
 $\boldsymbol{\mathsf{N}}^\textrm {T}$ (see § 2.2.1), intersected with
 $\mathbb {R}^{N_c}_+$ (to have repulsive force only) is not empty, i.e.
 ${\boldsymbol{\mathsf{N}}^\textrm {T}}^{-1}(-\boldsymbol {w}^0) \cap \mathbb {R}^{N_c}_+ \neq \varnothing$. For the generalized normal force intensity vector
 $\boldsymbol {f}^0 \in \mathbb {R}^{{N_c}}_+$, belonging to the inverse image of the vector
 $-\boldsymbol {w}^0$ by the map
 $\boldsymbol{\mathsf{N}}^\textrm {T}$, we have
 \begin{equation} \boldsymbol{\mathsf{N}}^{\rm T} \boldsymbol{f}^0 ={-}\boldsymbol{w}^0 \in \mathbb{R}^{2N}, \end{equation}
whose local expression is exactly given by (2.17). The generalized force vector  $\boldsymbol{\mathsf{N}}^\textrm {T} \boldsymbol {f}^0$ generates local normal repulsive forces between the spheres at the contact points. Furthermore, the generated pressures create deformation zones and the Hertz theory enables us to characterize these deformations by a set of scalars
 $\delta _{ij}^0 \in \mathbb {R}$ (see (A1)). Consequently, the
 $\delta _{ij}^0$ can be given by an equation of type (A2). As a result, we have shown how the forces computed at the grain-motion time scale by the grain-motion model COCD, which does not involve the Hertz theory, can be linked to the Hertz law at the vibration time scale, through the introduction of the overlaps
 $\delta _{ij}^0$.
With the generalized mass matrix (masses only) defined by (2.19), and by considering the perturbation-induced generalized force vector  $\boldsymbol{\mathsf{N}}^\textrm {T} {\boldsymbol {f}} \in \mathbb {R}^{3N}$ and applying Newton's second law, we finally obtain the unsteady wave equation resulting from the perturbation of
 $\boldsymbol {c}^0$ by
 $\boldsymbol {e}$. Indeed, we have
 \begin{equation} \left.\begin{gathered} \bar{\boldsymbol{\mathsf{M}}} \frac{\mathrm{d}^2 \boldsymbol{c}}{{\mathrm{d} t}^2} = \boldsymbol{\mathsf{N}}^{\rm T} {\boldsymbol{f}} + \boldsymbol{w}^0 \iff \bar{\boldsymbol{\mathsf{M}}} \frac{\mathrm{d}^2 \boldsymbol{e}}{{\mathrm{d} t}^2} = \boldsymbol{\mathsf{N}}^{\rm T} (\boldsymbol{f}^0 + \boldsymbol{f}^\varepsilon ) + \boldsymbol{w}^0, \\ \bar{\boldsymbol{\mathsf{M}}} \frac{\mathrm{d}^2 \boldsymbol{e}}{{\mathrm{d} t}^2} ={-} \boldsymbol{\mathsf{N}}^{\rm T} \boldsymbol{\mathsf{K}} \boldsymbol{\mathsf{N}} \boldsymbol{e}. \end{gathered}\right\} \end{equation}
At the end, a wave equation is defined for any  $\boldsymbol {e} \in \mathbb {R}^{3N}$,
 \begin{equation} {\bar{\boldsymbol{\mathsf{M}}} \frac{\mathrm{d}^2 \boldsymbol{e}}{{\mathrm{d} t}^2} + \boldsymbol{\varLambda} \boldsymbol{e} = 0}, \end{equation}
where the linear map defined by the matrix
 \begin{equation} \boldsymbol{\varLambda} = \boldsymbol{\mathsf{N}}^{\rm T} \boldsymbol{\mathsf{K}} \boldsymbol{\mathsf{N}} \in \mathbb{R}^{3N \times 3N} \end{equation}
can be seen as a kind of discrete Laplace operator.



