INTRODUCTION
For nearly a century, psychologists have interpreted cognitive test performance by comparing a person’s score to those of healthy age peers (WMS-R; Binet & Simon, Reference Binet, Simon and Kite1916; Stern & Whipple, Reference Stern and Whipple1914; Terman & Terman, Reference Terman and Terman1916). Modern neuropsychologists have expanded this approach by adding other variables, such as sex or years of education, to their stratification of normative data. This conventional (or group) approach ranks a person’s raw test score against a demographically similar sample.
An alternative normative approach involves demographically predicting a person’s test score using multiple regression analysis (MRA). Equations derived from MRA are used to predict test performance based on one’s unique demographic characteristics, thus making the normative conversions highly individualized (Crawford & Howell, Reference Crawford and Howell1998; Harnett, Godfrey, & Knight, Reference Harnett, Godfrey and Knight2004; Heaton, Miller, Taylor, Grant, Reference Heaton, Miller, Taylor and Grant2004; Zachary & Gorsuch, Reference Zachary and Gorsuch1985). Then, the discrepancy between a person’s predicted and actual scores is evaluated against the distribution of such discrepancy scores shown by a normative sample. Thus, an abnormal discrepancy is one that exceeds a specified cutoff (Crawford & Garthwaite, Reference Crawford and Garthwaite2002, Reference Crawford and Garthwaite2006; Schretlen et al., Reference Schretlen, Testa, Winicki, Pearlson and Gordon2008). Because the discrepancy score provides the crucial normative information in regression-based norms (RBNs), the equations used to generate the expected test scores must be accurate (i.e., they should account for the maximum possible variance in test performance).
The conventional approach of stratifying normative participants into demographic subgroups has psychometric limitations that the RBN method avoids (Zachary & Gorsuch, Reference Zachary and Gorsuch1985). First, the group approach requires a large normative sample to ensure adequate reliability. If 20–30 participants per stratification band are desired, then 200 to 300 participants are needed to represent just 5 age and 2 education bands. Further stratification by sex doubles the sample size needed to maintain the same number of participants per cell. Sample size criteria are more forgiving for the RBN approach as they depend primarily on the requirements of MRA. In the latter, 15–20 participants per independent variable are needed to derive reliable equations (Stevens, Reference Stevens2002). Thus, even if one uses a conservative participant-to-variable ratio, such as 30 participants per variable, a normative sample of 240 representative participants would suffice to derive stable RBN equations that include up to eight predictor variables under the usual assumptions of MRA. This allows for highly individualized predictions, although stringent statistical assumptions must be met to ensure that the derived equations are stable and reliable. Second, when appropriate (based on theory or examination of graphical displays), MRA also enables one to account for nonlinear and interaction effects of demographic variables on cognitive performance. The conventional group comparison method cannot do this easily because normative sample participants are assigned to—often arbitrary—demographic subgroups.
Appropriate norms are needed to improve the sensitivity and specificity with which tests identify cognitive impairment among individuals who are highly intelligent (Drebing, Van Gorp, Stuck et al., Reference Drebing, Van Gorp, Stuck, Mitrushina and Beck1994; Rentz, Sardinha, Huh et al., Reference Rentz, Huh, Faust, Budson, Scinto and Sperling2004; Rentz et al., Reference Rentz, Huh, Sardinha, Moran, Becker and Daffner2007; Steinberg & Bieliauskas, Reference Steinberg and Bieliauskas2005; Steinberg, Bieliauskas, Smith, & Ivnik, Reference Steinberg, Bieliauskas, Smith and Ivnik2005). The same is true of persons for whom years of education does not accurately reflect educational quality (Manly, Jacobs, Touradji et al., Reference Manly, Jacobs, Touradji, Small and Stern2002). Measures of oral word reading correlate positively with academic achievement (Wilkinson, Reference Wilkinson1993) and intelligence (Blair & Spreen, Reference Blair and Spreen1989; Schretlen, Winicki, Meyer et al., Reference Schretlen, Winicki, Meyer, Testa, Pearlson and Gordon2009). Moreover, they are relatively resistant to the effects of acquired brain dysfunction (Bright, Jaldow, & Kopelman, Reference Bright, Jaldow and Kopelman2002; Graves, Carswell, & Snow, Reference Graves, Carswell and Snow1999; Johnstone, Callahan, Kapila, & Bouman, Reference Johnstone, Callahan, Kapila and Bouman1996). Because oral word reading also correlates with performance on many other neurocognitive tests (Schretlen, Buffington, Meyer, & Pearlson, Reference Schretlen, Buffington, Meyer and Pearlson2005), and one goal of the RBN approach is to predict expected performance accurately, adding oral word reading as a predictor variable is logical. However, estimates of “premorbid” IQ based on oral word reading (or any other method) have been included in very few RBN systems (Harnett et al., Reference Harnett, Godfrey and Knight2004; Knight, McMahon, Green, & Skeaff, Reference Knight, McMahon, Green and Skeaff2006), and it is unclear whether a measure of reading ability can account for incremental variance among an array of cognitive measures.
The first goal of this study is to determine whether performance on a test of oral word reading accounts for significant variability in the tests that comprise a neuropsychological assessment battery. A related aim is to determine whether the same word reading test accounts for incremental variability in cognitive performance, beyond that explained by demographic predictors. We hypothesize that word reading will account for significant incremental variance in performance on most measures included in a moderately large, multi-domain cognitive battery. Support for this hypothesis would indicate that estimated premorbid IQ, when used as a predictor in the RBN approach, improves the benchmarking of test performance.
Despite their increasingly widespread use over the past 10–15 years, no detailed step-by-step description of the procedures used to derive RBNs has been published, although general descriptions are available (Crawford & Howell, Reference Crawford and Howell1998; Harnett et al., Reference Harnett, Godfrey and Knight2004; Heaton, Grant, & Matthews, Reference Heaton, Grant and Matthews1991; Heaton et al., Reference Heaton, Miller, Taylor and Grant2004; Knight et al., Reference Knight, McMahon, Green and Skeaff2006; Van Der Elst, Van Boxtel, Van Breukelen, & Jolles, Reference Van Der Elst, Van Boxtel, Van Breukelen and Jolles2006). The mathematical computations required to derive RBNs are not complex, but the final T score distributions differ from raw and traditionally derived percentile scores in fundamental ways. These differences are more difficult to grasp. Thus, we also provide a full exposition of our RBN procedures, and discuss the assumptions and limitations they entail. We thereby aim to foster professional discourse about the advantages and disadvantages of RBNs that is informed by a common understanding of the methods.
METHOD
Participants
During Phase 1 of the Johns Hopkins Aging, Brain Imaging, and Cognition (ABC) study, 215 adults were recruited primarily through random-digit dialing from households in the Baltimore, Maryland metropolitan area. Another 179 were recruited from the Baltimore, Maryland and Hartford, Connecticut metropolitan areas during Phase 2 of the same study. Each participant underwent physical and neurological examinations, psychiatric interview, laboratory blood tests, brain MRI scan, and cognitive testing. For the analyses reported here, we excluded 67 (17%) participants with Parkinson or Alzheimer disease, intellectual disability, multiple sclerosis, epilepsy, history of stroke or traumatic brain injury with >1 hr loss of consciousness, a life-threatening illness or combination of conditions that was life-threatening (e.g., uncontrolled hypertension with coronary artery disease and prior myocardial infarction), major depression, bipolar disorder, schizophrenia, or substance dependence (a remote history of depression or substance use disorder was allowed). The remaining 327 reasonably healthy (NC) participants ranged from 18 years to 92 years of age (M = 54.8; SD = 18.8). They included more women (57%) than men (43%) and more Caucasians (80.1%) than African Americans (18.0%) and persons of “other” racial/ethnic background (1.9%). The participants completed from 3 years to 20 years of schooling (M = 14.2; SD = 3.0), and produced a mean Mini-Mental State Examination (MMSE; Folstein, Folstein, & McHugh, Reference Folstein, Folstein and McHugh1975) score of 28.1 (SD = 1.7).
Procedure
After giving written informed consent to participate in this study, which was approved by the Johns Hopkins University and Hartford Hospital IRBs, each participant provided a health history and underwent physical and neurological examinations, a structured psychiatric interview (Wing Sartorius, & Ustun, Reference Wing, Sartorius and Ustun1996), brain magnetic resonance imaging, and neuropsychological testing. The assessment required 6 hours to complete, and each person received a stipend for participating. Phase 2 of the ABC study includes cross-sectional and longitudinal components, but only cross-sectional data were used for these analyses.
Neuropsychological Assessment
Each participant was administered a battery of 17 tests from which 24 measures were derived. General cognitive screening included total scores from the MMSE and IQ scores based on a seven-subtest (Axelrod, Ryan, & Ward, Reference Axelrod, Ryan and Ward2001; Ward, Reference Ward1990) form of the Wechsler Adult Intelligence Scale, Revised (WAIS-R; Wechsler, Reference Wechsler1981) or Wechsler Adult Intelligence Scale, 3rd Ed. (WAIS-III; Wechsler, Reference Wechsler1997). The WAIS-R was administered to 245 participants and the WAIS-III to 82. All participants received the Information, Digit Span, Arithmetic, Similarities, Picture Completion, Block Design, and Digit Symbol subtests. Details of the regression analyses for the WAIS-R and WAIS-III FSIQ are described below. All participants received the Hopkins Adult Reading Test (HART; Schretlen et al., Reference Schretlen, Winicki, Meyer, Testa, Pearlson and Gordon2009) to estimate “premorbid IQ.” For the current analyses, we used the sum of items correct from Form B of the HART as our estimate of “premorbid IQ.” For the additional measures, we computed mean times to complete two trials of the Grooved Pegboard Test (GPB; Kløve, Reference Kløve and Forster1963) with each hand, the times required to complete Parts A and B of the Trail Making Test (TMT; Reitan, Reference Reitan1958), and total items correct on the Brief Test of Attention (BTA; Schretlen, Reference Schretlen1997). We computed total deviation scores for the Cognitive Estimation Test (CET; Axelrod & Millis, Reference Axelrod and Millis1994) and the number of category sorts completed and perseverative errors committed on Nelson’s (Reference Nelson1976) modified Wisconsin Card Sorting Test (mWCST). Language screening included a 30-item version of the Boston Naming Test (BNT-30; Goodglass & Kaplan, Reference Goodglass and Kaplan1983) for which we used the total number of spontaneously named pictures. We also administered two tests of Verbal Fluency, wherein we summed the total numbers of acceptable words beginning with the letters S and P (Letter Fluency) and animal names and supermarket items (Semantic Fluency) during consecutive 1-min trials. We recorded the total number of acceptable drawings produced in 4 minutes for the Design Fluency Test (Kingery, Schretlen, Sateri, Langley, Marano, & Meyer, Reference Knight, McMahon, Green and Skeaff2006), the number of correctly identified faces on the Facial Recognition Test (Benton, Sivan, deS Hamsher, Varney, & Spreen, Reference Benton, Sivan, deS Hamsher, Varney and Spreen1994), and copy accuracy scores (Meyers & Meyers, Reference Meyers and Meyers1995) for the Rey-Osterrieth Complex Figure Test (Rey & Osterrieth, Reference Rey and Osterrieth1993). We recorded measures of total learning over trials and delayed free recall on the revised Hopkins Verbal Learning Test–Revised (HVLT-R; Brandt & Benedict, Reference Brandt and Benedict2001) and Brief Visuospatial Memory Test–Revised (BVMT-R; Benedict, Reference Benedict1997). Finally, we recorded measures of immediate and delayed recall for the Wechsler Memory Scale–Revised (WMS-R; Wechsler, Reference Wechsler1987) Logical Memory and Visual Reproduction subtests.
Data Analysis
Rationale and overview of methods
MRA is used to predict the value of a dependent variable based on its relationship to the predictor variables. The RBN approach uses MRA to predict cognitive test scores (the dependent variable) using various demographic (predictor) variables in neurologically healthy persons. MRA yields equations that can be applied to other persons to predict their test performance. The accuracy of any MRA equation relates to the strength of the relationship between the predictor and dependent variables. For RBNs, the strength of this relationship depends on the amount of variability in test performance that the predictor variables explain. However, the RBN approach also capitalizes on residual variance—the variability in test scores that is not predicted by (related to) demographic variables.
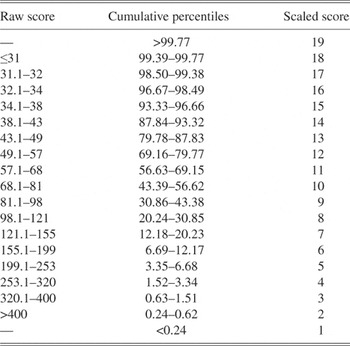
Residual variance represents the mathematical differences between the equation-predicted and actual test scores of the entire normative sample for a given measure (e.g., MMSE total score). In a normative sample, residual values will vary from person to person. For any measure, the distribution of residuals produced by persons in a normative sample can be used to estimate the likelihood of any given discrepancy score produced by someone who is not in the normative sample. For example, to apply these methods to a patient, his or her raw test scores are first converted to scaled scores using the raw score-to-scaled score conversions defined by the NC distributions (as depicted in Table 1). Then, MRA equations derived from the NC sample are used to compute demographically predicted values for the patient. Next, these predicted values are subtracted from the patient’s actual scaled scores. The resulting discrepancy scores are compared with the distribution of residuals derived from the normative sample. The crucial normative information is obtained by dividing the patient’s discrepancy score by the standard deviation of the of the NC group’s residuals (i.e., the standard error of the estimate; SEE). Technically, the discrepancy score should be divided by the standard error for a new case. However, for a normative sample with n > 100, the Type I error rate does not differ from that associated with the method described here (Crawford & Garthwaite, Reference Crawford and Garthwaite2006). The resulting quotient is a z score. Thus, if a discrepancy value is −2.3 points (i.e., the person’s actual test score is 2.3 points lower than predicted by the RBN equation), and the standard error of the estimate for a particular measure is 3.0, the resulting z is −2.3/3.0 = −0.77. The probability of obtaining a discrepancy this low or lower (i.e., ≤ −0.77) is 0.22. In most RBN systems, the resulting z scores are converted to T scores. Thus, a z of −0.77 is equal to a T score of approximately 42 (21st percentile).
Trail Making Test, Part B (TMT B) Raw Score-to-Scaled Score Equivalent Conversions Based on the Cumulative Frequency Distribution of the Normative Sample

The use of MRA dictates that stringent statistical assumptions be met. Following Cohen, Cohen, West, and Aiken (Reference Cohen, Cohen, West and Aiken2003), we tested for multicollinearity among predictor variables and the absence of excessive influence by outlier cases. In addition, we inspected the distributions of residuals for normality by analyzing q-q plots. Finally, for each measure, we investigated whether variance of the residuals was constant (homoscedasticity) by subgrouping NC participants into tertiles of predicted scores and examining the significance of the Levene test to the residuals. For RBNs, the presence of heteroscedasticity will lead to inaccurate diagnostic classifications, especially if a wide SEE is used in determining the significance of a discrepancy score for an individual whose predicted score is associated with a narrow SEE.
Application of the methods with two case examples
To develop equations for ABC study data, we first converted the NC group’s raw scores on all 24 cognitive measures to scaled scores (M = 10; SD = 3) using the cumulative frequency distribution of each measure.Footnote 1 Then, using MRA we regressed these scaled scores on specified predictor variables to derive our equations. We conducted one series of analyses to determine how much variance in test performance can be explained by the HART-B alone, without any other predictors (Model 1). Only the sum and sum-squared of correct responses on the HART-B served as predictors for these analyses. We also conducted another set of analyses to determine how much incremental variance is explained by HART-B. Using a hierarchical design, we entered terms for age and age-squared, sex (1 = Male, 2 = Female), race (1 = Non-Black, 2 = Black), years of education and years of education-squared in the first block followed by terms for the sum and sum-squared of correct responses on the HART-B in the second block (Model 2). Nonlinear terms were included for age, education, and HART-B to account for maximal variance associated with these variables. Equations and SEE values were derived from the second set of regression analyses. For the WAIS-R/WAIS-III regression equations, we added a term for the WAIS form (which accounted for 2% of the variance), along with the other predictors. In this way, we developed a single regression equation based on all of the available data for each WAIS measure.
Before presenting the results of the main hypotheses, we will use NC scores on Trail Making Test Part B (TMT B) to illustrate our RBN procedures and their effects in 2 cases. We present their transformed scores on a selection of other test measures. Case A is a 53-year-old Caucasian man with 18 years of schooling, a pro-rated WAIS-R IQ of 88, a HART-B estimated IQ of 117 (23 correct), and a TMT B completion time of 103 s. Although he was recruited to participate in the ABC study, his data were excluded due to his multiple health problems, which included a history of polysubstance abuse, bipolar disorder in partial remission, parkinsonism, myocardial infarction, sleep apnea, and diabetes. Case B is an 86-year-old African-American man with 18 years of schooling, a pro-rated WAIS-R IQ score of 115, a HART-B estimated IQ of 117 (26 correct), and a TMT B completion time of 163 s. He was healthy except for a heart murmur and benign prostatic hypertrophy.
RESULTS
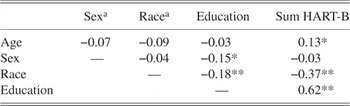
For descriptive purposes, the 327 healthy ABC study participants produced a mean prorated WAIS-R/III Full Scale IQ (FSIQ) of 106.7 (SD = 15.1), mean NART-R estimated FSIQ of 104.9 (SD = 10.3) and mean HART-B estimated FSIQ of 106.7 (SD = 11.7). The predictor variables (with nonlinear terms excluded) did not show marked multicollinearity (all VIFs < 2), and the correlations among them are displayed in Table 2. None of the measures was overly influenced by outliers (all Cook’s Ds < 1), and inspection of the q-q normality plots revealed nonnormal residuals for only one measure (total number of categories on the mWCST). In a large sample, violation of normality is not a serious offense, but it might point to other problems with the model. Indeed, heteroscedasticity was found for four measures: mWCST categories, BTA, BNT, and BVMT delayed recall. To account for heteroscedasticity, we followed previously reported methods (Van Der Elst et al., Reference Van Der Elst, Van Boxtel, Van Breukelen and Jolles2006) and used a different SEE (i.e., SD of the residuals) for each tertile of the predicted score for each of these four measures.
Bivariate Correlations Among Predictor Variables

Note
HART = Hopkins Adult Reading Test.
a Spearman rho.
* p < .05.
** p < .001.
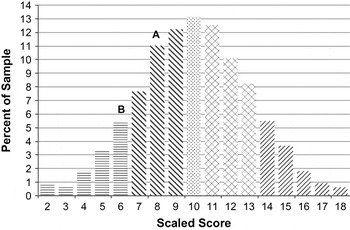
The distribution of TMT B raw scores for all 327 healthy ABC study participants is shown in Figure 1. The raw scores are transformed to scaled scores (M = 10; SD = 3) based on the cumulative frequency ranges (percentiles) as shown in Table 1. For example, raw scores (completion times in seconds) between 68 and 81 s on TMT B span the 43rd to 57th percentiles of the cumulative frequency distribution and, therefore, are classified as a scaled score of 10. Figure 2 depicts the frequency distribution of the resulting scaled scores for TMT B. Together, Figures 1 and 2 demonstrate how the conversion from raw scores to scaled scores normalizes the skewed distribution of TMT B raw scores. The raw and scaled scores for Cases A and B are identified in the figures. Compared with the entire normative sample, Case A’s raw score (103 s) is at the 25th percentile (SS = 8) and Case B’s raw score (163 s) is at the 9th percentile (SS = 6). Compared with a subset of age-matched participants (i.e., all ABC participants within ± 10 years of each case’s age), Case A’s normative position decreases slightly (16th percentile), while Case B’s improves (24th percentile).
Distribution of raw Trail Making Test, Part B (TMT B) scores for the entire Johns Hopkins Aging, Brain Imaging, and Cognition (ABC) study normative sample. The pattern coding in this figure and the subsequent one represents the scaled score equivalents (M = 10; SD = 3) of raw scores after they are transformed based on the cumulative frequency distribution depicted in Table 2. Case A’s and B’s raw scores are indicated by the letters “A” and “B” in the figure, respectively. Scaled score ranges are differentiated from each other in all figures so the reader can observe what happens to raw scores as they are transformed into scaled scores, residuals, and T scores.

Distribution of Trail Making Test, Part B (TMT B) scaled scores. The locations of Case A’s and B’s TMT B scaled scores are shown by the letters “A” and “B,” respectively.

Hierarchical MRA shows that 52% of the variance in TMT B is accounted for by the first block of predictor variables (see Table 3). Except for sex, each predictor accounted for a statistically significant portion of variance in TMT B scaled scores. An additional 6% (p < .001) of TMT B variability is accounted for by estimated IQ. Although a large portion of the variance (58%) in TMT B test performance by healthy adults was explained by the regression equation, 42% was not. The variance that was not explained by the predictors (i.e., the sum of residuals) is depicted graphically in Figure 3 using dropped error bars. If 100% of the variance in TMT B was explained by the predictor variables, we would have perfectly accurate prediction equations (i.e., all data points would fall on the regression line), and the sum of residual values would be zero. In this hypothetical situation, any deviation from the predicted score would be “abnormal.”
Predicted and observed scaled scores of all Johns Hopkins Aging, Brain Imaging, and Cognition (ABC) study normative participants for Trail Making Test, Part B (TMT B). Values located above and beneath the regression line are actual test scores that were higher and lower than predicted, respectively. Error bars are unidirectional and represent the observed/predicted discrepancy for each participant. Case A’s observed scaled score of 8 was lower than predicted (11.6) and Case B’s performance was very close to their predicted value (6.5). Thus, the raw discrepancy value for Case A is −0.3 and −0.5 for Case B.

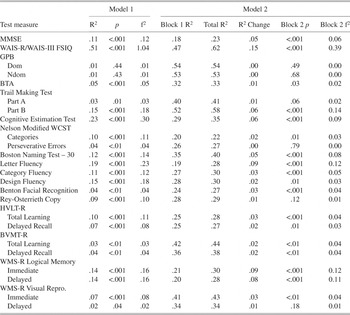
Proportion of Variance in Scaled Scores Accounted for by HART-B Alone (Model 1) and Incrementally, After Other Demographic Variables (Model 2)

Model 1 = Block 1: HART-B & HART-B2
Model 2 = Block 1: Age, Age2, Sex, Race, Education, Education2;
Block 2: HART-B & HART-B2
Note. HART = Hopkins Adult Reading Test; MMSE = Mini-Mental State Examination; WAIS = Wechsler Adult Intelligence Scale; GPB = Grooved Pegboard Test; BTA = Brief Test of Attention; WCST = Wisconsin Card Sorting Test; HVLT = Hopkins Verbal Learning Test; BVMT = Brief Visuospatial Memory Test–Revised; WMS = Wechsler Memory Scale.
As shown in Figure 3, residual values (discrepancy scores) vary widely across normative participants. For instance, our two cases differ in meaningful ways. The equation derived from the MRA analysis of TMT B is as follows:
TMT B Scaled Score = 9.863 − (0.024*age) − (0.0007*age2) − (0.101*sex) − (1.486*race) + (0.175*education) − (0.004*education2) + (0.274*HART-B) − (0.003*HART-B2)
Based on this, Case A’s actual scaled score of 8 (raw score of 103 s) on TMT B was lower than his demographically predicted score of 11.6. In contrast, Case B’s actual scaled score of 6 (raw score of 163 s) was much closer to his predicted scaled score of 6.5. Thus, the residual values (discrepancies) are −3.6 scaled score points for Case A and −0.5 for Case B.
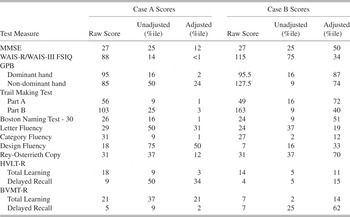
One assumption of MRA is that residual values around the regression line are normally distributed (Cohen et al., Reference Cohen, Cohen, West and Aiken2003). Indeed, the distribution of residuals for TMT B does not differ significantly from normal (KS = .56; p = .91; see Figure 4). For RBNs, the distribution of residual scores is very important because it is used to determine the likelihood of obtaining any given discrepancy. While the mean value of the residuals is typically zero, the standard error of the estimate (SEE) in our sample for TMT B is 1.97. Converting a discrepancy score to a z score is accomplished by dividing it by the SEE for the particular measure. For our two cases, this calculation produces z scores of −1.83 (−3.6/1.97) and −0.25 (−0.5/1.97) for Case A and B, respectively. These z scores can be converted easily to T scores by multiplying them by 10 and adding 50, resulting in values of 32 (3rd percentile) for Case A and 47 (40th percentile) for Case B. Similar to his age-matched TMT B performance (24th percentile), Case B’s discrepancy value was generally normal. In contrast to Case A’s age-matched TMT B performance (25th percentile), only 3% of the normative residuals for TMT B were larger than Case A’s. While the clinical interpretation of the derived percentile value depends on the cutoff used, it is clear that Case A’s performance is much lower than expected (and much lower than their age-matched score would suggest) and that Case B’s performance is well within the expected range. Table 4 contains raw and demographically corrected T scores for several measures administered to Case A and Case B. It should be noted that for measures in which heteroscedasticity was present (e.g., BNT), different SEE were used depending on the tertile of each participant’s predicted score.
Histogram of observed/predicted discrepancy values (i.e., residual scores) for the Johns Hopkins Aging, Brain Imaging, and Cognition (ABC) study normative sample on Trail Making Test, Part B (TMT B). The standard deviation of the raw residuals is 1.97. For Case A, dividing the discrepancy value of −3.6 by the standard deviation of the residual results in a z score of −1.83 and a T score of approximately 32. When converted to a percentile, this value suggests that approximately 3% of the normative sample had an equivalent discrepancy score or greater on TMT B. Case B’s T score of 47 is equal to or greater than approximately 40% of the normative sample.

Raw scores, as well as percentile equivalents for cases A and B’s unadjusted and adjusted scores

Note
Percentiles are derived from scaled scores (unadjusted) or t scores that were generated using equations from Model 2 (adjusted). MMSE = Mini-Mental State Examination; WAIS = Wechsler Adult Intelligence Scale; GPB = Grooved Pegboard Test; HVLT = Hopkins Verbal Learning Test; BVMT = Brief Visuospatial Memory Test.
Model 1 analyses indicate that estimated IQ accounts for significant variance in every measure except Grooved Pegboard. The proportion of variance accounted for by HART-B performance ranges from 1% (Grooved Pegboard) to 51% (WAIS-R/WAIS-III) with an average of 11%. Because the size of the sample may increase power and lead to several significant findings that may not be meaningful, effect sizes (f2) were calculated for the total variance accounted for by block 1, as well as the unique variance accounted for by HART-B and HART-B2 by block 2. Effect sizes of 0.02, 0.15, and 0.35 are considered small, medium, and large, respectively (Cohen, Reference Cohen1988). The average effect size for the variance accounted for by HART-B is 0.14 (median = 0.11), and suggests that the overall strength of the relationship between estimated IQ and cognitive test performance is medium. The largest effect is for WAIS-R/WAIS-II IQ. This was expected, as the HART-B is used to estimate IQ. Of the 24 measures, 13 measures had effect sizes that were 0.10 or larger.
The hierarchical analyses in Model 2 shows that the portion of variance accounted for by age, age2, sex, years of education, years of education2, and race ranges from 18 to 54% across the 24 measures. However, significant additional variance (2–15%) was explained by HART-B for 18 of the 24 measures. Effect sizes were calculated for the Block 2 R2 values. These revealed that the incremental variance accounted for by estimated IQ is on average small to medium, with 5 measures having effect sizes greater than 0.10, and 12 measures having effect sizes between 0.03 and 0.10. This suggests that estimated IQ can help benchmark expected performance on many cognitive tests, even after accounting for one’s demographic background.
DISCUSSION
We have provided a step-by-step description of our RBN approach, illustrating the procedure for transforming raw scores to discrepancy T scores using data from two case examples. Our goal was to contrast normative values based on demographically derived RBN discrepancy T scores with those generated by traditional stratification-based approaches. Compared with age-matched cohorts, Case A’s and B’s performances on TMT B were within normal limits. However, after calculating their RBN predicted scores and discrepancy values, only Case A’s performance is likely to be interpreted as lower than expected.
The amount of variance explained by individual differences in age, sex, race, and education in this study is generally comparable to that of other RBN systems. The variance accounted for by these variables (our initial block of variables in Model 2) ranged from 18% to 54%, with a median of 29%. Heaton and colleagues (1991, 2004) found that age, sex, and education explained from 1% to 64% of the variance across measures, with a median of 30%. The addition of estimated IQ as a predictor in our analyses slightly increased the median amount of explained variance, to 32%, and boosted the range of total variance accounted for to 22% to 62%. The incremental variance accounted for by HART-B and HART-B-squared ranged from 0% to 15%, with a mean of 4% (median = 2%). While adding estimated IQ significantly improved most of the prediction models, it is unclear whether this will improve diagnostic utility. It might be that adding estimated IQ as a predictor variable improves diagnostic accuracy for patients in certain IQ ranges. In any case, accounting for estimated IQ in test performance using an RBN approach clearly provides more precise guidance to clinicians who already consider estimated premorbid IQ to benchmark their expectations of a person’s performance, but do so subjectively and without empirical guidance (Steinberg & Bieliauskas, Reference Steinberg and Bieliauskas2005).
Although estimated IQ accounted for significant incremental variance in most measures, it did not improve predictions of Grooved Pegboard performance. Age-squared predicted much of the variance on this test (~50%), a finding that is consistent with meta-analysis results (Mitrushina, Boone, Razani, & D’Elia, Reference Mitrushina, Boone, Razani and D’Elia2005). Consistent with reports by Harnett et al. (Reference Harnett, Godfrey and Knight2004) and Knight et al. (Reference Knight, McMahon, Green and Skeaff2006), estimated IQ correlated with Part B but not Part A of the TMT. One explanation for this comes from a study in which “crystallized intelligence” (i.e., a measure of Vocabulary) correlated stronger with a task that required switching between sequences than a sequencing task that did not require switching (Salthouse, Toth, Daniels, Parks, Pak, & Wolbrette, Reference Salthouse, Toth, Daniels, Parks, Pak and Wolbrette2000). HART-B did not account for incremental variance in the number of errors obtained on the Nelson mWCST. One previous study (Harnett et al., Reference Harnett, Godfrey and Knight2004) found that NART-estimated IQ did predict errors on the WCST. When we replicated the stepwise procedures of Harnett et al. (Reference Harnett, Godfrey and Knight2004) by regressing mWCST scores on age, education and the HART-B, all three predictors remained in the model. Thus, it appears that including terms for age-squared, education-squared, and race in our models usurped the contribution of HART-B scores to mWCST performance. Finally, HART-B did not account for incremental variance in WMS-R Visual Reproduction delayed memory and the Rey-Osterrieth copy. A stepwise analysis of the first block variables reveals that the variance associated with WMS-R Visual Reproduction delayed memory was predicted by age-squared (29%), followed by education (3%) and race (2%). Education (12%), age-squared (10%), and race (4%) accounted for the most variance in Rey-Osterrieth copy accuracy.
Normative approaches that use IQ scores based on the WAIS-R or WAIS-III to predict cognitive test performance pose an inherent risk that predicted scores could be influenced by brain disease due to criterion contamination. Using a word reading test, such as the HART, to improve the precision of demographic estimates decreases this risk because oral word reading is relatively resistant to the effects of brain disease (McGurn et al., Reference McGurn, Starr, Topfer, Pattie, Whiteman and Lemmon2004). However, oral word reading is not entirely impervious to such effects (Cockburn, Keene, Hope, Smith, Reference Cockburn, Keene, Hope and Smith2000; Patterson, Graham, & Hodges, Reference Patterson, Graham and Hodges1994; Stebbins, Wilson, Gilley, & Bernard, Reference Stebbins, Wilson, Gilley and Bernard1990). Consequently, in patients with dementia or a reading disorder, including a term for word reading performance in prediction equations could artificially depress estimates of premorbid ability. In this case, by underestimating a patient’s premorbid ability, such predictions could decrease a test’s sensitivity. To address this issue, published norms that use word reading to predict performance should provide clinicians with options to either correct or not correct for reading performance (or other demographic variables).
The RBN approach appears to differ from traditional normative methods, but it actually relies on an interpretive strategy that psychologists have used for decades: an individual’s performance is evaluated against that of demographically similar healthy persons. Whereas the conventional approach takes a demographically similar healthy group’s mean score as the expected value, the RBN approach merely uses an algebraic equation to derive the expected value for persons of demographically identical background. In so doing, the RBN approach overcomes statistical and psychometric shortcomings of group stratification (Zachary & Gorsuch, Reference Zachary and Gorsuch1985), and it can generate individualized predicted scores based on multiple factors simultaneously. However, certain caveats apply to RBNs, especially if assumptions of MRA are violated. For instance, suppose that women in their 30s produce a mean score of 25 on some test, while those in their 40s earn a mean of 21, and those in their 50s earn a mean of 24. The RBN approach will not capture this break in monotonicity, whereas stratified age groups will. In this instance, the form of the relationship between age and test performance must be identified and incorporated into prediction equations using special methods (Friedman, Reference Friedman1991). Of course, if the poorer performance of women in their 40s reflects sampling bias, then the RBN approach would be superior to age stratification because RBNs assess age effects using all the available data points, thus compensating for sampling idiosyncrasies. Another caveat concerns the fact that expected scores can be computed for individuals whose demographic characteristics fall outside the range of a normative sample, for example, a 10-year-old college graduate. Like conventional norms, RBNs should not be used for such cases.
Only one of our measures (category sorts on the mWCST) violated the statistical assumption that score residuals are normally distributed. However, nonnormal residuals do not lead to biased regression coefficients. Rather, they more often point to a problem with model specification. A more serious violation for the purposes of RBN is when the variance of residuals differs over the continuum of test scores (i.e., show heteroscedasticity). Violation of this assumption in the RBN approach means that discrepancy scores will be standardized based on inconsistent standard error terms. In other words, scores that fall 10 points below expected values will reflect different levels of impairment when the expected score is 35 than when the expected score is 60. In this situation, the optimal solution is to stratify the sample by level of predicted performance, compute the standard deviation of the residual for each stratification group, and use these standard error terms to equate discrepancy scores across the continuum of test performance (Van Der Elst et al., Reference Van Der Elst, Van Boxtel, Van Breukelen and Jolles2006).
Two limitations of this study warrant discussion. First, we used a fairly large sample. Consequently, even predictor variables that account for small portions of the variability in test performance can reach statistical significance. In addition, we performed moderately large number of analyses, and together these factors might increase the Type I error rate. Thus, it is possible that some of the obtained findings would not replicate in other samples, or do not translate into clinically meaningful effects. In most cases, the variance in cognitive performance explained by the HART-B was modest. Thus, while including a term for estimated “premorbid” IQ in RBN equations clearly increases their predictive accuracy, the clinical usefulness of this increase remains to be determined. A second limitation is that the RBN approach to scaling test performance probably is more useful for determining whether a particular performance is lower than expected than for other purposes. For example, adjusting test scores for age, education, race, and estimated premorbid IQ precludes studying these characteristics as predictors of diseases or conditions with which they correlate. Also, raw scores might better predict a person’s capacity to succeed in meeting everyday functional demands, such as driving an automobile safely or maintaining work (Silverberg & Millis, Reference Silverberg and Millis2009).
This study shows that word reading estimates of “premorbid” IQ account for significant variance in cognitive performance above and beyond that explained by age, education, race, and sex. To determine whether including estimated IQ in predictive equations translates to improved diagnostic and predictive utility, it must be tested in patient samples. While other investigators have found that adjusting test performance for estimated IQ is clinically useful (Drebing et al., Reference Drebing, Van Gorp, Stuck, Mitrushina and Beck1994; Rentz et al., Reference Rentz, Huh, Faust, Budson, Scinto and Sperling2004, Reference Rentz, Sardinha, Huh, Searl, Daffner and Sperling2006, Reference Rentz, Huh, Sardinha, Moran, Becker and Daffner2007), these studies have not focused on RBN methodology. Preliminary data indicate that such an approach may improve sensitivity without reducing specificity (Testa & Schretlen, Reference Testa and Schretlen2006).
ACKNOWLEDGMENTS
This research was supported by NIMH grant MH60504, The Therapeutic Cognitive Neuroscience Fund, and the Benjamin and Adith Miller Family Endowment on Aging, Alzheimer’s, and Autism Research. Dr. Schretlen receives royalties from sales of the Brief Test of Attention. No other co-author has any conflict of interest related to the research reported in this article.v