Completely monetarized communities could not have stood the ruinous effects of abrupt changes in the price level necessitated by the maintenance of stable exchanges unless the shock was cushioned by the means of an independent central banking policy. […] Absence of such a mechanism would have made it impossible for any advanced country to stay on gold without devastating effects as to its welfare, whether in terms of production, income, or employment.
—Karl Polanyi, The Great Transformation (1944, p. 218)
Countries wish to reap the benefits of financial integration while shielding themselves from the vagaries of international financial markets. But can they have it both ways? A large body of work acknowledges the constraints of a trilemma, in the spirit of Robert Mundell’s international macroeconomic model, pointing out that a fixed-exchange rate regime and full capital account openness lead countries to give up their monetary autonomy (Obstfeld and Taylor Reference Obstfeld and Taylor2004; Farhi and Werning Reference Farhi and Werning2014; Bordo and James Reference Bordo and James2015; Jordà, Schularick, and Taylor Reference Jordà, Schularick and Taylor2020). The first era of globalization, also referred to as the period of the classical gold standard (1870s–1914), is taken as the paradigmatic example of such constraints, with central banks changing their discount rate in function of international pressures only (Eichengreen Reference Eichengreen1992, Reference Eichengreen2008; Obstfeld and Taylor Reference Obstfeld and Taylor2004; Bordo and James Reference Bordo and James2015). Yet, there is a lack of quantitative information on what central banks actually did during this period, how they adjusted their portfolio in response to international shocks, or how the performances of countries with a central bank compared to those of countries without one.
Our study is based on a dataset of detailed and standardized monthly balance sheets of all central banks in the world from 1891 to 1913, as well as interest rates and exchange rates. This is the first time that such a comprehensive and monthly dataset has been assembled to study central banking during the gold standard. Including both core and peripheral countries, comparing countries on and off gold, and adding a country without a central bank (the United States) to the analysis, we revisit the role of central banks and the constraints of the exchange rate regime.
In the spirit of the recent literature looking at the influence of U.S. interest rates on the global financial cycle and foreign monetary policy (Bruno and Shin 2015; Rey Reference Rey2016; Jordà et al. 2019; Miranda-Agrippino and Rey Reference Miranda-Agrippino and Rey2020), we examine the response of central banks to an exogenous increase in the interest rate of the Bank of England (BoE)—then the leader of global financial markets (Lindert Reference Lindert1969; Eichengreen Reference Eichengreen1987). In a fixed-exchange rate regime with capital mobility, theory predicts that an exogenous increase in the leading international interest rate attracts capital flows to the center country, and it forces foreign central banks to increase their rates in a similar way. But how did it work in practice? Thanks to the high frequency and large coverage of this dataset, we provide a new way to identify and highlight the importance of central banks’ balance sheets in absorbing international shocks. As argued by Polanyi in the quote in the epigraph of this paper, domestic interest rates did not adjust fully to international rates thanks to the movements in the balance sheet of the central bank. Based on historical evidence, we also discuss why omitted variables and reverse causality are unlikely to bias our results. In addition, a series of robustness checks addresses these concerns through econometric methods (control variables and identification based on a narrative approach) for the whole sample.
Four results stand out. First, as already suggested by Bloomfield (Reference Bloomfield1959), central banks in the gold standard did not raise their interest rates by the same order of magnitude as the BoE (the average pass-through was around 20 percent). Instead, central banks offset the effect of international shocks on the domestic interest rate by increasing their loans to the domestic economy. Second, while central banks in core countries let their international assets decrease (through foreign exchange interventions and gold sales) to offset short-term international shocks, the central banks on the periphery of the gold standard used restrictions on gold convertibility (i.e., a form of capital control in today’s parlance) to minimize reserve losses. Such strategy allowed them to operate with wider exchange-rate bands, without suspending officially their adherence to the gold standard. Third, none of the mechanisms was observed by central banks in countries off gold: in floating countries, the exchange rate absorbed fully the international shock.
Fourth, we also study the response of (private market) interest rates and gold held by the Treasury in the United States, a major country without a central bank during the classical gold standard period. We find that the response of the U.S. money market interest rate to an exogenous change in the English rate was two to four times as large as the response of rates in countries with a central bank. To be precise, the difference in interest rate reaction ranges from factor 2 (benchmark estimation comparing the United States with core countries on the gold standard) to factor 4 (comparing the United States with peripheral countries on the gold standard based on an estimation technique better suited to address endogeneity concerns), with various other estimations falling in between these boundaries. Consistent with a strong and rapid response of interest rates, the exchange rate between New York and London adjusted more quickly than in countries with a central bank. The United States enjoyed much less autonomy and—as suggested by Davis, Hanes, and Rhode (Reference Davis, Hanes and Rhode2009) and Hanes and Rhode (Reference Hanes and Rhode2013)—lacked a central bank that could have offset the effects of international shocks on the domestic money supply. This paper presents for the first time an estimate of the high price the United States paid for not having a central bank before 1913. This conclusion is supported by an additional estimation of the effects of BoE bank rate changes on stock markets. The impact is significant only in the United States.
Taken together, our results show why central banks mattered under the gold standard as they played a role in absorbing the effect of international financial shocks. In the words of Polanyi (1944, p. 207), “central banking reduced the automatism of the gold standard to a mere pretense.” Our results also highlight the different instruments—foreign exchange interventions and gold sales, convertibility restrictions, and domestic loans—that were used by central banks during the first globalization to mitigate the potentially adverse effects of short-term international shocks. Several papers written in the last two decades have focused on a specific central bank and have highlighted through a quantitative lens the role of such interventions, but they typically eschew a comparative perspective.Footnote 1 The virtue of our approach is to analyze in a comprehensive manner the various central bank strategies pursued at the time and assess their respective quantitative dimensions.
The immediate response of foreign exchange rates to an increase in the BoE interest rate confirms that the integration of global financial markets during this period was very high. Our empirical findings are consistent with the predictions of the textbook trilemma (Obstfeld and Taylor Reference Obstfeld and Taylor2004), as a floating exchange rate gave full autonomy to domestic monetary policy. Yet it is worth emphasizing that—despite the apparent benefit of floating exchange rates—most countries in the first era of financial globalization preferred to join the gold standard in order to attract long-term capital flows (Bordo and Kydland Reference Bordo and Kydland1995; Mitchener and Weidenmier Reference Mitchener and Weidenmier2015), while letting their central bank use various tools to offset undesired effects of short-term capital flows. The most important conclusion of this study is that the classical gold standard period was not a period of total submission of countries to the fluctuations of international financial markets. The balance sheets of central banks stood as a buffer between the domestic economy and the global financial cycle. Our contention is that we can learn from central banks during this era for today’s monetary policy. If central banks managed to offset the effects of international shocks in a context of very high mobility of international capital and fixed-exchange rates (the gold standard), similar tools can likely be used in the current context where the exchange rate constraints have been—at least partly—relaxed.
THE TRILEMMA AND CENTRAL BANK BALANCE SHEETS UNDER THE GOLD STANDARD
This paper is the first to study in detail the short-term (monthly) adjustment and responses of central banks to international shocks during the gold standard. Yet our main argument is not entirely new. Following Nurkse (Reference Nurkse1944), Bloomfield (Reference Bloomfield1959) and Triffin (Reference Triffin1964) first argued that changes in the central bank balance sheet could explain why central bank discount rates did not move in line. Indeed, according to the basic model of the gold standard (the “price-specie flow mechanism”), a fixed exchange rate parity implies that central banks adjust their rate to one another (Bordo and Schwartz 1984; Eichengreen Reference Eichengreen2008, ch. 2): when a deficit country loses gold, the ensuing deflationary impulse would stabilize the balance of payments, as domestic goods become cheaper. In such a framework, the central bank is supposed to play by the “rules of the game,” that is, to accelerate the system’s natural adjustment process by increasing its interest rate.
It is easy to reformulate the “rules of the game” in the context of the trilemma of Obstfeld and Taylor (Reference Obstfeld and Taylor2004). In a world of free movement of capital and fixed-exchange rates, the central bank’s interest rate should be concerned with defending the peg. Therefore, when capital flows out of a country, the central bank must also increase its interest rate. Breaking the “rules of the game”—that is, avoiding a change in the domestic rate equal to the one in the international rate—is therefore equivalent to escaping the trilemma.Footnote 2 Contrary to the approach of Bloomfield (Reference Bloomfield1959), Mundell (Reference Mundell1963), and the price-specie flow mechanism, the trilemma of Obstfeld and Taylor (Reference Obstfeld and Taylor2004) is not concerned with the aggregate money supply. The trilemma approach focuses on the spread between domestic and international interest rates. From this perspective, the movements in the balance sheets of the central banks should not be considered for their effect on the money supply but only for their effect on the exchange rate and interest rates.Footnote 3 We now describe how the central bank balance sheet can be used to round the corners of the trilemma by taming the effect of the international interest rate on the domestic rate.
Contrary to central bank operations today, it is unlikely that an increase in central bank loans to the domestic economy was fully deliberate under the gold standard (Bloomfield Reference Bloomfield1959, p. 47). Central banks were reacting to the borrowing demand of banks at a fixed rate rather than purchasing or selling bills on the open market or setting reserve requirements (Bazot, Bordo, and Monnet Reference Bazot, Bordo and Monnet2016). An increase in the international rate pushes the domestic money market rate up due to arbitrage in international financial markets. At the same time, agents demand foreign assets (gold or foreign exchange) from the central bank to obtain a higher return. The central bank’s international assets decline while the domestic money market rate approaches the level of the central bank discount rate. When it becomes cheaper to borrow from the central bank rather than from the market (at least for a fraction of the banking system), the demand for borrowing increases at the central bank. In response, the central bank’s domestic assets increase. Hence, after an increase in the international interest rate leads to a depreciation of the domestic exchange rate, the decrease in foreign assets (through foreign exchange interventions and gold sales) limits the effect of the exchange rate depreciation. At the same time, the increase in central bank domestic assets allows the domestic private rate to stay below the central bank policy rate and thus maintain a spread with the international rate. Crucially, both types of intervention are needed: foreign exchange interventions would return the exchange rate to parity but would not be sufficient to allow the central bank’s policy rate to deviate from the international rate.
Identification
We propose a new identification strategy that allows testing whether central bank balance sheets played the roles described earlier. In the context of the classical gold standard, a change in the discount rate of the BoE provides an exogenous shock that affects international capital flows in all countries in the same way. A change to the discount rate of the BoE—the conductor of the orchestra in Keynes’ famous words, an assessment supported by subsequent research (Lindert Reference Lindert1969; Eichengreen Reference Eichengreen1987; Morys Reference Morys2013; Bazot, Bordo, and Monnet Reference Bazot, Bordo and Monnet2016)—is the quintessential shock to the exchange rate of another country. An increase in the BoE discount rate would attract capital to England and create capital outflows and exchange rate depreciation elsewhere.
The advantage of such an identification is twofold. First, movements in the BoE discount rate can be deemed exogenous to the behavior of other central banks during this period (see our discussion later). This assumption is also the basis for the work of Obstfeld and Taylor (Reference Obstfeld and Taylor2004) and Jordà et al. (2019) on the trilemma during the gold standard period. Second, we can verify—for each country—whether this shock is indeed a shock that is likely to drive capital flows by looking at the reaction of the exchange rate.
This identification is consistent with the recent literature looking at today’s influence of U.S. interest rates on the global financial cycle (starting with the seminal study of Rey (Reference Rey2016)). We will show in the robustness section that our conclusions still hold if we use alternative measures of exogenous English monetary policy shocks.
THEORETICAL PREDICTIONS AND METHOD OF ESTIMATIONS
Theoretical Predictions
The trilemma in international macroeconomics implies the following four scenarios after an increase in the BoE discount rate: The first scenario is equivalent to the plain trilemma case with a fixed-exchange rate and full capital mobility. It would also be equivalent to the “rules of the game” as defined in the gold standard literature. Scenario 2 is the same case where we consider the role of the central bank’s domestic and international assets in rounding the corners of the trilemma, as explained in the previous section. This scenario is usually not investigated in empirical studies of the trilemma, as it requires balance sheet data. Scenario 3 is the trilemma case with fixed-exchange rates and capital controls. Scenario 4 is the case with floating exchange rates.
SCENARIO 1: FULLY BINDING INTERNATIONAL CONSTRAINT
In a fixed-exchange rate regime with full capital mobility, an increase in the international interest rate (BoE in this case) will be followed by a similar increase in the domestic central bank’s discount rate, stabilizing the exchange rate in the process. If the central bank increases its rate by the same magnitude as the BoE, the reaction of the exchange rate may not be visible at all at a monthly frequency, since the exchange rate may adjust quickly through uncovered interest rate parity. If the exchange rate does not come back to parity immediately and the shock of the BoE rate is large enough to reduce gold reserves, we should observe a decrease in domestic assets.
SCENARIO 2: THE BUFFER ROLE OF THE CENTRAL BANK’S DOMESTIC AND INTERNATIONAL ASSETS
The decrease in foreign assets allows the exchange rate to appreciate and come back to parity. The central bank offsets the decrease in foreign assets with an increase in domestic assets. This increase prevents private domestic rates from following the increase in the international rate. Expanding credit means that the discount rate needs to be raised by less than under scenario 1; consequently, we observe a smaller reaction of the discount rate to an increase in the BoE rate.
As long as the central bank is committed to convertibility (unconditional and immediate conversion of banknotes into gold), the exchange rate will quickly move back to mint parity as a result of gold outflows or foreign exchange intervention. If uncovered interest rate parity (UIP) holds, this is reinforced if investors themselves expect the exchange rate to come back to mint parity (Bordo and MacDonald Reference Bordo and MacDonald2005). It does not prevent the global functioning of the gold standard either, that is, gold flows play a strong stabilizing role on the exchange rate.
SCENARIO 3: IMPERFECT CONVERTIBILITY
We expect the impact of an increase in the BoE rate on the exchange rate to be larger in the case of imperfect convertibility (i.e., restrictions on convertibility between notes and gold at the central bank; see Bloomfield (Reference Bloomfield1959) and Ford (Reference Ford, Mathias and Pollard1989) for a review). Restrictions on gold convertibility widen the gold points, allowing the exchange rate to depreciate further than in scenarios 1 and 2. Such policies are aimed at protecting international reserves and reducing the interest rate adjustment. On both variables, we expect a smaller response than in scenarios 1 and 2. In the absence of a large reserve outflow, the central bank might nevertheless increase domestic credit in order to avoid an increase in market rates. Imperfect convertibility mitigates the decrease of gold reserves by the central bank but does not necessarily stop it entirely or prevent any arbitrage opportunity.
SCENARIO 4: COUNTRIES OFF GOLD
A fourth scenario is concerned with countries on a floating exchange rate. Assuming an open capital account (i.e., the norm during this period), the exchange rate will fully absorb the shock. The central bank does not need to expand either domestic credit or increase its discount rate.
Method of Estimation
We study the reaction of central banks’ balance sheets, exchange rates, and interest rates to an exogenous increase in the BoE rate. Our identification strategy allows us to study simultaneously the degree of monetary autonomy (the response of the domestic rate to the English rate) and the means employed by central banks to achieve such autonomy (domestic loans, foreign exchange interventions, floating exchange rates, or imperfect convertibility).
Following a now well-established empirical literature on the effects of monetary policy shocks (Jordà Reference Jordà2005; Ramey Reference Ramey, John and Uhlig2016; Jordà et al. 2019), we use local projections to estimate the effect of a shock on the BoE interest rate. This method allows estimating impulse-responses (IR) directly from an exogenous shock without relying on a predefined model.
Let K be the dimension of the vector of macroeconomic aggregates of interest. M is the number of countries, T is the time dimension, and H is the time horizon for which we want to measure the response to a shock. Let
 $y_{i,t + h}^k$
be the value of variable k = 1, …, K observed for a country i = 1, …, M, for which we measure the response to a shock on the BoE rate in horizon 0 ≤ h ≤ H. Lastly, let Y
i,t
denote the vector of
 $y_{i,t}^k$
variables.
If
 $$r_t^{BoE}$$
is the BoE discount rate, the impulse response to a shock (δ) on
 $$r_t^{BoE}$$
is measured as:
 $$IR\left( {y_{i,t + h}^k,\delta } \right) = {E_{it}}\left( {y_{i,t + h}^k|\delta = 1;{Y_{i,t}},{Y_{i,t - 1}}, \ldots } \right) - {E_{it}}\left( {y_{i,t + h}^k|\delta = 0;{Y_{i,t}},{Y_{i,t - 1}}, \ldots } \right)$$
.
A shock δ = 1 means that
 $$r_t^{BoE}$$
increases by 100 basis points.
The local projections consist of measuring
 $$IR\left( {y_{i,t + h}^k,\delta } \right)$$
based on a sequence of predictive fixed effects panel regressions of the variable of interest on an exogenous shock to horizon h:
 $$y_{(i,t + h)}^k = {\alpha _i} + {\Phi _h}(L){Y_{(t - 1)}} + {\beta _h}\Delta r_t^{BoE} + trend + {\varepsilon _{h,it}}for\,h = 0,1,2, \ldots ,H,$$
where Φ
h
(L) is the polynomial set of lag operator (which is set at 3 in our analysis), the unanticipated change in the BoE discount rate, α
i
the country fixed effects, and ε
h,it
the residual. The IR is the set of estimated
 $$\widehat {{\beta _h}}$$
from h = 0 to h = H.Footnote
4
There are as many sequences as there are variables of interest. Following Ramey (Reference Ramey, John and Uhlig2016), we include a trend in the estimation to account for potential non-stationarity (none of our results are sensitive to this assumption).
Starting with h = 0 rather than h = 1 is a timing restriction, implying that domestic macroeconomic variables can respond immediately to a change in the interest rate of the BoE.Footnote 5 In practice, central banks moved their own discount rates, typically a few days after the BoE changed its rate (for a similar observation, cf. Lindert (Reference Lindert1969)).
DATA AND GROUP OF COUNTRIES
Sources
Our dataset is based on an exceptional source that has never been exploited before.Footnote 6 The French central bank (Bank of France) began collecting systematically the weekly or monthly balance sheets of all central banks worldwide in 1891. Central banks publish these balance sheets at a high frequency, in addition to their annual reports to shareholders. The legal (or in some cases, customary) obligation to publish these balance sheets was justified by the requirements to which central banks were subject in terms of the relationship between the currency in circulation and the reserves, or the ceilings on circulation. Figures of banknotes in circulation and gold reserves were carefully looked at by policymakers and investors; they were published in major financial newspapers, alongside data on exchange rates and discount rates (e.g., L’Economiste Européen in France, The Banker in the United Kingdom, Le Moniteur in Belgium, see Baubeau (Reference Baubeau2018)). However, newspapers did not publish data on other central bank assets, which were far more difficult to harmonize and compare, given the different accounting practices of countries.Footnote 7
The Bank of France took on this difficult and tedious task. Sufficient skills were needed to translate and understand the various reports. We use monthly data to achieve the highest possible frequency available for all central banks.Footnote 8 We also consulted the annual balance sheets, likewise prepared by the Bank of France and based on the annual reports of the respective central banks, in order to establish whether some balance sheet items were missing from the weekly and monthly publications.Footnote 9 For instance, in a limited number of cases and only when numbers were small, foreign exchange reserves were only published in the annual report (see Online Appendix).
Data
The joint evolution of domestic and international portfolios is key to our analysis. Fortunately, the harmonized balance sheet provided by the source helped build those series. For each country, we assembled five major series: (1) metallic reserves (gold plus silver); (2) foreign paper (bills of exchange drawn on foreign places); (3) funds held abroad; (4) discount portfolio of domestic paper; (5) short term advances on securities and other collateral. (1), (2), and (3) constitute the international portfolio, while (4) and (5) capture the domestic portfolio. Details about all five series are available in the Online Appendix.
Our dataset includes 21 central banks, encompassing all central banks worldwide during the period 1891–1913 (the Swiss National Bank was created only in 1908 and the U.S. Federal Reserve in 1913). As Italy had three large banks of note issue (Bank of Italy, Bank of Naples, and Bank of Sicily), we have a panel data set of 19 countries with a central bank.Footnote 10 The Online Appendix discusses a few other cases of multiple banks of issue. In the next section, we will add one country without a central bank (the United States) for the purpose of comparison.
Series of discount rates of these central banks are also available in our original source (and compiled in Roulleau (Reference Roulleau1914)), which we double-checked with the daily discount rate data underlying Morys (Reference Morys2013) for 12 of the countries in our study. For two reasons, we use official discount rates and not private discount rates. First, we are interested in the constraints imposed upon the central banks: how did their main policy instrument need to change in response to a discount rate increase by the BoE? Second, while we are aware that international arbitrage was at the heart of the adjustment mechanism described in this paper, and that arbitrageurs were motivated by private rather than official rates, we simply do not have data on private rates for enough countries; or, to be more precise, in the majority of countries in which money market rates are published by the Economist, they are simply equal to the central bank policy rate (Neal and Weidenmier Reference Neal, Weidenmier, Michael, Alan and Jeffrey2003).Footnote 11 This implies that using the published market rates for peripheral countries is equivalent to using the central bank discount rate (as done by Mitchener and Weidenmier (Reference Mitchener and Weidenmier2015) to compute risk premia over this period). We ran robustness checks for all countries for which we could muster private discount rate data (France, Germany, the Netherlands, Austria, and Belgium), with results qualitatively no different from our baseline estimations (Online Appendix Figure A-8). Our only half-successful attempt to collect private rates has shown us that domestic money markets remain insufficiently understood. This is the case even for core countries like Germany (Morys Reference Morys2021b). Based on our knowledge of the South-East European economies, we do not think that the equivalence between money market rates and central bank rates in most countries implied that there was no money market. It only means that there was no centralized market price, but interbank peer-to-peer lending and similar activities almost certainly took place (transactions for which the central bank rate served as a reference point). This view is supported by ample evidence that the foundation of banks of note issue in peripheral countries was typically motivated by lowering (and to some extent regulating) pre-existing money market rates (Morys Reference Morys2014). Moreover, even in countries like France, with a well-established money market for prime bills between a small number of banks (Bazot, Bordo, and Monnet Reference Bazot, Bordo and Monnet2016), the discount of commercial paper was typically conducted at the central bank rate throughout the country (Roulleau Reference Roulleau1914, pp. 159–62).
Finally, we gathered a monthly series of exchange rates for London from various sources, mostly from Schneider, Schwarzer, and Zellfelder (Reference Schneider, Schwarzer and Zellfelder1991, Reference Schneider, Schwarzer and Zellfelder1994, Reference Schneider, Schwarzer and Zellfelder1999) and Morys (Reference Morys2013).Footnote 12 We use exchange rates as a deviation from mint parity (that is the official exchange rate between gold and domestic currency). Mint parities were also available in our original source, in the archives of the Bank of France. Countries off the gold standard also have a mint parity, but central banks in these countries had no commitment to redeem notes in gold at such a price. For reasons of consistency, all data (balance sheet data, discount rates, and exchange rates) are end-of-the-month values. For all countries except Japan, the monthly balance sheet of the central bank is available starting in the early 1890s; usually as soon as January 1891. Data on Japan start in 1899, one year after the country entered the gold standard. For a significant number of countries, we have data on their central banks both before and after they joined the gold standard.
Groups of Countries
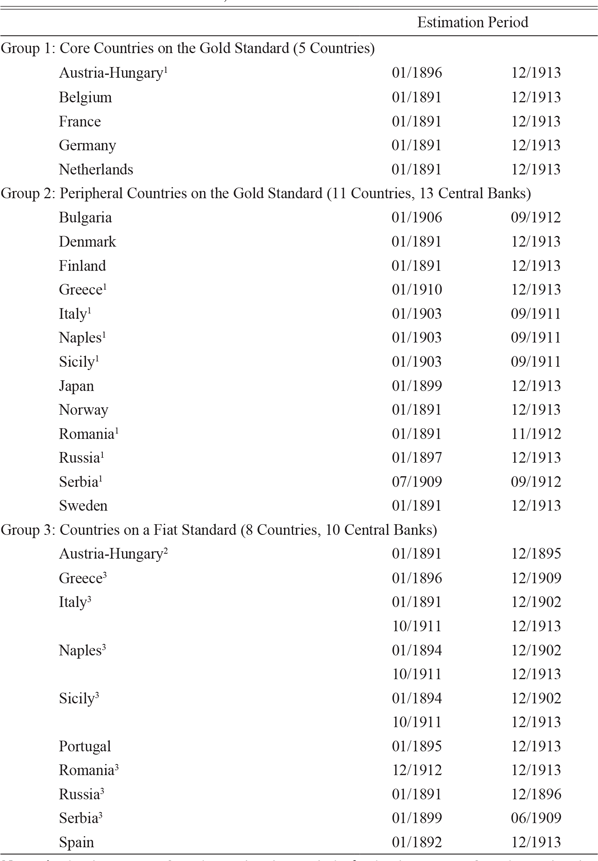
There is no reason to believe that the 21 central banks in our sample behave in the same way, particularly because they did not all have the same exchange rate regime and level of financial integration. For this reason, we will look at different groups of countries—defined in a way that is consistent with the historical context and the literature on the gold standard—and we will discuss how close they were to the theoretical predictions of Section 2. We distinguish three groups of countries with a central bank: (1) core countries on the gold standard; (2) peripheral countries on the gold standard; and (3) countries with a floating exchange rate (fiat standard).
As for gold standard adherence, we follow the consensual classification that has emerged from an extensive literature on this matter (Flandreau and Zumer Reference Flandreau and Zumer2004; Obstfeld, Shambaugh, and Taylor Reference Obstfeld, Shambaugh and Taylor2005; Mitchener and Weidenmier Reference Mitchener and Weidenmier2015; Morys Reference Morys, Pfister, Hesse, Spörer and Wolf2021a).Footnote 13 The distinction between groups (1) and (2) hinges upon the definition of core versus periphery. Economic historians agree to consider Belgium, England, France, Germany, and the Netherlands as core countries in the international financial system because they had mature money markets, a liquid foreign exchange market, and could issue sovereign debt in their own currency (Bordo and Flandreau Reference Bordo, Flandreau, Michael, Alan and Jeffrey2003, p. 349; Flandreau and Jobst Reference Flandreau and Jobst2005; Morys Reference Morys2013). Outside this group, Austria-Hungary is a borderline case. Money and exchange markets were liquid and well-developed (Reichsbank 1925, pp. 212–31; Jobst Reference Jobst2009), but Austria-Hungary had to insert gold clauses into their bonds to issue them abroad (Morys Reference Morys2006). Since sovereign debt is less crucial to our study, we decided to classify Austria-Hungary as a core country. Such an approach is vindicated by a statistical analysis of Austria-Hungary on its own, when its results are in line with all other core countries. The empirical conclusions presented in the next section are not qualitatively modified if Austria-Hungary is included in the periphery.
Table 1 summarizes our three groups of countries, with details about a country’s date of entry into and exit from the gold standard (“estimation period”) where relevant. When a country joins the gold standard, it moves from Group 3 to Group 1 or 2. Therefore, a country may appear in two groups but with different estimation periods.
Country groups: Core countries on gold, peripheral countries on gold, fiat standard countries

Notes: 1 Also in group 3 for other estimation periods. 2 Also in group 1 for other estimation periods. 3 Also in group 2 for other estimation periods.
Sources: Gold standard adherence based on de-facto exchange-rate classification proposed by Obstfeld, Shambaugh, and Taylor (Reference Obstfeld, Shambaugh and Taylor2005) and exchange-rate sources as described in the main text.
ESTIMATIONS AND RESULTS
Specification and Variables
Local projections are easy to estimate with state-dependent variables. We can thus include “gold standard” and “core-periphery” dummy variables to interact with the set of other variables. This allows us to estimate the effect of the shock for each group of countries defined in the previous section. As such, we use three different models (one for each group):
 $$\eqalign{
& y_{i,t + h}^k = {\alpha _i} + core\,in\,G{S_{t - 1}} \times \left[ {{\Phi _h}\left( L \right){Y_{t - 1}} + {\beta _{a,h}}\Delta r_t^{BoE}} \right] + trend + {\varepsilon _{h,it}} \cr
& y_{i,t + h}^k = {\alpha _i} + periphery\,in\,G{S_{t - 1}} \times \left[ {{\Phi _h}\left( L \right){Y_{t - 1}} + {\beta _{b,h}}\Delta r_t^{BoE}} \right] + trend + {\varepsilon _{h,it}} \cr
& y_{i,t + h}^k = {\alpha _i} + floatin{g_{t - 1}} \times \left[ {{\Phi _h}\left( L \right){Y_{t - 1}} + {\beta _{c,h}}\Delta r_t^{BoE}} \right] + trend + {\varepsilon _{h,it}} \cr} $$
core in GS is a dummy variable equal to 1 if the country belongs to the core and adheres to the Gold Standard at time t, periphery in GS is a dummy variable equal to 1 if the country belongs to the periphery and adheres to the Gold Standard at time t, floating is a dummy variable equal to 1 if the country’s exchange rate is floating. β a,h , β b,h , and β c,h , are picked up from h = 0 to h = H, to build impulse response functions (IRFs) for each group. Thus, β a,h corresponds to the response of group 1, β b,h corresponds to the response of group 2, and β c,h corresponds to the response of group 3.Footnote 14
The variables of interest included in our benchmark estimations are the following: the BoE discount rate (in percent); the natural logarithm of total international assets; the natural logarithm of total domestic assets; the country-specific central bank discount rate; and the exchange-rate deviation from mint parity (with positive values denoting depreciation). The vector of control variables is composed of three lags for each variable of interest. Panel data unit root tests have been performed based on Fisher-type tests and Im-Pesaran-Shin tests. Non-stationarity is rejected in all cases at the 1 percent confidence interval. Each regression includes country-fixed effects. To correct for heteroskedasticity and serial correlation, we use clustered standard errors when estimation is in a panel, or use the Newey West procedure when the estimation is for a single country (the United States, in the next section).
In the figures, we look at the responses of the following variables to an increase in the discount rate of the BoE by 1 percent (100 basis points). We report two standard-error bands for impulse responses. Given the aforementioned data manipulations, responses are read in all four cases as the percentage change compared to month t = –1 (with positive values in the lower right panel meaning depreciation).Footnote 15
Core Countries
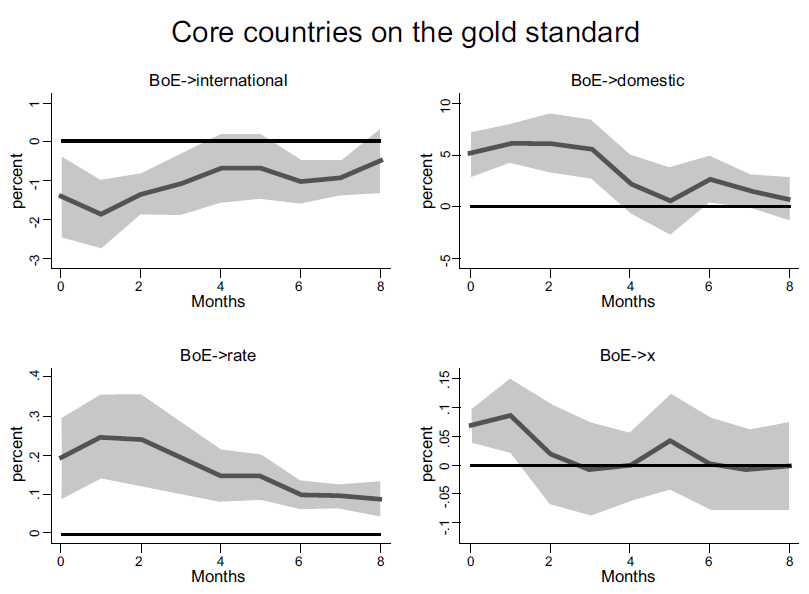
Figure 1 shows how core countries reacted to a shock in the BoE discount rate. They increased their interest rate only by a small magnitude: 24 basis points after a shock of 100 basis points. Put differently, the interest rate pass-through is much lower than unity and amounts to approximately 24 percent (for a similar finding from a different estimation perspective Obstfeld and Taylor (Reference Obstfeld and Taylor2004) and Morys (Reference Morys2013)). This imperfect pass-through allows for arbitrage in international markets. The exchange-rate depreciation is rather small (+0.08 percent, with positive values denominating depreciation), and comes back to parity after two months. This result contrasts with peripheral countries where depreciation was greater and of longer duration (see Figure 2).
THE REACTION OF CENTRAL BANKS IN GOLD STANDARD CORE COUNTRIES TO AN ENGLISH DISCOUNT RATE SHOCK OF 100 BASIS POINTS IN THE FIRST EIGHT MONTHS
Units: Percentage change compared to month t = –1 (positive exchange-rate response in lower right panel indicates depreciation).
Notes: “international” and “domestic” denote the international and domestic portfolios of central banks, “rate” is the discount rate of central banks, and “x” the exchange rate on London. Sources: Own calculations based on sources as described in the main text and the Online Appendix.

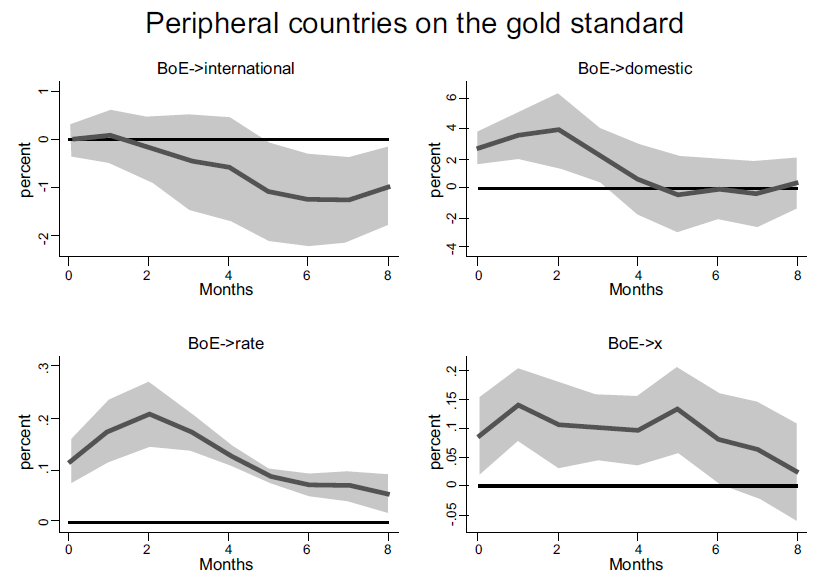
THE REACTION OF CENTRAL BANKS IN GOLD STANDARD PERIPHERAL COUNTRIES TO AN ENGLISH DISCOUNT RATE SHOCK OF 100 BASIS POINTS IN THE FIRST EIGHT MONTHS
Units: Percentage change compared to month t = –1 (positive exchange-rate response in lower right panel indicates depreciation).
Notes: “international” and “domestic” denote the international and domestic portfolios of central banks, “rate” is the discount rate of central banks, and “x” the exchange rate on London.
Sources: Own calculations based on sources as described in the main text and the Online Appendix.

What were the balance sheet effects? As core countries offered (almost) unconditional and unlimited convertibility, the international portfolio declines quickly and substantially: 1.8 percent after one month.Footnote 16 Yet core countries dilute the impact of this reserve drain by expanding domestic credit. The reaction of the domestic portfolio is, in percentage terms, more than three times larger than the reaction of the international portfolio, namely 5.5 percent after one month. As the international portfolio was on average twice as large as the domestic portfolio, it was thus necessary to increase the domestic portfolio in absolute numbers by more than the decline of the international portfolio.
Adjustment operates quickly, with the exchange rate and central banks’ balance sheet responses becoming statistically insignificant after three to four months. This short-term adjustment is consistent with the high level of financial integration that characterized the gold standard era. It also means that we would not be able to capture adequately the role of central banks as shock absorbers if we worked with quarterly or annual data.
Our results can contribute to the debate on foreign exchange intervention, if we separate the series “international portfolio” into its components, namely “metallic reserves” (time series 1) and “foreign exchange” (time series 2 and 3, i.e., “foreign paper” plus “foreign funds”). In line with the literature that has studied such interventions in core countries (see in particular Jobst (Reference Jobst2009) on Austria and Ugolini (2012) on Belgium), we observe a very strong response of foreign exchange assets. For the three out of five core countries for which we have monthly data on foreign exchange for the entire period (Belgium, Austria, and the Netherlands), Figures A1a, A1b, and A1c (reproduced in the Online Appendix) document the systematic use of foreign exchange interventions. We also find that the response of the “metallic reserves” (gold stock) is still negative and significant (except in the case of Belgium), but that the response of foreign exchange assets is far larger. As results are expressed in percentage change, a stronger response of foreign exchange is partly explained by the fact that the gold stock was larger than the stock of foreign exchange reserves in these central banks (83 percent of the total international portfolio on average). The absence of gold outflows in Belgium is consistent with the fact that foreign exchange assets constituted a much larger share of total international assets in this country (about half) and the National Bank of Belgium was able to rely on liquid and well-developed local markets so that it could actually deploy sophisticated foreign exchange interventions.
The Gold Standard Periphery: Imperfect Convertibility
Countries on the gold standard periphery react fundamentally differently to core countries along all four dimensions (Figure 2), yet the most striking difference relates to the absence of immediate reaction in the international portfolio in the periphery. For the first four months, results are not statistically different from zero at the 5 percent level. This quantitative finding confirms the qualitative statement of Martín-Aceña, Martínez-Ruiz, and Nogues-Marco (Reference Martín-Aceña, Martínez-Ruiz, Nogues-Marco, Ögren and Øksendal2012) on the absence of gold convertibility on the periphery, which—to the best of our knowledge—has never been assessed econometrically. Distinguishing in the international portfolio between foreign exchange and gold does not change the results. The responses of both types of assets are not significant (Figure A-2 in the Online Appendix).Footnote 17
This is accompanied by a sharper and longer reaction in the exchange rate. The exchange rate on the periphery depreciates not only by 70 percent more than in core countries, but it does not bounce back after month one. It remains at depreciated levels for several months instead. Imperfect convertibility allows peripheral countries to let the exchange rate depreciate more strongly than under the scenario of perfect convertibility between gold and domestic currency. Core countries could not afford such a depreciation, as gold points were narrow between Europe’s financial centers and their commitment to convertibility beyond doubt.Footnote 18
The response of the interest rate and the domestic portfolio reveals differences and similarities to core countries. As in the core countries, the discount rate reacts significantly to the English shock, but smaller (0.17 percent after one month, compared to 0.24 percent for the core) and in a protracted fashion (as opposed to an immediate re-bounce for the core countries). Second, the central bank’s domestic portfolio increased, although there was no loss of foreign reserves in the central bank. Therefore, after an increase in international interest rates, the national central bank had to extend credit to the domestic economy in response to the commercial banks’ demand at its discount window (Bloomfield Reference Bloomfield1959; Bazot, Bordo, and Monnet Reference Bazot, Bordo and Monnet2016). This finding means that there was still a transmission of the English interest rate increase to the domestic money market in the periphery, so that it became cheaper to borrow from the central bank than from the private market. Restrictions on gold convertibility could protect the central bank’s cover ratio (ratio of reserves to banknotes) and widen the exchange rate range, but they were not sufficient to completely isolate the country from international financial markets (as shown by the fact that the exchange rate fluctuates). An increase in domestic loans was still necessary to maintain the domestic interest rate stable, but of a lower order of magnitude than in the core countries.
In sum, peripheral countries were able to shelter from the global cycle by potentially imposing capital controls. This deviation from a central pillar of the gold standard made their adherence less credible (Mitchener and Weidenmier Reference Mitchener and Weidenmier2015)—or, vice versa, low credibility forced them to impose restrictions on gold convertibility—but it did allow them to combine quasi-fixed-exchange rates (albeit with larger bands) with a certain level of monetary policy autonomy.
Incidentally, comparisons between all four core vs. periphery responses help explain why peripheral gold standard countries limited convertibility. Core countries raise their discount rates fast and sizeably (although much less than the BoE), bringing in foreign funds quickly given high levels of financial integration between Europe’s main financial centers. Adjustment was further helped by private agents who deemed the core countries’ adherence to gold credible and bought domestic currency when it was “cheap”, that is, depreciated within the gold points (Bordo and MacDonald Reference Bordo and MacDonald2005). By contrast, lower levels of financial integration and reduced credibility meant that the discount rate was a less sharp weapon for peripheral countries. This, in turn, created a reliance on—partial or complete—inconvertibility to make the gold standard work in this set of countries. Practice differed between countries (see Bloomfield (Reference Bloomfield1959) and Ford (Reference Ford, Mathias and Pollard1989) for a review of gold devices), but immediate and unlimited convertibility remained a characteristic of the peripheral countries until the end of the classical Gold Standard period (Martín-Aceña, Martínez-Ruiz, and Nogues-Marco Reference Martín-Aceña, Martínez-Ruiz, Nogues-Marco, Ögren and Øksendal2012; Morys Reference Morys2013, Reference Morys2014, Reference Morys2017).
It might well be that the benevolent combination documented here was more readily available in the post-1890 environment of a mildly inflationary gold standard (as opposed to the deflationary pressures of the 1870s and 1880s), which coincides with our dataset. Such a view is consistent with the observation that only then do we see large numbers of peripheral countries joining gold. Be this as it may, for the quarter century analyzed here peripheral countries found an institutional adaptation of the gold standard that suited their needs and enabled the countries to make the external constraint more bearable to them (in the same vein Morys (Reference Morys2013)).
Floating Exchange Rates
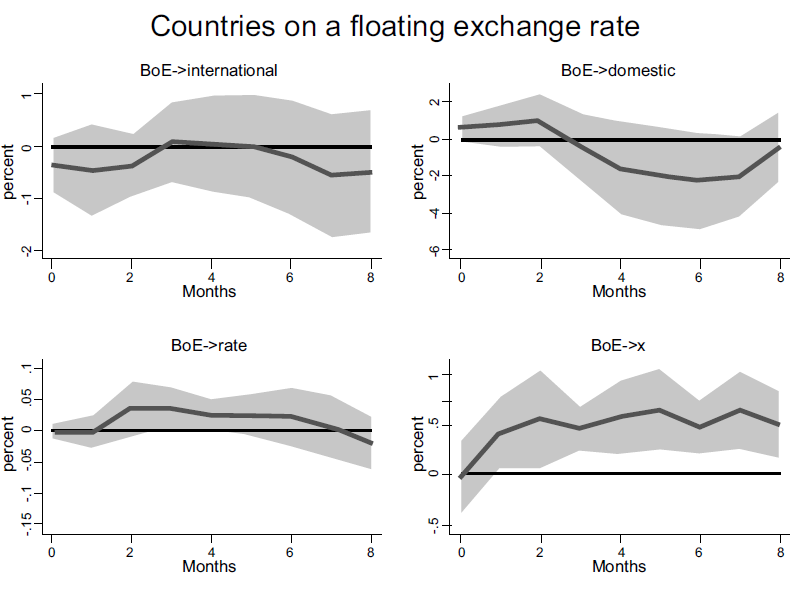
In line with the predictions of the trilemma (Obstfeld and Taylor Reference Obstfeld and Taylor2004), countries that are not on gold simply float their exchange rate in response to an international shock, as shown in Figure 3. Only the exchange rate response is statistically significant, but this particular variable reacts more strongly by a wide margin than in gold standard countries. It falls 0.45 percent in month one, which is approximately five times as much as in core countries and three times as much as in peripheral countries on gold; and the exchange rate remains at depreciated levels thereafter. In floating countries, the burden of adjustment is borne entirely by the exchange rate, so that the central bank exhibits no statistically significant reaction either in its discount rate or on its balance sheet.Footnote 19
THE REACTION OF CENTRAL BANKS IN FIAT STANDARD COUNTRIES TO AN ENGLISH DISCOUNT RATE SHOCK OF 100 BASIS POINTS IN THE FIRST EIGHT MONTHS
Units: Percentage change compared to month t = –1 (positive exchange-rate response in lower right panel indicates depreciation).
Notes: “international” and “domestic” denote the international and domestic portfolios of central banks, “rate” is the discount rate of central banks, and “x” the exchange rate on London.
Sources: Own calculations based on sources as described in the main text and the Online Appendix.

The United States of America
The most important country without a central bank during this period was the United States. It was on the gold standard, although this system was more contested than in most other countries, and political support for bimetallism remained strong until the 1896 U.S. presidential election. A large number of studies have examined what could have happened to the U.S. economy if a central bank had existed before 1913. There is consensus that a central bank would have smoothed seasonal fluctuations in credit and interest rates (Mankiw and Miron 1986) and perhaps reduced the frequency of banking crises (Davis, Hanes, and Rhode Reference Davis, Hanes and Rhode2009; Hanes and Rhode Reference Hanes and Rhode2013; Bordo and Wheelock Reference Bordo, Wheelock, Michael and Roberds2011). However, precise comparisons with central bank operations over the same period remained limited due to the lack of data.
A simple extension of our previous analysis is to compare the reaction of the U.S. economy to that of countries with a central bank. The United States had no central bank, so the Treasury was responsible for backing banknotes in circulation with gold.Footnote 20 A more difficult choice relates to what constitutes a “domestic portfolio.” On some level, there simply was no domestic portfolio, as there was no U.S. institution with a discount portfolio and short-term advances on securities. Excluding this variable altogether might be the most straightforward implementation of the idea of comparing the United States to countries with a central bank.
Yet, while the United States did not have a European-style domestic portfolio, we cannot conclude from this that the Treasury did not perform some proto-central bank functions.Footnote 21 To illustrate this point, the Treasury placed some of its funds on deposit with commercial banks, increasing them in times of monetary stringency and decreasing them subsequently (Friedman and Schwartz Reference Friedman and Schwartz1963, pp. 149–52). Such activities of the Treasury became a more regular feature after the turn of the century, with some contemporaries wondering whether the Treasury might one day act as a central bank (a discussion cut short by the 1907 American Banking Crisis, which eventually paved the way for the establishment of the Federal Reserve System in 1913).
We steer a middle ground. In our baseline estimations, we use the time series for deposits of the U.S. Treasury in national banks as a domestic portfolio,Footnote 22 while noting that this time series is of much smaller magnitude than the domestic portfolio in all other cases. For the United States, the ratio relative to the international assets was 33 percent, while it was 92 percent for gold standard countries with a central bank.Footnote 23 The size alone raises serious doubt as to the Treasury’s capacity to act as a central bank. Yet, including the data are the only way of answering this important question. We perform the U.S. estimations without a domestic portfolio altogether as a robustness check and reproduce them in the Online Appendix (Figure A-4). Results remain unchanged qualitatively.
Another delicate choice concerns the relevant U.S. market interest rate that we should compare with counterparts in countries with a central bank, namely commercial paper (baseline results) vs. call money (Online Appendix). As already discussed by contemporaries (Roulleau Reference Roulleau1914, pp. 159–62), the most appropriate rate to compare with European discount rates is the interest rate on 60–90 day commercial paper in New York. We collected end-of-the-month values of this rate from the Commercial and Financial Chronicle.Footnote 24
Alternatively, we perform the same analysis using the call money rate in New York (Online Appendix Figures A5, A6, and A7), since several authors argue that it relates to a wider market and is more representative of U.S. financial conditions (Hanes and Rhode Reference Hanes and Rhode2013).Footnote 25 This money market rate was not an interbank rate, but the rate of overnight loans from banks to stock market brokers.
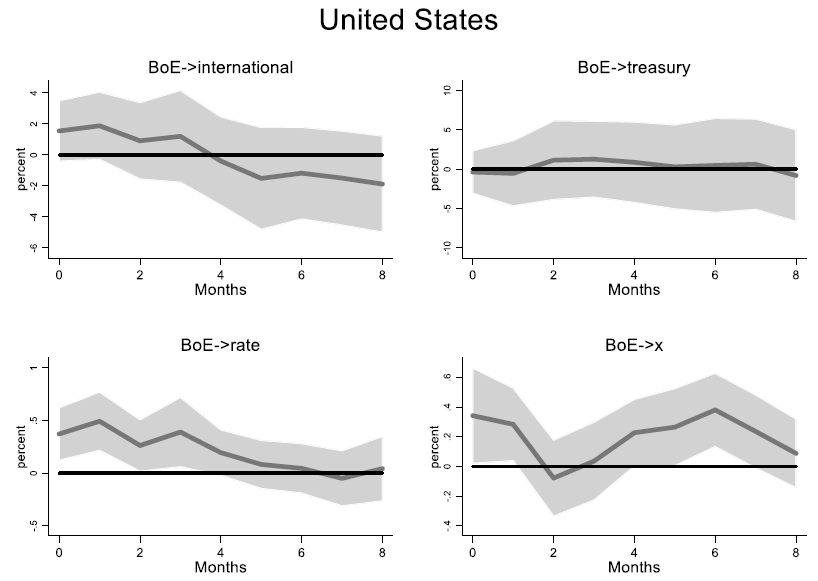
Figure 4 presents the results of local projections with U.S. data, from January 1891 to December 1913. The only variable reacting in a statistically significant way is the interest rate. Note that the interest-rate pass-through is much higher than in gold standard countries with a central bank: approximately twice as high as in core countries (0.49 percent after one month compared to 0.24 percent) and thrice as high as in peripheral countries (0.49 percent compared to 0.17 percent). Put differently, the United States is closest to scenario 1 outlined previously (playing by the rules of the game), as a sizeable domestic portfolio—a key adjustment factor for gold standard countries with a central bank—cannot come to the rescue in the absence of a central bank. In countries with a central bank, the central bank discount rate was an upper limit for the money market rate, since banks could always borrow from the central bank if it was cheaper. In the absence of such an upper limit, the U.S. money market rate was much more responsive to international shocks.Footnote 26
THE REACTION OF THE U.S. MONETARY SYSTEM TO AN ENGLISH DISCOUNT RATE SHOCK OF 100 BASIS POINTS IN THE FIRST EIGHT MONTHS
Units: Percentage change compared to month t = –1 (positive exchange-rate response in lower right panel indicates depreciation).
Notes: “international” denotes the gold reserves of the U.S. Treasury, “rate” is the commercial paper rate in New York, and “x” the exchange rate in New York on London.
Sources: Own calculations based on sources as described in the main text and the Online Appendix.

A direct comparison of the response of the Treasury deposits at national banks with the response of the domestic portfolios of all other gold standard countries is instructive. Figures 1 and 2 show statistically significant responses of the domestic portfolio, larger in absolute number than the outflows of gold and foreign exchange. By contrast, there was no systematic pattern to the Treasury response, hence the statistically insignificant response. Whatever the Treasury might have done exactly, it did not provide the “sheltering” function assigned to the central bank by Polanyi in the quotation given at the beginning of this paper. Before the establishment of the Federal Reserve System in 1913, the U.S. monetary system lacked such a “cushion” (Polanyi) and in turn relied more strongly on the interest rate.Footnote 27 Our finding also supports the claim of the economic historian Alec Ford (Reference Ford, Mathias and Pollard1989, p. 209), who, based on his knowledge of central bank operations rather than on quantitative evidence, claimed that “[i]n those economies with no central bank, commercial banks could react in a similar way by raising their lending and borrowing interest rates [when confronted with a decline in international reserves] […] Such institutions had less discretion than central banks, and indeed, were more wholehearted followers of the rules of the game.”
The quick and sizeable response of the interest rate in the U.S. case also explains why neither the international portfolio nor the exchange rate react in a statistically significant way: adjustment is borne almost exclusively by the interest rate.Footnote 28 This finding is consistent with Officer (Reference Officer1986), who found the exchange-rate adjustment between London and New York in the time period 1890–1908 to be efficient and extraordinarily quick.
Our Results and the Target Zone Literature
While the recent literature (Bordo and MacDonald Reference Bordo and MacDonald2005) has highlighted a considerable degree of monetary autonomy through a target zone mechanism similar to Krugman (Reference Krugman1991), this article proposes an additional channel. Following Krugman’s seminal work, several authors have demonstrated that the target zone mechanism was not incompatible with foreign exchange interventions, or even aided by it (Svensson Reference Svensson1992; Flandreau Reference Flandreau1998; Flandreau and Komlos Reference Flandreau and Komlos2006). We build on this and show econometrically that some gold standard countries systematically implemented foreign exchange interventions (Figures A-1a, A-1b, and A-1c in the Online Appendix).
We add to this important body of research by highlighting the role of central banks’ domestic portfolios, an issue on which the target zone literature remains largely silent. We provide evidence of a strong reaction of the central bank’s balance sheet to international shocks in countries that adhered to the gold standard. Only in countries off gold, the exchange rate was the sole variable to react. The comparison with the United States shows that having a central bank made a difference.
While different in theory, target zone mechanism and balance sheet policies often complement each other in practice. Expectations might have hastened the return to parity in core countries, in addition to the decrease in foreign assets. Studying the Austrian case, Flandreau and Komlos (Reference Flandreau and Komlos2006) show, theoretically and empirically, how expectations of a return to the center parity made foreign exchange interventions more effective. This mechanism might, in the context of our calculations, explain why we observe a faster return to parity in core countries, whose peg was more credible than in the periphery. Yet, credibility itself might be reinforced by exchange rate interventions. Empirically it is thus difficult to distinguish between the two effects on the exchange rate movements, as already recognized by Svensson (Reference Svensson1992).
Our Results and the Alternative Hypothesis of Credit Rationing
Another clarification is in order. So far, we have interpreted the absence of large changes in the central bank discount rate and the positive response of the domestic portfolio as evidence that the central bank balance sheet sheltered the domestic economy from international shocks. However, instead of raising their discount rate, central banks may have responded to the shock by rationing credit and thus expected that a decrease in aggregate demand would stabilize the exchange rate.
At first sight, our results appear inconsistent with the alternative hypothesis of credit rationing given the positive response of the domestic portfolio. Yet it is possible that while domestic loans increased, they did not increase to the level of demand for domestic loans, which would constitute credit rationing. In this scenario, the buffer role of the central bank might have been limited or even completely absent, and we should expect a negative impact on real economic variables (or proxies thereof that are available at monthly frequency, such as specific asset prices).
In order to address this important concern,Footnote 29 we have collected monthly stock market indices, which constitute a good proxy for both financial and real domestic economic conditions. To our own surprise, we were able to obtain such data only for Belgium, France, Germany, Italy, Portugal, Russia, Sweden, and the United States. Fortunately (and given that Italy and Russia appear twice as they switched from floating to fixed currencies), we can cover groups one, two, and three with three countries each (group four, by design, only contains the United States). Data sources are presented in the Online Appendix.
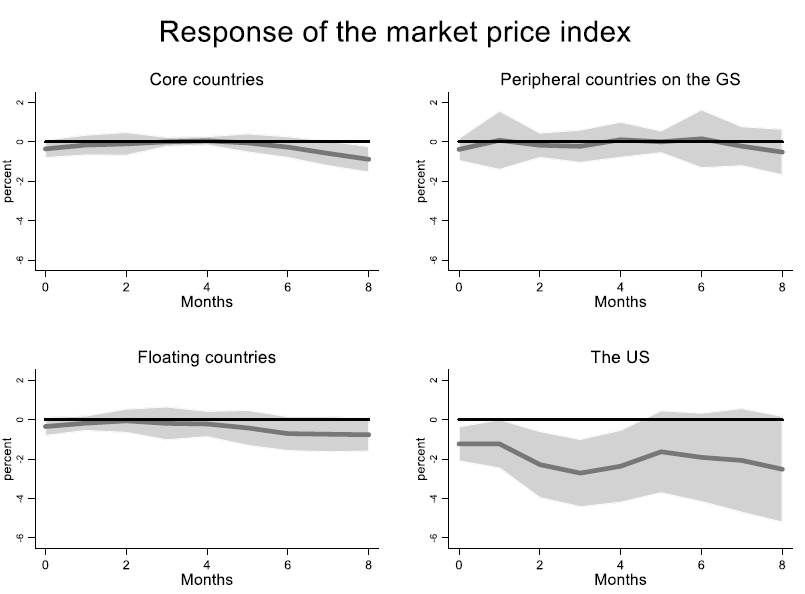
The responses of asset prices are consistent with our previous results and interpretation (Figure 5). In all countries with a central bank, we do not observe a significant response of asset prices to a rise in the BoE discount rate (and the central estimate is small). By contrast, the New York stock market reacts strongly to the BoE shock. At the 95 percent level, results are significant at the time of the shock and two to three months afterward (at a 90 percent confidence level, results are statistically significant continuously for six months). This dichotomyFootnote 30 supports our main result, namely that central banks were able to act as a buffer, whereas in the absence of such an institution, the global financial cycle impacted on the domestic economy.
THE REACTION OF THE STOCK MARKET INDEX TO AN ENGLISH DISCOUNT RATE SHOCK OF 100 BASIS POINTS IN THE FIRST EIGHT MONTHS
Units: Percentage change compared to month t = –1.
Sources: Own calculations based on sources as described in the main text and the Online Appendix.

DISCUSSION OF REVERSE CAUSALITY AND ROBUSTNESS CHECKS
Two issues could potentially undermine the identification and the results presented in the previous section: omitted variables and reverse causality. We first discuss why we do not think that these are important threats to our estimation method. Second, we present a series of robustness checks that address these two concerns through econometric methods (control variables and identification based on a narrative approach). Third, we perform an additional robustness check for our results in the United States, based on an alternative narrative approach.
Arguments Based on Historical Narrative
Omitted variable bias occurs if the BoE rate reacts only to short-term shocks or cycles that are common to all countries. However, the high frequency of BoE rate changes does not suggest systematic simultaneity with global economic cycles and the policies of other central banks. During this period, the BoE changed its rate every two months on average, while, for example, the Bank of France—the second most important central bank—changed its rate once a year (Bazot, Bordo, and Monnet Reference Bazot, Bordo and Monnet2016). Furthermore, if relative purchasing power parity holds under the gold standard and BoE rate changes are linked to a global cycle in inflation rates, we should not observe a deviation of the exchange rate from mint parity: inflation and nominal interest rates should evolve in a similar way across gold standard countries, and the exchange rates remain fixed. Results in Figures 1 and 2 showed the contrary and should be interpreted as evidence that—at least in the short term—exchange-rate movements were driven by financial arbitrage rather than a global cycle.
As for reverse causality between central bank policy decisions, several authors have shown that the BoE was the first to move its rate among central banks (Lindert Reference Lindert1969; Eichengreen Reference Eichengreen1987; Morys Reference Morys2013; Bazot, Bordo, and Monnet Reference Bazot, Bordo and Monnet2016). Archival evidence on the days of discount rate changes (as gathered during our research) further supports the idea of a central bank time-tabling with an implicit hierarchy where London always met first. A change in the interest rate of the BoE was not sufficient to lead to changes in the rates of other central banks. But it typically precedes them.
Statistical Robustness Checks
In order to address these two issues with econometric techniques, we propose two robustness checks.
First, we include several additional variables in the estimations to control for potentially omitted variables, namely global cycles in prices, and economic or financial activity. For this period, monthly indices of economic activity are usually unavailable; exceptions are the English price index and a widely-used proxy of English domestic activity based on railway freight receipts constructed by Goodhart (Reference Goodhart1972). Furthermore, we use the stock market index in London as a measure of the financial cycle.Footnote 31 If there was any global cycle, it should be reflected in English macroeconomic and financial variables. Based on annual data, Morys and Ivanov (Reference Morys and Ivanov2015) provided new evidence that the English cycle was as close as possible to a global cycle during this period. In addition, we also control for English gold reserves, which might capture a global cycle in the gold supply. If the BoE reacted to a global shortage of gold (decreasing the gold stock of all central banks, including its own), we would over-estimate the reaction of gold reserves of other countries to an English interest rate shock.
Second, we address the reverse causality issue by using the exogenous measure of English monetary policy during the gold standard constructed by Lennard (Reference Lennard2018) following a narrative approach. Lennard (Reference Lennard2018) follows the seminal study of Romer and Romer (Reference Romer and Romer2004) by identifying the information set of the board members of the BoE based on a reading of transcripts of meetings. He then purged the BoE discount rate from the relevant information on expected economic changes that was available to policymakers at the time of decision making. The residuals identified at a decision-by-decision frequency are transformed into a monthly series by matching the shock with the month in which it occurred and summing shocks in months with multiple decisions. Among the 13 variables in the information set used by Lennard, some are domestic (stock prices, wheat prices), while others are international (gold reserves and exports, French and German discount rates and exchange rates, U.S. exchange rate).
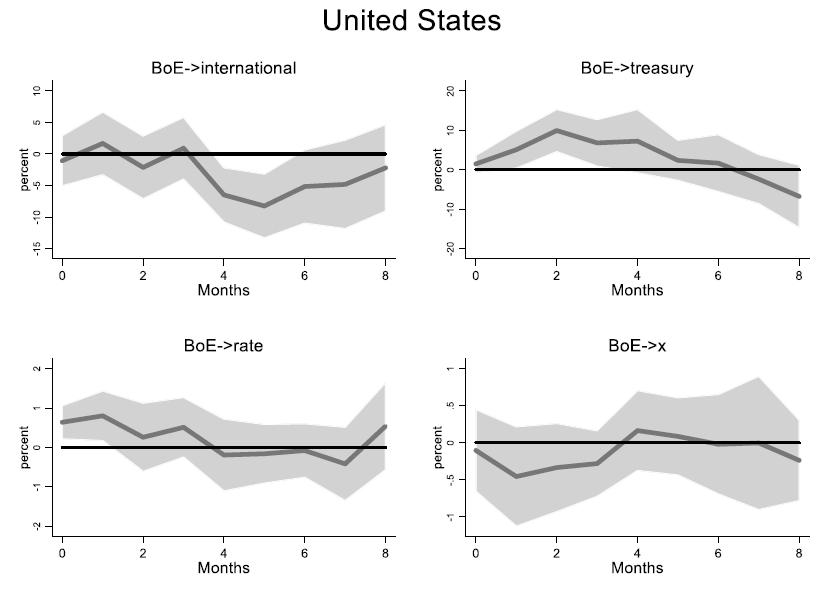
None of these two robustness tests change our previous conclusions, whether we introduce them separately or together. The only significant difference with our previous results concerns the United States in that it actually strengthens them. Thus we report here the new results for the United States only (Figure 6), while results for other countries are available in the Online Appendix (Figures A-9, A-10, and A-11). The effect of the English shock (1pp) on the U.S. interest rate is significantly stronger than in the benchmark estimate: 0.80pp after one month in Figure 6, compared to 0.49pp in Figure 4. Taking endogeneity into account leads to different results in the case of the United States only. The higher frequency of financial crises in the United States could explain why the endogeneity bias is stronger in this case: the BoE rate “overreacted” to changes in New York money market rates during such rare events.Footnote 32
THE REACTION OF THE U.S. MONETARY SYSTEM TO AN ENGLISH DISCOUNT RATE SHOCK OF 100 BASIS POINTS IN THE FIRST EIGHT MONTHS. ALTERNATIVE MEASURE BASED ON LENNARD (Reference Lennard2018) AND ENGLISH CONTROL VARIABLES INCLUDED
Units: Percentage change compared to month t = –1 (positive exchange-rate response in lower right panel indicates depreciation).
Notes: “international” denotes the gold reserves of the U.S. Treasury, “rate” is the commercial paper rate in New York, and “x” the exchange rate in New York on London.
Sources: Own calculations based on sources as described in the main text and the Online Appendix.

We conducted an additional robustness check considering the specific case of the United States. The endogeneity issue is of particular concern in the case of the United States because this country experienced an unusual number of banking panics between 1890 and 1913, which impacted the English economy and pushed the BoE to increase its interest rate (Jeanne Reference Jeanne1995; Neal and Weidenmier Reference Neal, Weidenmier, Michael, Alan and Jeffrey2003; Hanes and Rhode Reference Hanes and Rhode2013). For this reason, Green (Reference Green2018) has built a specific measure of English monetary decisions that were unaffected by U.S. events. Based on the archives of the board meetings of the BoE, she identifies all discount rate changes motivated by a change in U.S. economic and financial conditions. Building on her work, we construct a discrete variable equal to 1 when BoE interest rate changes are exogenous to the U.S. economy and positive and –1 when they are negative. We then use this variable as an instrument to predict the series of actual BoE rate changes (see Jordà, Schularick, and Taylor Reference Jordà, Schularick and Taylor2020 for a presentation of IV in local projections).Footnote 33 Results using exogenous Green shocks are consistent with those in Figure 6 using exogenous Lennard shocks (Online Appendix Figure A-12). The effect of the English shock (1pp) on the U.S. interest rate after one month is larger (0.61) than in our benchmark and increases steadily to 0.98 after four months.Footnote 34
CONCLUSIONS
This article challenged the widespread view that central banks did not enjoy autonomy during the classical gold standard (1870s–1914), the paradigmatic historical regime combining capital mobility and fixed exchange rates. Central banks were able to avoid raising interest rates as much as in the leading country in the system (England), as they could use their balance sheets to cushion the impact of the international shock. In core countries, the decrease in central bank international assets (gold and foreign exchange) stabilized the exchange rate, while the increase in central bank loans to the domestic economy was crucial in keeping the policy interest rate stable. In peripheral countries, where adherence to the gold standard was less credible, the expansion of central bank loans to the domestic economy was coupled with the extensive use of restrictions on gold convertibility. In so doing, central banks could avoid reaching the corner of the trilemma.Footnote 35 In the absence of a central bank, the U.S. economy was more exposed to negative financial shocks from abroad. Our argument finds some precedent in the work of Polanyi (1944), Bloomfield (Reference Bloomfield1959), and Ford (Reference Ford1962, Reference Ford, Mathias and Pollard1989), but no study has ever provided a comprehensive analysis of short-term movements in central bank balance sheets and monetary policy autonomy during the first era of globalization. In the absence of such a quantitative investigation, there were many doubts as to why the policy interest rates were quite detached from the movement of the English bank rate. We were able to close the gap in the literature thanks to the chance discovery of the balance sheets of all central banks at the time in the archives of the Bank of France.
We anticipate at least three important areas of further research based on these findings. First, by showing that central banks made the constraint of international finance less binding in practice than in theory, our results shed new light on the historical co-evolution of central banks and fixed exchange-rate regimes. Until 1913, the United States illustrated the cost of a fixed-exchange rate without a central bank. On the other hand, we show that for peripheral gold standard countries with a central bank, the cost of the fixed-exchange rate was relatively low compared to the full autonomy enjoyed in floating countries. This finding invites a comparison with the second half of the twentieth century. Given the theoretical appeal of floating, the persistence of pegs is sometimes portrayed as surprising, or even in contradiction to the global spread of central banks, which would cherish most the monetary autonomy associated with floating (Ilzetzki, Reinhart, and Rogoff Reference Ilzetzki, Reinhart and Rogoff2019). Our results suggest otherwise: central banks and fixed-exchange rates complement rather than contradict each other.
Second, our conclusion can in principle be applied to a monetary union with a single monetary policy (interest rate) but with decentralized central bank operations (i.e., several central bank balance sheets), as is the case in the euro area. We pursue this comparison in a companion paper, showing how the domestic loans of national central banks are key to keeping national lending rates in line with the single euro area policy rate (Bazot, Monnet, and Morys Reference Bazot, Monnet, Morys, Castañeda, Roselli and Geoffrey2020). A corollary of this comparison is that settlements between euro area countries (the TARGET 2 system, see Eichengreen et al. (Reference Eichengreen, Mehl, Chitu and Richardson2015)) are akin to central bank international assets during the gold standard, and last resort capital controls within the monetary union are equivalent to imperfect convertibility.
Third, this paper focuses on the paradigmatic case of capital mobility and a fixed exchange-rate regime in history, but the same empirical method can be applied to other periods, including today, as long as central bank balance sheets and exchange rate series are available at a high frequency. A key question that follows from our work is: why did central banks manage to play their shock-absorbing role during the classical Gold Standard but are less successful in doing so today? The recent work of Jordà et al. (2019) suggests that the answer may be that the integration of money and stock markets was considerably lower during the first era of globalization, rendering the global financial cycle less powerful and hence easier to counteract by domestic policies. However, if this integration is itself endogenous to central bank policy, this answer might not be complete and a deeper understanding of central bank policies over the long run is needed.