





1. Introduction
Rotating convective flows can be found in many geo- and astrophysical systems, such as in the Earth's oceans and inside the Sun. Certain essential features of these flows can be captured by the widely studied model system, the rotating Rayleigh–Bénard convection (RRBC), where a rotating fluid layer is heated from below and cooled from above. This system is controlled by several control parameters, i.e. the Rayleigh number  $Ra=\alpha g{\rm \Delta} T \,H^3/(\nu \kappa )$, the Rossby number
 $Ro=(\alpha g {\rm \Delta} T \,H)^{1/2}/(2\varOmega H)$ (or the Ekman number
 $Ek=\nu /(2\varOmega H^2)$), the Froude number
 $Fr=\varOmega ^2R/g$, the Prandtl number
 $Pr=\nu /\kappa$ and the diameter-to-height aspect ratio of the flow domain
 $\varGamma =2R/H$. Here,
 ${\rm \Delta} T$ is the temperature difference across the fluid layer,
 $\varOmega$ is the rotation speed antiparallel to gravity
 $g$, and
 $\alpha$,
 $\nu$ and
 $\kappa$ are the thermal expansion coefficient, the kinematic viscosity and the thermal diffusivity of the working fluid, respectively.
There is an interesting phenomenon observed in the solar system, that is, the rotation speed of a planet increases with its planetary mass (Hughes Reference Hughes2003). Thus, for some low-mass planets, their slow rotation makes the centrifugal force peripheral. For example, the Froude number for the Earth is only  $3.46\times 10^{-3}$. However, for the massive Jupiter, its fast rotation can result in a Froude number as large as
 $0.1$ (Kaspi et al. Reference Kaspi2018). More interestingly, it appears that this ‘speed–mass’ relation can be extrapolated to very massive extrasolar planets (Snellen et al. Reference Snellen, Brandl, de Kok, Brogi, Birkby and Schwarz2014), implying that the centrifugal effects on these supermassive planets would be even more significant. However, the centrifugal effects are largely unknown even in the idealized RRBC system, not to mention those in supermassive stars or planets.
The centrifugal force changes the RRBC problem in a fundamental way. It breaks the horizontal translation invariance and the top-down symmetry of the RRBC system. It induces a meridional large-scale flow irrespective of how small the imposed vertical temperature difference is, which is unlike the case without centrifugal force, where the flow motion is postponed by rotation according to  $Ra_c=8.7Ek^{-4/3}$ (Chandrasekhar Reference Chandrasekhar1981). Here,
 $Ra_c$ is the onset Rayleigh number, above which the convective motion sets in. Previous studies of the centrifugal effects in RRBC mainly concern flows at very small
 $Ra$. For example, Lopez, Rubio & Marques (Reference Lopez, Rubio and Marques2006) and Marques et al. (Reference Marques, Mercader, Batiste and Lopez2007) found that the centrifugal force could result in dramatic changes in the quantitative features of the flow bifurcations. Those authors also found that the meridional flow accumulates the hot fluid at the cell centre, resulting in a positive offset of the bulk temperature, which is absent in the case without centrifugal force.
In turbulent RRBC at large  $Ra$, how the turbulent flow is affected by the centrifugal force is far from clear. Even the basic issue concerning when the centrifugal effect starts to manifest itself, or equivalently, what is the onset Froude number
 $Fr_c$, is still unresolved. At very small
 $Ra$,
 $Fr_c$ is estimated to be
 $0.05$ (Marques et al. Reference Marques, Mercader, Batiste and Lopez2007). And in most previous studies on turbulent RRBC, this value of
 $Fr_c=0.05$ is assumed to be a safe threshold to ignore the effects of the centrifugal force (e.g. Zhong et al. Reference Zhong, Stevens, Clercx, Verzicco, Lohse and Ahlers2009; Stevens, Clercx & Lohse Reference Stevens, Clercx and Lohse2013). Recently, a critical Froude number
 $\varGamma /2$ was obtained from a global force balance argument by Horn & Aurnou (Reference Horn and Aurnou2018), which depends only on the geometrical properties of the convection system, and seems to contradict the assumed onset value of
 $0.05$ in turbulent RRBC. However, this critical Froude number
 $\varGamma /2$ concerns when the centrifugal force becomes dominant, rather than when it cannot be regarded as insignificant, which is our definition of onset here, and is also the focus of the present study. In the experiment presented here, we determined the onset Froude number
 $Fr_c$ from the local temperature anomalies of the bulk flow. Our results suggest that, even in the regime of weak centrifugal force (i.e.
 $Fr_c< Fr<\varGamma /2$), the centrifugal effect has become non-negligible, at least for the local dynamics. In this sense, the present work and that of Horn & Aurnou (Reference Horn and Aurnou2018) complement each other.
Very recently, a novel experiment with the convection cell placed off the rotation axis was conducted by some of the present authors to investigate the centrifugal effect at a fixed  $Ra=4.4\times 10^9$ (Hu et al. Reference Hu, Huang, Xie and Xia2021). One of the results from that study is that the convective flows start to bifurcate at an onset Froude number
 $Fr_c\simeq 0.04$, which can be understood in terms of a local force balance and is believed to be applicable to the non-off-centred configuration like in the present work. In this paper, the issue about the onset Froude number in turbulent RRBC is studied more systematically. The onset Froude number
 $Fr_c$, which is obtained from the bulk temperature anomaly, is found to depend on
 $Ra$ as
 $Fr_c\sim Ra^{0.53}$. For
 $Fr>Fr_c$, the centrifugal effect is more pronounced for smaller
 $Ra$, implying that the response of the system to the centrifugal force depends on the flow states. The results of sidewall temperature are consistent with those obtained from the bulk temperature.
2. The experimental set-up and the parameters
The experiments were conducted in a home-built rotating facility (figure 1a). The rotating parts of this facility are supported by a heavy static support desk, which consists of four legs (A $_2$) and top (A
 $_3$) and bottom (A
 $_1$) square plates. The whole facility is levelled to within
 $10^{-4}$ rad by adjusting the four feet B. A bearing D is placed above A
 $_3$ to bear the load. To ensure the high stability of the facility at fast rotation speed, another smaller bearing E is used. All the rotating components are connected together by a stainless-steel tube F, which passes through the central holes of the two bearings and is orthogonal to A
 $_3$ to define the rotation axis of the whole facility. A stainless-steel disk C is connected to this tube by six keys at the upper end. Above this disk is a large aluminium plate L, with a diameter of
 $1500$ mm and a thickness of
 $25$ mm (figure 1b). The convection cell and the auxiliary equipment are seated on L firmly. At the lower end of the tube F is a customized driven timing belt pulley G. The driving force from the motor I is transferred to the driving pulley K through a bevel gearbox J (which has a gear ratio
 $10.1$). The driving (K) and driven (G) pulleys (with gear ratio
 $2.0$) are connected together by a timing belt, which is tensioned by an idler H. The rotation speed of the motor I is controlled by an analogue voltage, which is set digitally.
(a) The home-built rotating table. The various components are described in the text. (b) An overview of the experimental set-up. The home-made thermostat that encloses the convection cell is fixed firmly at the centre of the large aluminium plate L, which in turn is fixed on the stainless-steel disk C shown in panel (a).

The measurements were performed in a cylindrical convection cell with height  $H=194.50$ mm and diameter
 $2R=194.15$ mm. Degassed and deionized water was used as the working fluid. The bottom plate was heated by nichrome wires (with resistance
 $R_0$) and the top plate was cooled by a temperature-regulated circulating bath. The temperature of the hot (cold) plate
 $T_{h}$ (
 $T_{c}$) was monitored by four thermistors, which were placed at the radial position
 $R/2$ and equally spaced azimuthally. A small thermistor was used to measure the bulk temperature
 $T_{bulk}$ at the cell centre. The mean temperature
 $T_m=(T_{h}+T_{c})/2$ was kept at
 $40.0\,^\circ$C during the experiments, and was chosen as the reference temperature to calculate the fluid properties. To measure the sidewall temperatures
 $T_{w}$, thermistors were inserted into blind holes on the sidewall. They were distributed in three horizontal rows with altitudes
 $H/4$,
 $H/2$ and
 $3H/4$ from the bottom plate, and in eight vertical columns equally spaced azimuthally. The convection cell, wrapped by several layers of Styrofoam, was put into a home-made thermostat to minimize the influence of the fluctuating surrounding temperature. The heat transport is quantified by the Nusselt number
 $Nu =q/(k {\rm \Delta} T/H)$. Here,
 $q=U^2/(R_0{\rm \pi} R^2)$ is the heat flux calculated from the voltage
 $U$ applied to the nichrome wires,
 ${\rm \Delta} T=T_{h}-T_{c}$ is the temperature difference across the fluid layer and
 $k$ is the thermal conductivity of water.
The Prandtl number and the aspect ratio were fixed at  $Pr=4.34$ and
 $\varGamma =1$, respectively. The temperature difference
 ${\rm \Delta} T$ varied from
 $1$ to
 $34$ K, and the rotation speed (revolutions per minute) covered the range of
 $6~{\rm rpm} \leq \varOmega \leq 58$ rpm. The corresponding values of
 $Ra$ and
 $1/Ro$ are plotted in figure 2(a). During the experiments, we kept
 $Ra/Ra_c\gtrsim 2$ to make sure that the flow is not laminar (Kunnen Reference Kunnen2021). This limits the parameter ranges covered by the two smallest Rayleigh numbers
 $Ra=2.8\times 10^8$ and
 $5.6\times 10^8$, since at large rotation speed (i.e. at large
 $1/Ro$) they are very close to the onset Rayleigh number
 $Ra_c$ (figure 2a).
(a) The parameters of the present experiments in the phase space of  $1/Ro$–
 $Ra$. The diamonds with different colours correspond to different
 $Ra$. The grey solid lines indicate the four experimental runs with constant
 $1/Ro$ (
 $=21.80$, 14.95, 9.02 and 6.38). The grey dashed line represents
 $Ra_c=8.7Ek^{-4/3}$. (b) The parameters of our measurements in the
 $1/Ro$–
 $Fr$ space according to Horn & Aurnou (Reference Horn and Aurnou2018). The symbols are the same as in panel (a). The vertical grey dashed line represents
 $Fr=\varGamma /2=R/H=0.5$. The red (cyan) dashed lines, corresponding to the largest (smallest)
 $Ra$, indicate the 3-D to QG and the QC to CC transitions, respectively (see text for detailed explanations). The stars are the onset Froude numbers obtained in the present study, which have a power-law behaviour,
 $Fr_c=3.79\times 10^{-7}\,Ra^{0.53\pm 0.04}$ (the black solid line). (c) A division of the various flow regimes in the
 $1/Ro$–
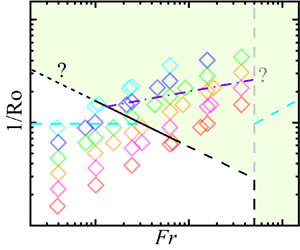
 $Fr$ space based on the present results. The region above (below) the black lines is affected (not affected) by the centrifugal force, and can be divided into several subregimes. The dash-dotted violet line is
 $Ra=6.3Ra_c$ (Nieves, Rubio & Julien Reference Nieves, Rubio and Julien2014). Lines with a question mark are those without strong justification. See § 3 for further explanation of the legend and detailed discussions.

3. Results and discussions
The results will be presented mainly in the  $1/Ro$–
 $Fr$ space to study the centrifugal effect (figure 2b). We first introduce the division of this space given by Horn & Aurnou (Reference Horn and Aurnou2018, Reference Horn and Aurnou2019). This division is based on the competition among three typical time scales, i.e. the Coriolis time scale
 $\tau _{\varOmega }=1/(2\varOmega )$, the gravitational buoyancy (or free-fall) time scale
 $\tau _{ff}=\sqrt {H/(\alpha g{\rm \Delta} T)}$ and the centrifugal buoyancy time scale
 $\tau _{cb}=\sqrt {R/(\alpha \varOmega ^2R {\rm \Delta} T)}$. Specifically,
 $\tau _{ff} \sim \tau _{\varOmega }$ determines the transition from the three-dimensional (3-D) regime to the quasi-geostrophic (QG) regime, i.e.
 $1/Ro_{t1}=A^{-1}Pr^{1/2}Ra^{1/6}$; and
 $\tau _{cb} \sim \tau _{\varOmega }$ separates the Coriolis–centrifugal (CC) regime and the quasi-cyclostrophic (QC) regime, i.e.
 $1/Ro_{t2}=(\varGamma /2)^{-1/2}A^{-1}Pr^{1/2}Ra^{1/6}Fr^{1/2}$. Here, a typical value of
 $5.5$ was chosen for the prefactor
 $A$ as in Horn & Aurnou (Reference Horn and Aurnou2019). The vertical grey dashed line, obtained from
 $\tau _{ff} \sim \tau _{cb}$, indicates the critical Froude number
 $\varGamma /2=0.5$, beyond which (i.e. in the CC and QC regimes) the centrifugal effect becomes dominant. One thus should not expect strong centrifugal effects in the present study. However, as we will show below, once
 $Fr>Fr_c$, the centrifugal force does have some non-negligible effects on the RRBC system. Here, it is important to point out that in principle only three transitional lines can be obtained from the competition among three time scales. Thus, it is actually an assumption in Horn & Aurnou (Reference Horn and Aurnou2018, Reference Horn and Aurnou2019) to use the same criterion
 $\tau _{ff} \sim \tau _{cb}$ to separate the QG and CC regimes.
3.1. The onset of the centrifugal effect
The most prominent effect of centrifugal force is to accumulate hot fluid at the cell centre and spread cold fluid around the sidewall, resulting in an increased bulk temperature  $T_{bulk}$ and a reduced sidewall temperature
 $T_{w}$. In this section, we will use
 $T_{bulk}$ as a proxy to study the onset Froude number
 $Fr_c$. Figure 3(a) plots the deviation of the time-averaged bulk temperature
 $\langle T_{bulk}\rangle _t$ from the mean temperature
 $T_m=(T_h+T_c)/2$ as a function of
 $1/Ro$, which shows similar behaviours for all
 $Ra$. It is seen that
 $\langle T_{bulk}\rangle _t-T_m$ has a plateau at small
 $1/Ro$, and then it starts to increase at large
 $1/Ro$. The value of the plateau is almost the same as the non-rotation one at
 $1/Ro=0$, which, due to the non-Oberbeck–Boussinesq (NOB) effect (Ahlers et al. Reference Ahlers, Brown, Araujo, Funfschilling, Grossmann and Lohse2006), is larger for larger
 $Ra$. A numerical study on the NOB RRBC showed that, at large
 $1/Ro$, the value of
 $\langle T_{bulk}\rangle _t-T_m$ starts to decrease from the plateau as
 $(1/Ro)^{-0.66}$ (Horn & Shishkina Reference Horn and Shishkina2014), which is in contrast to the increased behaviour observed here. This led us to attribute this increased behaviour to the centrifugal force.
(a) Deviations of the time-averaged bulk temperature  $\langle T_{bulk}\rangle _t$ from the mean temperature
 $T_m$ as a function of
 $1/Ro$ for different
 $Ra$. (b) Plot of
 $\langle T_{bulk}\rangle _t/{\rm \Delta} T$ relative to the corresponding non-rotation values as a function of
 $Fr$. Inset: an example showing that the onset Froude number
 $Fr_c$ is defined as the position where a linear fitting meets a base line (grey solid lines). (c) Plot of the so-obtained
 $Fr_c$ values, which shows a power-law behaviour:
 $Fr_c=3.79\times 10^{-7}\,Ra^{0.53\pm 0.04}$ (blue solid line). The left-pointing and right-pointing triangles are
 $Fr_c$ values from Hu et al. (Reference Hu, Huang, Xie and Xia2021) for
 $Ra=4.4\times 10^9$, which are obtained from global heat transport and local temperature measurements, respectively. (d) The data in panel (b) plotted as a function of
 $Fr/Fr_c$. The symbols in panels (a), (b) and (d) have the same meaning. (e) The bulk temperature as a function of
 $Fr$ for four constant
 $1/Ro$ cases.

To see this point more clearly, the normalized bulk temperature as a function of  $Fr$ is displayed in figure 3(b), which is plotted relative to the non-rotation value
 $\langle T_{bulk}(0)\rangle _t/{\rm \Delta} T$ to exclude the NOB effect. It is seen that, with increasing
 $Fr$, this temperature anomaly increases gradually. Moreover, the onset Froude number
 $Fr_c$, at which the enhancement begins, increases with increasing
 $Ra$. To extract
 $Fr_c$ for different
 $Ra$, a linear function is used to describe the enhancement, and
 $Fr_c$ is defined as the position where this linear function meets a baseline, which is the mean value of the temperature deviations at small
 $Fr$ (see the inset of figure 3b). The so-obtained
 $Fr_c$ as a function of
 $Ra$ is shown in figure 3(c), which has a power-law behaviour,
 $Fr_c \sim Ra^{0.53\pm 0.04}$. For comparison, the onset values from Hu et al. (Reference Hu, Huang, Xie and Xia2021) for
 $Ra=4.4\times 10^9$ are also plotted, where
 $Fr_c=0.04$ (left-pointing triangle) and
 $0.05$ (right-pointing triangle) were obtained from the global heat transport and local temperature measurements, respectively. It is seen that the results obtained using the different methods and in different experimental configurations are consistent with each other within experimental resolution. If the temperature deviations are replotted against
 $Fr/Fr_c$, the data are collapsed reasonably well (figure 3d). This self-similarity suggests that the enhancement behaviour is indeed caused by the centrifugal force.
Figure 3(b) shows that, for smaller  $Ra$, the temperature enhancement is larger at the same
 $Fr$ and it also sets in earlier, suggesting that the centrifugal effects are more pronounced for smaller
 $Ra$. From the
 $1/Ro$–
 $Fr$ space in figure 2(b), we notice that the data for the smallest (largest)
 $Ra$ are almost entirely in the QG (3-D) regime. This implies that flows in the QG regime would be affected more easily by the centrifugal force, i.e. the response of RRBC to the centrifugal force depends on the flow states. To see this more clearly, another set of experiments with fixed
 $1/Ro$ are performed. The measured bulk temperature is displayed in figure 3(e). It is seen that, for the cases with
 $1/Ro=6.38$ and
 $9.02$ (in the 3-D regime), the centrifugal effect is hardly present; while for the
 $1/Ro=14.95$ case (close to the QG regime), it can be observed easily. The centrifugal effects become more significant for the largest
 $1/Ro$, which lies completely in the QG regime.
3.2. The effects of centrifugal force on the temperature statistics
Figure 4(a) displays the normalized root-mean-square (r.m.s.) values of bulk temperature  $T_{rms}/{\rm \Delta} T$ for different
 $Ra$. The solid lines are power-law fits,
 $T_{rms}/{\rm \Delta} T=a(1/Ro)^b$. The fitted values of
 $a$ and
 $b$ are listed in table 1. There is no power law for the two smallest
 $Ra$. It is seen that, for
 $1.1\times 10^9 \leq Ra \leq 4.5\times 10^9$, the data points at large
 $1/Ro$ deviate from the power-law behaviour and start to drop. This behaviour was also discussed by Kunnen, Geurts & Clercx (Reference Kunnen, Geurts and Clercx2009), who attributed the decrease of
 $T_{rms}$ at sufficiently strong rotation to the laminarization of the flow, the effect of which was less profound at larger
 $Ra$. It seems that the behaviour of the temperature fluctuation is dominated by the competition between the buoyancy and Coriolis forces, rather than by the centrifugal force. For example, for the largest
 $Ra$, although the background mean flow becomes gradually hotter (figure 3a),
 $T_{rms}$ still follows the power-law behaviour, showing no indication of the centrifugal effect.
(a) The normalized bulk temperature fluctuations  $T_{rms}/{\rm \Delta} T$ for different
 $Ra$. Solid lines are the corresponding power-law fits. See table 1 for the fitting results. (b) The azimuthally and temporally averaged sidewall temperatures
 $\langle T^m_{w} \rangle _{\phi,t}$ (normalized by
 ${\rm \Delta} T$) plotted relative to the corresponding non-rotation values. Here,
 $T^m_{w}$ is the temperature measured at mid-height. (c) The sidewall temperature gradient
 $\delta T_{w}^{bt}$ as a function of
 $1/Ro$. It is normalized by the non-rotation value. (d) The same as panel (c) but plotted as a function of
 $Fr/Fr_c$. The symbols in all panels share the same meaning.

We next study the centrifugal effects on the sidewall temperatures  $T_{w}$. For the two lowest
 $Ra$ (
 ${\rm \Delta} T\leq 2$ K), the ‘heat content’ or the temperature contrast
 $T-T_m$ of the flow near the sidewall is too small to produce reliable temperature signals, since they can be easily affected by environmental temperature fluctuations. Therefore, their results of
 $T_{w}$ are not shown. Figure 4(b) plots the sidewall temperature
 $\langle T^m_{w} \rangle _{\phi,t}$ relative to the non-rotation value
 $\langle T^m_{w} \rangle _{\phi,t}(0)$, which is measured at mid-height and normalized by
 ${\rm \Delta} T$. Here,
 $\langle \cdot \rangle _{\phi,t}$ means azimuthal and temporal averaging. The centrifugal force will spread the cold flow around the sidewall, resulting in a decreased
 $T_{w}$ at large
 $Fr$, as shown in figure 4(b). It can be seen that the decrease begins at a Froude number that is slightly different from
 $Fr_c$. This difference may be attributed to the fact that the sidewall temperatures are azimuthally averaged and low-pass-filtered by the Plexiglas sidewall. At small
 $Fr$, hot fluid can also appear near the sidewall region (e.g. Curbelo et al. Reference Curbelo, Lopez, Mancho and Marques2014); thus azimuthal averaging would delay the decreasing of the averaged sidewall temperature. Also, at small
 $Fr$, the cold flow is weak. The thermistors inside the sidewall actually sense the integrated signal over a finite area of the sidewall. Thus, the in-wall thermistors are not sensitive to the weak cold flow. Only if the flow is cold enough at larger
 $Fr$ can the thermistors in the sidewall detect the cold flow. Both these effects would give rise to a larger onset Froude number detected by the sidewall temperature probes. But at the leading-order level, it can provide a measure of
 $Fr_c$ consistent with that from the bulk temperature.
The fitting results of  $T_{rms}/{\rm \Delta} T=a(1/Ro)^b$ to the data in figure 4(a).

The quantity  $\delta T_{w}^{bt}=2\langle T_{w}^b-T_{w}^t\rangle _{\phi,t}$ in figure 4(c) characterizes the vertical temperature gradient near the sidewall, where
 $T_{w}^b$ and
 $T_{w}^t$ are the sidewall temperatures measured, respectively, at
 $H/4$ (bottom) and
 $3H/4$ (top). It is found that, for
 $1/Ro \lesssim 10$,
 $\delta T_{w}^{bt}/\delta T_{w}^{bt}(0)$ increases with increasing
 $1/Ro$, and this increment is more significant for larger
 $Ra$. These behaviours are consistent with those found in previous studies (Zhong & Ahlers Reference Zhong and Ahlers2010; Weiss & Ahlers Reference Weiss and Ahlers2011), which can be explained by the effects of the secondary flows inside the Stewartson boundary layers near the sidewall (Kunnen et al. Reference Kunnen, Stevens, Overkamp, Sun, van Heijst and Clercx2011; Favier & Knobloch Reference Favier and Knobloch2020; de Wit et al. Reference de Wit, Guzmán, Madonia, Cheng, Clercx and Kunnen2020; Zhang et al. Reference Zhang, van Gils, Horn, Wedi, Zwirner, Ahlers, Ecke, Weiss, Bodenschatz and Shishkina2020). However, with further increase of
 $1/Ro$,
 $\delta T_{w}^{bt}/\delta T_{w}^{bt}(0)$ starts to drop. We attribute this to the centrifugal effects at large rotation speed, which can be seen more clearly when
 $\delta T_{w}^{bt}/\delta T_{w}^{bt}(0)$ is plotted as a function of
 $Fr/Fr_c$ in figure 4(d). It is seen that the drop of
 $\delta T_{w}^{bt}/\delta T_{w}^{bt}(0)$ begins at the onset Froude number
 $Fr_c$. These results thus imply that, when the centrifugal force sets in, the Stewartson layers are destroyed, and the secondary flows are replaced by cold downwelling flows. The temperature of these cold flows becomes more vertically uniform as
 $Fr$ increases, resulting in the decreased temperature gradients near the sidewall.
3.3. The  $Fr_c$ scaling

We now arrive at a position to explain why the response of the system to the centrifugal force is different in different flow regimes. In RRBC, the vertical motion of a fluid parcel can be regarded as free fall since the buoyancy time scale  $\tau _{ff}$ is much less than the thermal/viscous diffusion time scales (Julien et al. Reference Julien, Legg, McWilliams and Werne1996). Similarly, if the centrifugal buoyancy time scale
 $\tau _{cb}^0=\sqrt {l_0/(\alpha \varOmega ^2 R{\rm \Delta} T)}$ dominates within a horizontal length scale
 $l_0$, the horizontal motion within
 $l_0$ can also be regarded as free fall. Then, the onset Froude number
 $Fr_c \sim l_0/H$ can be obtained immediately from the balance
 $\tau _{ff}\sim \tau _{cb}^0$ (Hu et al. Reference Hu, Huang, Xie and Xia2021). This local balance means that just before the vertically moving hot (cold) fluid parcel arrives at, and is annihilated by, the cold (hot) plate (i.e. within the lifetime
 $\tau _{ff}$), the centrifugal force starts to influence its horizontal dynamics.
In RRBC, the competition between Coriolis and buoyancy forces leads to different flow states (e.g. Sprague et al. Reference Sprague, Julien, Knobloch and Werne2006; Nieves et al. Reference Nieves, Rubio and Julien2014; Cheng et al. Reference Cheng, Madonia, Aguirre Guzmán and Kunnen2020; Kunnen Reference Kunnen2021). At small  $Ra/Ra_c$ (i.e. QG regime), the motions of fluid parcels are confined in small vertical columns. Chong et al. (Reference Chong, Shi, Ding, Ding, Lu, Zhong and Xia2020) found that the column's horizontal motion is diffusive, and the ‘mean-free distance’
 $l_0$ between two adjacent columns roughly equals the column's diameter. Only within this ‘mean-free distance’ does the horizontal motion have free-fall features. As
 $Ra/Ra_c$ increases, the distance
 $l_0$ between two columns increases; and when
 $Ra/Ra_c>6.3$ (Nieves et al. Reference Nieves, Rubio and Julien2014), the columns are replaced by fragmented thermal structures, resulting in larger
 $l_0$ (refer to the visualization given in Nieves et al. (Reference Nieves, Rubio and Julien2014)). This is the reason why the onset Froude number
 $Fr_c\sim l_0/H$ increases with increasing
 $Ra$. When
 $Ra/Ra_c$ is large enough to reach the rotation-unaffected regime (i.e. 3-D regime), the horizontal dynamics of a thermal plume under the ‘horizontal gravity’
 $\varOmega ^2R$ is similar to the vertical dynamics under gravity
 $g$. In this case,
 $l_0$ can be as large as the cell's radius
 $R$ (the upper bound). Thus, as shown in figure 2(c), the scaling
 $Fr_c \sim Ra^{0.53}$ can be extrapolated to larger
 $Fr$ until it reaches the value of
 $R/H$ (the black dashed lines). Previous studies (e.g. Sprague et al. Reference Sprague, Julien, Knobloch and Werne2006) have shown that the change of flow structures with increasing
 $Ra/Ra_c$ also depends on other control parameters, which suggests that
 $Fr_c\sim Fr_c(Ra, Ro, Pr, \varGamma )$. To determine the dependence on these parameters, more systematic studies are needed in the future.
Based on the above physical picture, we propose a new division of the  $1/Ro$–
 $Fr$ space in figure 2(c). The whole space can be divided into centrifugally affected (shaded) and unaffected regimes by the black lines, which consist of four parts. The solid line is the experimental result,
 $Fr_c \sim Ra^{0.53}$. And the dashed lines, as explained above, are the extrapolation of this scaling to larger
 $Fr$ until it reaches its upper bound
 $R/H$. As for the dotted line with a question mark at very small
 $Fr$, the same scaling is assumed to apply there without strong justification. The unaffected regime can be still divided into 3-D and QG subregimes, but more attention is needed for the affected regime. The violet dash-dotted line is derived from
 $Ra/Ra_c=6.3$ (Nieves et al. Reference Nieves, Rubio and Julien2014). Above this line is the strong-Coriolis–weak-centrifugal (SCWC) subregime, where the flow structure is columns, and their diffusive motion is affected by the centrifugal force (Noto et al. Reference Noto, Tasaka, Yanagisawa and Murai2019; Ding et al. Reference Ding, Chong, Shi, Ding, Lu, Xia and Zhong2021). If the centrifugal force becomes stronger, a transition to the strong-Coriolis–strong-centrifugal (SCSC) subregime occurs. In this subregime, no single column can be identified. They are squeezed by the strong centrifugal force, and then merge together into a large coherent structure, such as the hot one at large
 $1/Ro$ shown in figure 5 in Horn & Aurnou (Reference Horn and Aurnou2019). Below the dash-dotted line is the weak-Coriolis–weak-centrifugal (WCWC) subregime, in which the columns break down into fragmented thermal structures (i.e. the structures in the plume regime and geostrophic turbulence regime identified in Nieves et al. Reference Nieves, Rubio and Julien2014, for example) and their radial motion is enhanced by the centrifugal force. In the QC subregime, the flow structures are like the thermal plumes in Rayleigh–Bénard convection. In this subregime, except for the vertical free-fall motion under
 $g$, their horizontal motion is also ‘free fall’ in the entire horizontal plane under the ‘gravity’
 $\varOmega ^2R$. The transition line from the QC to the SCSC subregime is the same as that in figure 2(b). We note that there is no convincing argument or solid experimental evidence for the lines with a question mark in figure 2(c). The transitions among these subregimes need further experimental and/or numerical verification.
3.4. The heat transport
In RRBC, there are two popular strategies (Kunnen Reference Kunnen2021) when studying the heat transport. Considering the competition between the Coriolis and buoyancy forces, one can either increase  $1/Ro$ at fixed
 $Ra$ or increase
 $Ra$ at fixed
 $Ek$. For the fixed
 $Ra$ case, one usually studies the reduced Nusselt number
 $Nu_r=Nu(1/Ro)/Nu(0)$ as a function of
 $1/Ro$ (e.g. Kunnen et al. Reference Kunnen, Stevens, Overkamp, Sun, van Heijst and Clercx2011; Stevens et al. Reference Stevens, Clercx and Lohse2013; Horn & Shishkina Reference Horn and Shishkina2014; Weiss, Wei & Ahlers Reference Weiss, Wei and Ahlers2016). There are three regimes, which are separated by an onset and an optimal critical
 $1/Ro$. For the
 $\varGamma =1$ case, Weiss et al. (Reference Weiss, Wei and Ahlers2016) summarized the
 $Ra$ and
 $Pr$ dependences of the optimal state by the following scalings:
 $1/Ro_{max}=21.4Pr^{1.37}Ra^{-0.18}$ and
 $Nu_{r,max}-1=44Pr^{0.80}Ra^{-0.35}$. This implies that the influence of different
 $Ra$ can be eliminated by rescaling the data according to
 \begin{align} \frac{1}{Ro} \rightarrow \frac{1}{Ro^*} =\frac{1}{Ro}\left[\frac{Ra}{Ra_{ref}}\right]^{0.18} \quad\text{and}\quad Nu_r \rightarrow Nu_r^*=(Nu_r-1)\left[\frac{Ra}{Ra_{ref}}\right]^{0.35}+1. \end{align}
Here,  $Ra_{ref}$ is a reference Rayleigh number and we choose it to be
 $Ra_{ref}=9.5\times 10^9$. Indeed, as shown in figure 5(a), the rescaled data
 $Nu_r^*$ for different
 $Ra$ collapse reasonably well. However, the data at large
 $1/Ro$ should be influenced by the centrifugal force.
(a) The rescaled reduced Nusselt number  $Nu_r^*$ as a function of the rescaled inverse Rossby number
 $1/Ro^*$ for different
 $Ra$. See the text for detailed information. (b) Plot of
 $Nu_r$ as a function of
 $Fr$. The symbols are the same as in panel (a). (c) The Nusselt number
 $Nu$ as a function of
 $Ra$ for different
 $1/Ro$. The grey triangles and red stars are from Liu & Ecke (Reference Liu and Ecke1997) with
 $3< Pr <7$ in a rectangular convection cell. The orange triangles are from the numerical work in Julien et al. (Reference Julien, Legg, McWilliams and Werne1996) at
 $Pr=1$, with a horizontally periodic flow domain. The remaining data sets are from the present work, which have power-law behaviours,
 $Nu=ARa^{\alpha }$. The fitted results are listed in table 2, and are compared with those from Liu & Ecke (Reference Liu and Ecke1997) in panels (d) and (e).

Figure 5(b) plots the reduced Nusselt number  $Nu_r$ as a function of
 $Fr$. The centrifugal effects on heat transport were discussed by Horn & Aurnou (Reference Horn and Aurnou2018) based on the exact relation
 $Nu=(2Fr\sqrt {PrRa}/\varGamma )\langle T u_r r \rangle _{V,t}+Pr\langle \|\boldsymbol {\nabla }\boldsymbol {u}\|^2 \rangle _{V,t}+1$. The enhanced horizontal motion due to centrifugal force has two effects on
 $Nu$. The direct effect
 $Nu_{Fr}=(2Fr\sqrt {PrRa}/\varGamma )\langle T u_r r \rangle _{V,t}$ is to reduce the heat transport efficiency, since the hot (cold) fluid with positive (negative) temperature T always has a negative (positive) radial velocity
 $u_r$. The indirect effect, i.e. the dissipation term
 $Nu_{\varepsilon }=Pr\langle \|\boldsymbol {\nabla }\boldsymbol {u}\|^2 \rangle _{V,t}$, depends on flow states. It was found that
 $Nu_{\varepsilon }$ decreases more if the system is more deeply into the QG regime (Horn & Aurnou Reference Horn and Aurnou2018). Thus, at the same
 $Fr$,
 $Nu_r$ decreases more rapidly for smaller
 $Ra$ (i.e. more deeply into the QG regime), as shown in figure 5(b).
Neither of the above-mentioned strategies reveals a well-defined scaling on heat transport, since the competition between Coriolis and buoyancy forces drives the system into different flow regimes. However, there exists a third strategy, i.e. fixing  $Ro$ (Liu & Ecke Reference Liu and Ecke2009). In this strategy, the relative importance of these two forces is constant, which indicates that the flow states are similar when varying
 $Ra$ (Kunnen Reference Kunnen2021). As shown in figure 5(c), the measured heat transport, together with the data from previous studies (Julien et al. Reference Julien, Legg, McWilliams and Werne1996; Liu & Ecke Reference Liu and Ecke1997, Reference Liu and Ecke2009), all exhibit well-defined scalings, i.e.
 $Nu=ARa^{\alpha }$. The fitted exponent
 $\alpha$ and amplitude
 $A$ are summarized in table 2, and are also plotted in figures 5(d) and 5(e), respectively, together with the results from Liu & Ecke (Reference Liu and Ecke1997). In Liu & Ecke (Reference Liu and Ecke1997), the experiment was conducted with relatively low values of
 $Ra$ (from
 $4\times 10^6$ to
 $6\times 10^8$), and all their data showed a
 $2/7$ scaling. In the present study, the upper end of the
 $Ra$ range was extended to
 $\sim 1\times 10^{10}$. As can be seen from the
 $1/Ro=9.02$ case in figure 5(d), the data start to deviate from the
 $2/7$ scaling. We note that the centrifugal force has little effect for the
 $1/Ro=9.02$ case. When pushing
 $1/Ro$ to much larger values (
 $1/Ro=14.95$ and
 $21.80$), the deviation from the
 $2/7$ scaling becomes even larger (figure 5d). This may be due to the stronger centrifugal effects for these two cases. Although it is still rather complex for the fixed
 $Ro$ case, the well-defined power-law scaling can provide a better prediction for the unexplored regions of the parameter space. Thus, fixing
 $Ro$ may be a better strategy when studying the heat transport property of the RRBC system.
4. Conclusions
We have conducted an experimental study in turbulent rotating Rayleigh–Bénard convection (RRBC) to investigate when the effects of the centrifugal force cannot be regarded as insignificant, i.e. the onset Froude number  $Fr_c$. We find that this onset Froude number, which is obtained from the measured bulk temperature anomaly, depends on the Rayleigh number as
 $Fr_c\sim Ra^{0.53}$. For
 $Fr>Fr_c$, we find that the centrifugal effects are more pronounced for smaller
 $Ra$, suggesting that the response of the system to the centrifugal force depends on the flow states. As for the centrifugal effects on the sidewall temperatures, the results agree well with those obtained from measurements made in the bulk, namely, both the mean value
 $\langle T^m_{w}\rangle _{\phi,t}$ and the global wall gradient
 $\delta T_{w}^{bt}$ start to drop at
 $Fr_c$. As for the heat transport in RRBC, our results suggest that fixing
 $1/Ro$ may be a better strategy when extrapolating to the unexplored regions of the parameter space, since the well-defined
 $Nu$–
 $Ra$ scaling can provide a better prediction for the heat transport.
The fitting results of  $Nu=ARa^{\alpha }$ to the data in figure 5(c).

A recent numerical study obtained a critical Froude number  $\varGamma /2$ from a global force balance in turbulent RRBC (Horn & Aurnou Reference Horn and Aurnou2018), which is independent of flow states. This predicted critical value
 $\varGamma /2$ concerns when the centrifugal force becomes dominant in the regime of strong centrifugal force, and thus is different from the onset values obtained here. Our results show that even in the regime of weak centrifugal force (i.e.
 $Fr_c< Fr<\varGamma /2$), the centrifugal effect has become non-negligible, at least for the local dynamics. In this sense, the present work and that of Horn & Aurnou (Reference Horn and Aurnou2018) complement each other.
Finally, we remark that the obtained scaling  $Fr_c\sim Ra^{0.53}$ may be understood qualitatively by the idea of local force balance. The onset Froude number
 $Fr_c\sim l_0/H$ can be estimated from the balance
 $\tau _{ff} \sim \tau _{cb}^0$. The horizontal free-fall distance
 $l_0$ increases when the rotation constraint becomes weaker. Thus, the measured
 $Fr_c$ increases with increasing
 $Ra$. When the rotation constraint is negligibly weak (i.e. in the 3-D regime), similar to the vertical dynamics, the horizontal dynamics under the ‘horizontal gravity’
 $\varOmega ^2R$ can be free fall all over the global scale
 $R$. In this case, the upper bound
 $l_0=R$ can be reached. Based on the above results, the
 $1/Ro$–
 $Fr$ space is redivided in figure 2(c). The measured scaling
 $Fr_c\sim Ra^{0.53}$ separates the entire space into centrifugally affected and unaffected regimes. We further surmise that the centrifugally affected regime could be divided into several subregimes, depending on the relative strength of the Coriolis and the centrifugal forces.
Funding
This work was supported by the National Natural Science Foundation of China (NSFC) (Grant No. 12072144) and the Research Grants Council of Hong Kong SAR (Grant Nos. N_CUHK437/15 and CUHK14302317). Y.-C.X. was supported by NSFC funds (Nos 12002260 and 92152104), a Xi'an Jiaotong University Startup Fund and the Fundamental Research Funds for the Central Universities.
Declaration of interests
The authors report no conflict of interest.



