The Social Security benefit formula is designed to redistribute old age benefits in favor of individuals with low lifetime earnings. Studies using data from the early 1990s for individuals approaching retirement age found the Social Security old age and survivors program did meet that goal. However, Social Security was much less successful in redistributing benefits to families with low lifetime earnings. Three studies (Coronado et al., Reference Coronado, Fullerton and Glass2000; Gustman and Steinmeier, Reference Gustman and Steinmeier2001; Liebman, Reference Liebman, Feldstein and Liebman2002) conducted at roughly the same time on three different data sets found that, when lifetime benefit payments to households were weighed against taxes paid, there was surprisingly little redistribution fostered by Social Security old age and survivor benefits – from families with high lifetime earnings to families with low lifetime earnings.Footnote 1
There are a number of reasons for believing that the redistribution of benefits under Social Security may have changed over time. Perhaps most importantly, since 1992, the labor force participation rate and fraction of women working full time has increased. When women's earnings’ increase the relative value of their spouse and survivor benefits decline. Moreover, they benefit less from the redistributive structure of the benefit formula. At the beginning of the period we examine, own benefits for women accrued disproportionately to members of households with lower earnings. Consequently, spouse and survivor benefits accrued disproportionately to members of higher earning households. As the earnings of women increased over time, if they disproportionately rose in households with higher earnings, at the family level, Social Security would become more redistributive over time.
Of course, there are other changes affecting the value of benefits and taxes since the early 1990s. Social Security rules have been altered, raising the age at which an individual is entitled to full benefits, and thereby effectively reducing the value of Social Security benefits for members of younger cohorts. Moreover, an earnings test is no longer imposed after an individual reaches full-retirement age. In addition, economic variables, including interest rates, wages and productivity, have also changed over time. As interest rates decline, the value of benefits relative to taxes paid increases for members of cohorts nearing retirement age. Family structure has also changed, especially influenced by the increasing frequency of divorce.
The central question is, given the influence of all of these forces, has the redistribution fostered by the Social Security benefit formula changed over time, and if so, by how much has it changed? This study uses data from the Health and Retirement Study (HRS) to estimate the change in redistribution fostered by the Social Security benefit formula. We compare redistribution between two cohorts, members of the original HRS cohort from households with at least one member who was 51–56 in 1992, and members of the Early Boomer cohort, from households with at least one member who was 51–56 in 2004.Footnote 2
For reasons of space, we do not duplicate all the steps taken in our earlier paper where we systematically examined the reasons for differences in distributions at the individual and family levels, including the correlation of earnings between husbands and wives by household income, and the relation of low earnings for women to years worked. In our earlier paper, we also emphasized that once the higher potential earnings of wives who chose not to spend much of their lifetime at work were taken into account, there was virtually no redistribution of benefits among households. Here we do not consider the earnings capacity of wives with limited commitment to the labor market over the life cycle. In both papers, we focus only on redistribution of old age and survivors benefits and do not consider disability insurance, survivor benefits for young children or other such benefits provided by the Social Security system.Footnote 3
Section 1 sets the stage for the analysis. It reviews how Social Security rules work and the differences in labor market activities of cohorts of women in their early to mid-fifties in 1992 and 2004. Social Security measures are computed and compared between the two cohorts in Section 2, focusing on the present values of Social Security benefits and taxes paid. Section 3 then turns to the measures of distribution and redistribution fostered by the Social Security system, contrasting these measures between individuals and families within each cohort, and also between cohorts. In Section 4 we examine the robustness of the findings to changes in the frequency of divorced households and to differences in the interest rate. Section 5 concludes.
1 Framing the problem
The Social Security benefit formula determining an individual's own benefits from that person's own earnings history is designed to be progressive. The Primary Insurance Amount (PIA) is the monthly Social Security benefit that would be received if claimed by the individual at full retirement age. It is calculated from Average Indexed Monthly Earnings (AIME).Footnote 4 For example, for a person turning age 60 in 2004, on an annual basis the PIA, the monthly benefit an individual is entitled to at normal retirement age based on own earnings, replaces 90% of the first $7,344 of average indexed earnings, 32% of the next $36,924, and 15% of remaining earnings up to the covered maximum. Within the same household, the ratio of own benefits to own covered earnings will be greater for a lower earning spouse than for a higher earning spouse.
Spouse benefits are calculated as half of the benefits that the primary earner would receive at full retirement age. If the low-earning spouse is entitled to own benefits that exceed half the benefits of the high-earning spouse, there are no spouse benefits. Survivor benefits are calculated from the full benefit the primary earner would have been entitled to have he or she survived. Only when both spouses have identical earnings histories are there no survivor benefits.Footnote 5 The formula for calculating full benefits may be adjusted to reduce the number of years of earnings counted if the deceased spouse died before reaching full retirement age. Survivor benefits are adjusted from the deceased spouse's PIA, upward if the primary earner had delayed claiming benefits after reaching the full retirement age, or downward if the deceased spouse had claimed benefits early.
A person receiving spouse or survivor benefits is considered a dual beneficiary if that individual is also entitled to benefits based on own earnings that fall below the spouse or survivor benefit. Benefits based on own earnings are ‘topped up’ to reach the benefit the individual is entitled to as a spouse or survivor. If the spouse has not accumulated 10 years of covered earnings, and thus is not eligible for own benefits, the spouse or survivor benefit will account for the entire benefit check. In the case of spouse benefits, when the lower earning spouse has accrued 10 years of covered earnings, but those earnings amount to less than about one third the earnings of the higher-earning spouse, the benefit check paid to the lower-earning spouse will be topped-up. For example, if both spouses were the same age and retired at their full retirement age, with the high-earning spouse entitled to a PIA of $900, and the low-earning spouse entitled to $100 based on own earnings, the spouse benefit would top-up the benefit of the low earner from $100 to 450. In the case of survivor benefits, assuming retirement at full retirement age, a surviving spouse with lower earnings has benefits topped up to the full benefit the higher earner would have been entitled to. In the previous example, if the higher earner died at full retirement age, the lower-earning spouse would receive a total benefit of $900, including the top-up representing the survivor benefit.
All benefits are adjusted based on the age they are claimed. Own benefits are adjusted downward when claimed early, and upward when benefit claiming is delayed beyond the full retirement age. Spouse and survivor benefits are also adjusted for early claiming by the primary earner and by the spouse.
The central policy issue motivating our analysis arises because the redistributive effects of the Social Security benefit formula at the individual level are mitigated at the family level. When wives have lower earnings than their husbands, by averaging over the two spouses, a progressive benefit formula generates less redistribution between families than individuals.Footnote 6 For men, there is a close correlation between their own lifetime earnings and the total of their own and their spouse's lifetime earnings. But for women the relationship is much weaker (Gustman and Steinmeier, Reference Gustman and Steinmeier2001, Table 1). Women from high-income households are often low earners. Thus, when comparing men and women with the same level of own lifetime earnings, family lifetime earnings are higher for women than for men. As a result, redistributing benefits toward households where the woman's earnings are low subsidizes many households where the sum of lifetime earnings for husbands and wives is quite high.
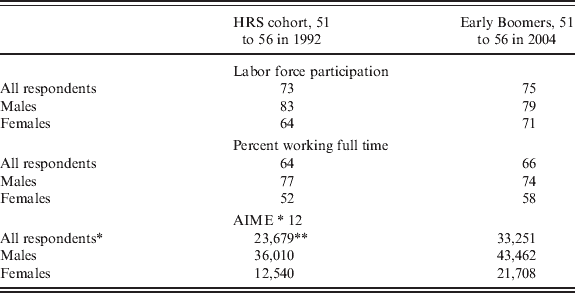
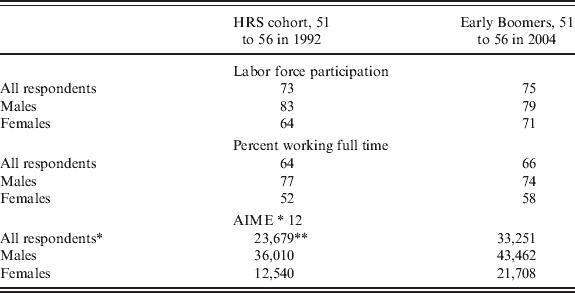
Labor Force Participation and Full-Time Work Patterns over time by men and women ages 51–56 in 1992 and 2004
Data are from the HRS.
* Respondents are from households with at least one member 51–56 years of age.
** 1992 values are in 2004 dollars.
In addition, as long as spouse and survivor benefits accrue disproportionately to households with one high earner, the spouse and survivor benefits paid by Social Security undermine the redistribution of benefits away from high-income families. In a household with high earnings, the top-up is likely to have a higher value than in a household with low earnings (Steuerle and Bakija, Reference Steuerle and Bakija1994).
To be sure, there is an increasing tendency over time for women from higher income families to participate more fully in the labor market. This led Smith et al. (Reference Smith, Toder and Iams2003) and others to predict that even if the benefit formula remained unchanged, the current Social Security system would once again become more redistributive at the family level.Footnote 7
Table 1 shows the differences in labor force participation, full-time work and lifetime covered earnings for a sample of individuals from the HRS. It includes two cohorts, those from households with at least one member age 51–56 in 1992 (the HRS cohort) and those from households with at least one member age 51–56 in 2004 (the Early Boomer cohort). Over this period, women's labor market activity has increased substantially relative to men's (see also Iams et al., Reference Iams, Phillips, Robinson, Deang and Sushi2008). What was a 19-percentage-point gap between the labor force participation rates of 51–56-year-old men and women in 1992 declined to 8 percentage points in 2004. Similarly, what was a 25-percentage-point gap between the fractions of 51- to 56-year-old men and women working full time in 1992 declined to 16 percentage points in 2004. The third panel in Table 1 reports the annualized value of indexed monthly earnings covered by Social Security, here indicated as AIME times 12. The ratio of AIME between men and women declined from 2.87 in 1992 to 2.00 in 2004. Although the gaps in the measures of labor market activity between men and women are considerably smaller for the 2004 cohort than for the cohort 12 years older, as seen in Table 1, they remain substantial.
2 Comparing Social Security benefits and taxes between cohorts
For members of the HRS Early Boomer cohort, ages 51–56 in 2004 (born 1948–1953), full retirement age is 66. The full retirement age has been increased by 2 months for each year born from 1955 through 1960 – a fact that becomes relevant when we calculate benefits for households where one member falls within the 51–56 age range and the other is younger. For those born in 1960 or later, the full retirement age is 67. Similarly, the full retirement age may be lower than 66 for those with a spouse born before 1943.
For this paper, we use the Social Security Administration's ANYPIA program to calculate own benefits for members of the HRS. Since the ANYPIA program does not calculate spouse and survivor benefits for dual-earning households, we calculate spouse and survivor benefits from the own benefit calculations for each spouse. The ANYPIA program requires information on the date of birth of each spouse, covered earnings history, and the expected date at which benefits will be claimed. We provide the required information from the HRS survey and feed it into the ANYPIA program in batch mode. In the course of projecting benefits, ANYPIA uses the information from the HRS data to project earnings into the future, and to calculate the PIA based on that information.Footnote 8
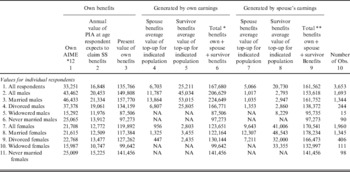
We begin our discussion of benefits by considering own, spouse and survivor benefits, and how they vary among individuals according to their gender and marital status. Table 2A reports the value of covered income and benefits of different types for individuals from the Early Boomer cohort of the HRS, individuals in households with at least one member age 51–56 in 2004. Social Security earnings records are available for about three fourths of the respondents to the HRS from Early Boomer households. Benefits and taxes are imputed for those in the cohort without a matched record.Footnote 9
Covered earnings and benefits earned by members of Early Baby Boomer households in 2004 (in 2004 dollars)

Sample includes members of households where at least one individual is 51–56 years old in 2004. All values use survey weights.
* Spouse and survivor benefits are attributed to individuals whose earnings generated the benefits. Total benefits (column 6) = column 3 + column 4 + column 5.
** Spouse and survivor benefits are generated based on individual's spouse's earnings. Total benefits (column 9) = column 3 + column 7 + column 8.
Column 1 reports the annual average for indexed earnings (AIME*12). Annual benefit amounts based on the individual's own work are reported in column 2 assuming retirement at the individual's expected retirement age.Footnote 10 The present value of own benefits is reported in column 3. The remaining columns in Table 2A pertain to spouse and survivor benefits, attributing them in columns 4 and 5 to the person whose high earnings generated the top-ups for their spouse, and attributing the top-ups to the person who receives them in columns 7 and 8. The rows in Table 2A first report the results for all respondents, then separately for men by marital status, and then for women by marital status.
Looking across row 1, annual indexed earnings average $33,251 for each respondent, with the yearly value of AIME $43,462 for men, and $21,708 for women. Roughly speaking, covered earnings for women are half those for men (the ratio of AIME of women to men is 0.499). Moreover, the gap is even wider within individuals from married households. Annualized AIME for married men is $46,433, whereas for married women it is $21,615, so that married women have 46.6% of the covered earnings of married men. The PIA multiplied by 12, $16,848 for all respondents, is reported in column 2.
Column 3 shows the present value of benefits based only on own work, with benefits beginning at the expected retirement age. Note that we use expected retirement age in the calculation, rather than actual retirement age or claiming age, which are not yet available for the full sample. Annual benefits are discounted to 2004 using interest rates from The Trustee's Report.Footnote 11 Benefits are weighted by survival probabilities using a life table adjusted for variation in life expectancy with income. For individuals from households with at least one member age 51–56 in 2004, the present value of benefits based on own work is $135,766. At $119,892, the present value of benefits women will receive based on own earnings is 80.0% of the present value men will receive based on own earnings ($149,808). With women enjoying four-fifths of the benefits from own earnings as men, women clearly gain considerably from the re-distributional benefit formula since, as noted above, women had about half the covered earnings of men.
For married men benefits are worth $157,770. Benefits for divorced, widowered or never married men fall below those values. Divorced women living alone have benefits based on own work that are about 8.4% more valuable than the benefits earned by married women, and 27.7% more valuable than the benefits based on own earnings received by widows.
Columns 4, 5, and 6 credit the spouse who is the primary earner with any spouse and survivor benefits that will be paid as a result of the primary earner's covered income. Columns 4 and 5 report the values of the top-ups in benefits for qualifying spouses and for widowers or widows of primary earners, all adjusted by the probability the individual will fall into that state.Footnote 12 Spouse and survivor benefits paid to the wives and widows of primary male earners, respectively, are seen in columns 4 and 5, row 2, to be worth $11,787 and 45,034, raising the total value of benefits earned by men from their work from $149,808, the amount they would be entitled to based on own earnings, to $206,629, or by about 38%.Footnote 13 Total benefits reported in column 6, row 1, amounting to $167,680, include own benefits plus any spouse or survivor benefits due to own earnings.
Comparing the values in columns 4 and 5, rows 2 and 7, it can be seen that the spouse and survivor benefits generated by women's earnings are only a small fraction of the spouse and survivor benefits due to the earnings of men. The basic reason is that, with most men having higher earnings than their wives, they are not entitled to any spouse or survivor benefits. On the other hand, many wives with a record of commitment to the labor market are entitled to a top-up due to spouse benefits as long as their covered earnings fall sufficiently far below those of their husbands, and most wives who have qualified for own benefits are eligible for a survivor benefit. Moreover, with the significant degree of non-participation by wives shown in Table 1, adjustments for the timing of retirement aside, wives who are not eligible for own benefits are nevertheless eligible for half the benefits earned by their husband while both are still alive, and to their husband's full benefits should he die.
Columns 7, 8 and 9 report each individual's own earnings, plus spouse and survivor benefits paid to the individual based on their spouse's earnings. Here the spouse that receives the check from SSA is credited with spouse and survivor benefits even though their husband or wife accounted for the earnings and paid the taxes that underlie their benefits. In contrast to the results in columns 4 and 5, here men are credited with very little in the way of spouse and survivor benefits. Specifically, as seen in row 2, columns 7 and 8, for men the top-up to own benefits from spouse benefits is $1,017, while the expected value of survivor benefits is $2,793. Together, the spouse and survivor benefits received by men are worth only about 2.5% of the present value of the benefits they receive due to their own covered work.
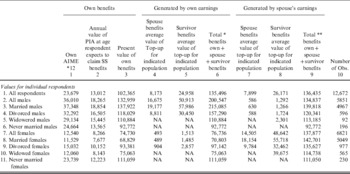
Now to examine how benefits changed over time, Table 2B presents indicators of annual earnings and benefits for members of HRS households with at least one person age 51 to 56 in 1992. To facilitate a comparison with Table 2A, the dollar amounts in Table 2B are reported in 2004 dollars.
Covered earnings and benefits earned by members of HRS households in 1992 (2004 dollars)

Sample includes members of households where at least one individual is 51–56 in 1992. All values are reported in 2004 dollars and are calculated using survey weights.
* Spouse and survivor benefits attributed to individuals whose earnings generated the benefits. Total benefits (column 6) = column 3 + column 4 + column 5.
** Spouse and survivor benefits are generated based on individual's spouse's earnings. Total benefits (column 9) = column 3 + column 7 + column 8.
At $23,679, annual indexed covered earnings for the 1992 cohort are about 71.2% of the $33,251 value reported for the 2004 cohort. A number of factors account for these differences. Among them are differences in real earnings and the lower cap on covered earnings for members of the 1992 cohort (Gustman et al. Reference Gustman, Steinmeier and Tabatabai2012). Another reason is the lower earnings of women in the earlier cohort. While earnings of women were about half the earnings of men in the 2004 cohort, AIME for the 1992 cohort is $36,010 for men and $12,540 for women, so that women from the 1992 cohort earned only about 34.8% of the covered earnings of men.Footnote 14 Within married households, the gap in earnings between men and women was considerably wider for the 1992 cohort, with married women earning only 30.9% of the covered earnings of married men. This compares to 46.6% when comparing the earnings of married women and married men from the 2004 cohort.
For the 2004 cohort, we noted that based on own earnings, the present value of benefits received by women amounts to about four fifths of the present value of benefits men receive based on their own earnings. As seen in Table 2B, for the 1992 cohort, the relevant amounts for women and men, again in 2004 dollars, were $74,730 and 132,959. Thus, the 1992 cohort of women enjoyed only 56.2% of the benefits from own earnings as men, compared to 80.0% for the same comparison in the 2004 cohort. Again, the major growth in women's earnings is plainly evident in the data, even between cohorts separated by only 12 years of age.
In addition, for the 2004 cohort, we found that spouse and survivor benefits paid to the wives and widows of primary male earners increased the total value of benefits earned by men from the amount they would be entitled to based on own earnings by about 37.9% (11,787 + 45,034)/149,808. For the 1992 cohort, spouse and survivor benefits were more important, raising the total value of benefits by 50.8% (16,675 + 50,913)/132,959.
It is also constructive to compare the relative importance of spouse and survivor benefits to own benefits for women. From Table 2B, using data for the 1992 cohort, columns 3, 7, and 8, row 7, spouse and survivor benefits amount to 84.5% of the benefits women would receive from their own earnings (14,505 + 48,642)/74,730. For the 2004 cohort, spouse and survivor benefits amount to 42.2% of the benefits to be received by women based on their own earnings (9,643 + 41,006)/119,892.
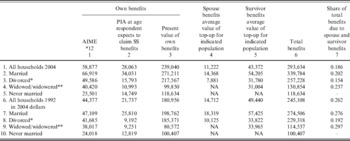
In contrast to the results for individuals reported in Tables 2A and 2B, Table 3 reports benefit values for households with at least one member age 51–56. Rows 1 and 6 allow one to compare outcomes between the 2004 and 1992 cohorts evaluated in 2004 dollars. (Benefits adjusted for changes in family structure are reported in Table 9 below.) Household benefits count the total of benefits received, from own earnings and from spouse and survivor benefits.
Covered earnings and benefits for members of HRS households with at least one individual age 51–56 in 2004 and 1992

The number of households in the 2004 sample is 2,287. In the 1992 sample there are 7,623 households. Values are calculated using survey weights.
* The AIME, PIA, and own benefits for divorced households are the sum of the AIME, PIA, and own benefits from the divorced respondent and his/her imputed spouse. Since the missing spouse is presumably included in the divorced or married (for a second time) population of the other gender, we have used half the household weights for divorced households.
** For the widowed/widowered category, the AIME is the sum of AIME from the respondent and his/her imputed deceased spouse. The PIA and own benefits are from the respondent only.
As seen in column 6 of row 1, in 2004 the present value of total benefits in each household averaged $293,634. Benefits from own earnings amounted to $239,040, with a top-up for spouse benefits of $11,222, and for survivor benefits of $43,372. Thus benefits from own earnings account for a little over four-fifths of total benefits (81.4%), while as shown in the last column of the table, the top-up for spouse and survivor benefits accounts for a little under one-fifth (18.6%) of total benefits.
Row 6 reports comparable figures for those from households with at least one member age 51–56 in 1992. To facilitate comparisons, present values are calculated in constant 2004 dollars. In 1992, 26.2% of total benefits were in the form of spouse and survivor benefits ($14,712 + $49,440)/$245,108. Thus with the increase in women's labor force participation and earnings, the share of total benefits enjoyed by households from spouse and survivor benefits fell from 26.2% in 1992 to 18.6% of total benefits between 1992 and 2004.
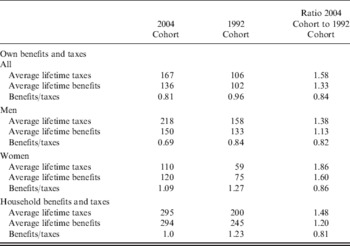
Table 4 provides a picture of the trends in benefits and taxes at the individual and family levels.Footnote 15 As seen in rows 1 and 2 of column 2, for members of the 1992 HRS cohort, the present values of benefits and taxes based on own earnings were roughly equal at $106,000 and 102,000, respectively. By 2004, benefits based on own work amounted to only 81% of taxes paid. This decline in the returns to Social Security taxes reflects the changes in the benefit structure implemented to help solve the financial problems of the Social Security system, and shows itself in one form or another in all comparisons between the two cohorts.
Present values of Social Security benefits and taxes for individuals and households, from households with at least one person age 51–56 in 2004 or 1992 (all values in thousands of 2004 dollars)*

* Values are calculated using survey weights.
It is instructive to consider the changes for men and women separately. Real taxes increased by 38% for men, but reflecting the major changes in their lifetime participation and resulting earnings, taxes increased by 86% for women. Own benefits increased by only 12.7% for men (149,808/132,959). On the other hand, for women, own benefits grew by 60.0%, reflecting the overwhelming trend in their participation and resulting positive effects on earnings.
Comparing the benefit-tax ratio at the individual and household levels, column 1, row 3, in 2004 the ratio for individuals was 0.81, whereas reflecting spouse and survivor benefits, the ratio of benefits to taxes, column 1, bottom row, was 1.0.
As found in the data for own benefits and taxes, benefits grew more slowly than taxes at the household level. The last column in the bottom panel of Table 4 shows that household Social Security benefits rose by 20% between the 2004 and 1992 cohorts, while taxes paid at the household level rose by 48%. (This result is partially affected by the change in the composition of households between 1992 and 2004, an issue we will return to below.) In 2004 at the household level, the present value of Social Security benefits, at $294,000, is slightly less than the present value of taxes paid, at $295,000. In contrast, as seen in the last row in column 2, in 1992, the initial year of the HRS, total benefits at the household level exceeded taxes by about 23%. As a result of the slower relative growth of benefits, by 2004 the benefit-tax ratio had fallen by 18.7% from its level in 1992.
3 Comparing measures of distribution and redistribution between cohorts
3.1 Distribution and redistribution of own benefits and taxes
To this point we have discussed the differences in benefits between members of the Original HRS cohort, those in households with at least one member age 51–56 in 1992, and members of the Early Boomer cohort, in households with at least one member age 51–56 in 2004. We also have explored differences by gender and marital status. We now turn to basic descriptors of the distribution of Social Security benefits and taxes when individuals, and then households, are ranked by lifetime covered earnings.
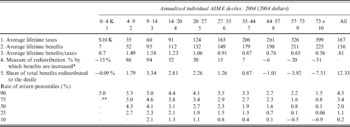
Table 5 reports a variety of measures of benefit and tax distribution and redistribution for the individuals in the Early Boomer cohort in 2004. The population is divided into deciles according to their annualized AIME and outcomes are reported separately by AIME decile. The first two rows report the present values of taxes and benefits with the base year 2004. Values are weighted by survival probability, which includes adjustments for income. The present values of taxes and benefits for the full sample of Early Boomers are reported in the last column of the table.
Baseline measures of distribution and redistribution of own Social Security benefits and taxes for all age eligible respondents in the Early Boomer cohort in 2004

* The base year for the measures of redistribution for the Early Boomer cohort is 2004.
** Dashes indicate taxes were paid but respondents were not insured (covered for 10 years worth of quarter) so they do not receive any benefits.
The first set of measures of redistribution involves a simple comparison of benefits and taxes for members of each AIME decile. Row 3 reports the ratio of the present value of benefits to taxes paid over the expected lifetime. In this comparison, benefits include only those due to own earnings. Although there are positive benefits shown for members falling within the decile with the lowest 10% of covered earnings, there is no net redistribution to individuals falling in that decile in the sense that their benefits fall below taxes paid. Many falling into the bottom AIME decile have not worked for the required 10 years and thus do not qualify for Social Security benefits. Average benefits do exceed average taxes for those falling in the second to fifth AIME deciles, then fall below taxes for those in the remaining deciles. For those in the second, third, and fourth deciles, there is significant redistribution. Own benefits exceed own taxes by 49%, 58%, and 23%, respectively. The ratio of the present value of benefits to taxes for the full cohort is .81 (136/167) as reported in the last column of row 3.
Row 4 of Table 5 reports a second measure of the extent of redistribution fostered by the benefit formula. The baseline is taken as the level of benefits that would be received by members of the decile based on own earnings if their benefits amounted to 81% of the taxes they paid, the average ratio for the Early Boomer cohort. That is, the baseline asks what benefits would be if the benefit-tax ratio for members of the decile were the same as the benefit-tax ratio for all members of the Early Boomer cohort. For example, from column 3, row 4 of the table, members of the third AIME decile receive benefits that are 94% higher than they would be if their benefits amounted to 81% of the taxes they paid. Moving across the columns in row 4, those in the second to seventh deciles of AIME receive benefits that exceed what they would have received at 81% of the taxes they paid. Those in the last three deciles have had their benefits reduced by the progressive benefit formula. Members of the decile with highest AIME have their benefits reduced by 31% below what they would have been with an 81% replacement rate.
Another measure of redistribution asks about the share of total benefits paid to members of the cohort that is redistributed to the members of each decile. Specifically, the figures in row 5 divide the benefits redistributed to the decile by the total value of benefits paid to members of the Early Boomer cohort. So once again, benefits redistributed to the decile are calculated as in the previous paragraph by taking the difference between benefits actually received by members of the decile and the benefits they would have received if the benefit tax ratio for the entire cohort were applied to members of the decile. Instead of stopping there, the benefits redistributed to the decile are then divided by the sum of all benefits received by members of the cohort, giving the percentage of total benefits that are redistributed to members of the decile. Altogether, 12.24% of total benefits paid (−1.01 −3.92 −7.31) are redistributed from members of the three highest AIME deciles to the remainder of the population. Those falling in the lowest decile also receive benefits that fall slightly below the taxes they paid, with the shortfall amounting to 0.09% of total benefits paid to members of the cohort.
The bottom panel of Table 5 reports the real rates of return by AIME decile computed conditional on survival. Looking at the last column, row 3 of the bottom panel, the median value for the real internal rate of return is 2.0 percentage points. It would appear both from the declining amount of redistribution as AIME increases across rows 3 and 4 of the top panel of Table 5, and from the rapid decline in internal rate of return with AIME, that there is considerable redistribution fostered by the progressive benefit formula when evaluated considering own benefits and taxes at the level of the individual.
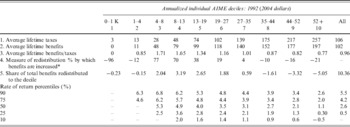
Turn now to Table 6 for comparable results based on the distribution of own taxes and benefits for members of the original HRS cohort, those in households with at least one member age 51–56 in 1992. Beginning with rows 1 through 3, Table 6 reports the simple comparison of benefits and taxes for members of each AIME decile. Row 3 suggests considerable redistribution. Benefits substantially exceed taxes for those falling in the third to sixth AIME deciles. A comparison with results in Table 5 suggests that redistribution extends to members with higher relative incomes in 1992 than in 2004. For the 2004 cohort, those in the second, third and fourth deciles had own benefits exceed own taxes by 49%, 58%, and 23%, respectively. For the 1992 cohort, benefits exceeded taxes by 71% (48/28), 65% (79/48), 34% (99/74), and 16% (118/102) for members of the third, fourth, fifth, and sixth AIME deciles, respectively. While these raw numbers suggest there may have been more redistribution in 1992 than in 2004, the benefit reduction for members of the top three AIME categories suggests otherwise. Looking at columns 8, 9, and 10 of row 5 in Table 5, in 2004, 12.24% of total benefits paid to the cohort was redistributed from members of the three highest earning deciles. This is a greater amount of redistribution than in 1992, row 5, columns 8, 9, and 10 of Table 6, when 9.98% of total benefits paid was redistributed from members of the top AIME deciles.
Baseline measures of distribution and redistribution of own Social Security benefits and taxes for all Age eligible respondents in the HRS, 1992

* The base year for the measure of redistribution calculation for the HRS cohort is 1992.
Comparing rates of return between the two cohorts, the real median rate of return fell from 2.6% in 1992 to 2.0% in 2004. Again, roughly speaking, the rate of return to those in the top three deciles in 2004 is lower than in 1992. Although this might be taken to suggest there is more redistribution in 2004 than in 1992, it should be remembered that the overall rate of return is lower in 2004.
To be sure, the data in rows 3 and 4 of the top panel of Tables 5 and 6 do generate a bottom line regarding the various measures of distribution and redistribution at the level of the individual. The amount of redistribution of own benefits was somewhat, but not overwhelmingly higher for the 2004 cohort than for the 1992 cohort.
3.2 Differences in redistribution among households by cohort
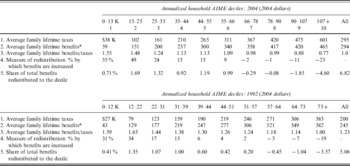
Now we turn to data on the distribution of benefits and taxes among households, and how they differed between cohorts. Accordingly, the data in Table 7 include in benefits paid not only benefits based on own work, but also spouse and survivor benefits. Once householdsFootnote 16 are considered, the picture changes. Recall our finding in Table 5 that in 2004, 12.24% of benefits was redistributed from individuals falling within the three top deciles of earners to those in lower deciles. In the top panel of Table 7, which pertains to households in 2004, we find that 6.82% (−0.29 −0.08–1.85 −4.60) of benefits are redistributed from members of the top four deciles of household units. Remember here that there are at least two major differences between redistribution among individuals and households. First, although individual and household earnings are imperfectly and positively related for men, the relationship is much weaker for women. Second, the data in Table 7 include the top-ups on own benefits for spouse and survivor benefits.
Measures of distribution of household Social Security benefits and taxes for all age eligible respondents, Early Boomer and original HRS cohorts

* Household benefits include own benefit plus top-ups for spouse and survivor benefits.
When these factors are taken into account, although there is redistribution, it is considerably less at the level of the household than at the level of the individual. This bottom line from our earlier work and those of other authors remains. Although the benefit formula is designed to be redistributive, and is redistributive at the level of the individual, lower earnings of women and the presence of spouse and survivor benefits at the household level continue to reduce the degree of redistribution fostered by the Social Security benefit formula.
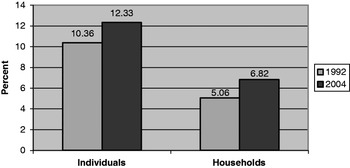
On the other hand, there are important changes indicating that the redistribution fostered by the Social Security benefit formula has increased over time.Footnote 17 The differences between the top and bottom panels of Table 7 show the amount of redistribution at the household level is higher in 2004 than in 1992.Footnote 18 Note that the increase in the redistribution between 2004 and 1992 cohorts is slightly lower, when measured at the household level (6.82–5.06 = 1.76), than at the level of the individual (12.33–10.36 = 1.97).
These findings are summarized in Figure 1. While the share of total benefits redistributed at the individual level increased from 10.36% in 1992 to 12.33% in 2004, the share of total benefits redistributed among households increased from 5.06% in 1992 to 6.82% in 2004. Thus, the gap between the shares of benefits redistributed among individuals vs. at the household level is slightly lower in 1992. That is, redistribution based on own benefits for the 1992 cohort (10.36) minus redistribution based on family benefits (5.06) shows a difference in the level of redistribution between the individual and household levels of 5.30 percentage points. The comparable figure for the 2004 cohort is 5.51 percentage points (12.33–6.82). As we have seen, however, the level of redistribution at the household level remains smaller than the measured redistribution among individuals.
Fraction of Total Benefits Redistributed Among Deciles.

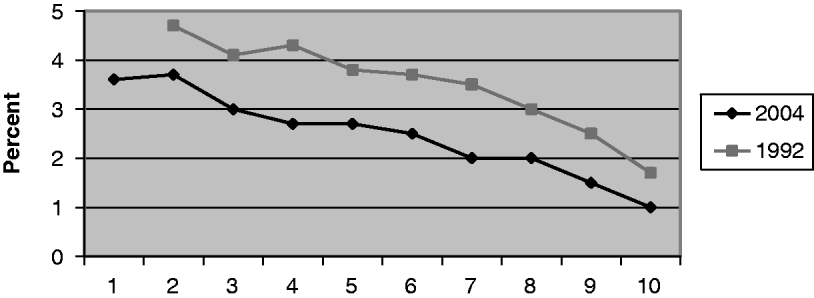
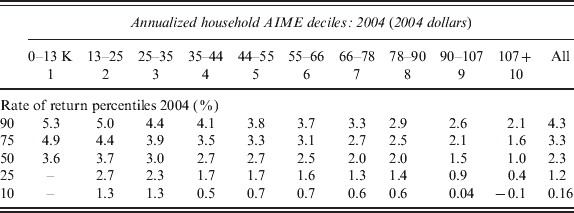
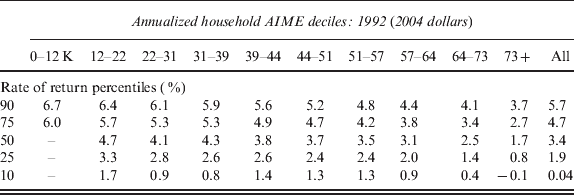
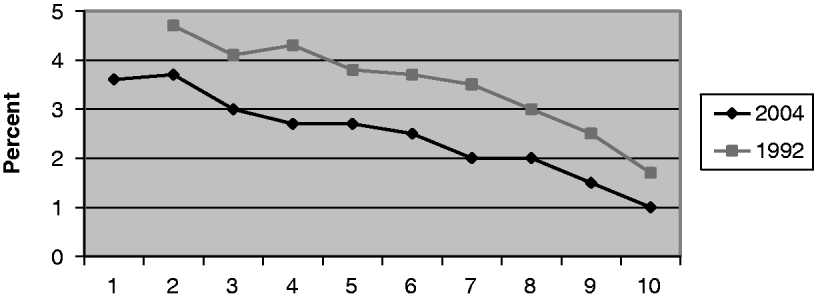
Figure 2 compares the rates of return by AIME decile at the family level. The data underlying Figure 2 are reported in Tables 8A and Tables 8B. Looking at the third row, the rate of return for members of the second AIME decile (column 2) had a median value of 3.7 percentage points in 2004 and 4.7 percentage points in 1992. By the highest decile of earners, the median value has fallen to 1.0 percentage points in 2004 from 1.7 percentage points in 1992.
Rate of Return by Family AIME Deciles.
Rates of return on Social Security benefits and taxes by AIME decile, households with one member 51–56 in 2004*
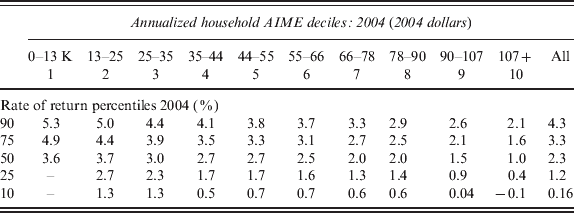
* weighted.
Rates of return on Social Security benefits and taxes by AIME Decile, households with one member 51–56 in 1992*
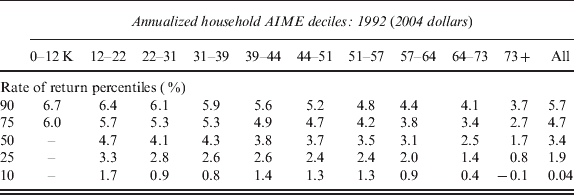
* weighted.
Contrary to the direct measures of benefit redistribution reported above, as seen in Figure 2, although the rates of return are lower in 2004 than in 1992, they decline at roughly the same rate for each cohort when proceeding from low to high AIME deciles. Thus a comparison of the distributions of rates of returns by AIME decile does not suggest a strong difference in benefit redistribution for members of the 2004 cohort.
The two findings that present value calculations yield greater redistribution for the 2004 cohort than for the 1992 cohort, while rate of return calculations suggest similar redistribution for both cohorts, should be reconciled. This difference is the result of complicated interactions among a number of factors. One key to understanding the different findings is to realize that the rate of return forces the interest rate to be the same both before and after retirement, while the present value calculation allows the interest rate to vary over time as it has historically, and as it is predicted to vary in the future. As seen in footnote 11, the real interest rate was much higher from 1980 through 2000 than in later years. The effect of having a higher interest rate during the years the individual is earning and paying taxes is to raise the present value of the tax payments in the base year relative to the present value of benefits. The present value calculations thus weight the payroll taxes paid while at work in the years before retirement more heavily than the rate of return calculations. Second, the rate of return is lower for those in higher income deciles so that their benefits are further inflated relative to their taxes. A third source of difference is the uneven increase in payroll taxes over time for each AIME decile. Tax increases have been greater for those from households with higher earnings.Footnote 19 As a result, the present value calculations show a modest movement toward more redistribution, while any movement toward more redistribution is harder to perceive in the rate of return calculations since the rate of return calculation does not incorporate the interaction over time between changing interest rates and proportionately higher taxes paid by those in higher AIME deciles.
4 Robustness of findings
This section examines the sensitivity of differences in measured outcomes between the 2004 and 1992 cohorts to two differences between the relevant time periods in which they worked and claim benefits. First, there has been an increase in the share of households consisting of one divorced person that may affect measures of distribution and redistribution (Tamborini et al., Reference Tamborini, Iams and Whitman2009). Second, there are differences in the interest rates applied to the two cohorts.
4.1 Sensitivity to changes in family structure
We have attempted to cushion the effects of changes in family structure by including the taxes and benefits for both former members of a divorced household by reconstructing the household, then cutting the weight given to divorced households in half. To examine the effects of changing household structure within the current methodology, Table 9 presents revised measures of redistribution when household weights are adjusted to hold constant the share of one person, divorced households. Specifically, the share of such households in 2004 is adjusted to the level in 1992.
Measures of distributions of household Social Security benefits and taxes for all age eligible respondents (weights are adjusted for changes in the frequency of divorced families between 1992 and 2004.)

* Household benefits include benefit based on own earnings plus top-ups. The missing spouse is imputed to divorced households and taxes and benefits for that spouse are counted.
We have already seen in Table 7 that in data which do not adjust for changes in the share of single, divorced households through 2004, 6.82% of total benefits are redistributed. When the mix of households in 2004 is standardized to control for the growth of households with a single, divorced person, the bottom row, bottom column of Table 9 suggests that 6.80% of total benefits are redistributed. Thus the basic findings are not very sensitive to the increase in the number of divorced households.
4.2 Sensitivity to changes in the interest rate
When computing outcomes for the 2004 and 1992 cohorts, different interest rates were used. The rates used for the 2004 cohort are those in place 12 years later than the interest rates used for the 1992 cohort. Interest rates are generally higher for the 1992 cohort. When yearly values are moved to the base period, a higher interest rate reduces the present value of benefits and increases the present value of taxes paid. Thus if the 1992 cohort enjoyed the lower interest rates experienced by members of the 2004 cohort, the present value of their benefits as of 1992 would have been higher, and the present value of their taxes lower.
To estimate the effects of these differences in interest rates, Table 10 reports the present values calculated for the 2004 cohort (column 1) and the 1992 cohort (column 3) using the interest rates that actually applied to those cohorts. Column 2 calculates comparable values for the 1992 cohort using the interest rates that applied to the 2004 cohort. All values are taken to the base year, either 1992 or 2004 as appropriate, and are converted to 2004 dollars.
Sensitivity of measures of benefits, distribution and redistribution to the interest rate employed (interest rates applicable to persons of the same age from the 2004 cohort are applied to benefits and taxes for members of the 1992 cohort)

All values of benefits and taxes are in thousands of 2004 dollars.
The rows of Table 10 then report the present value of benefits, the present value of taxes, and the share of total benefits redistributed among deciles. The first panel is for individuals based on own earnings. The second is for households from each cohort. Household benefits are the sum of own benefits of each spouse and any spouse and survivor benefits that would accrue to the low earning spouse.
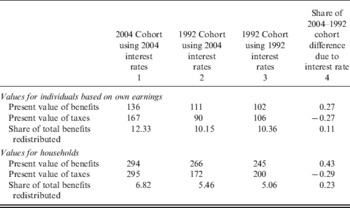
The last column of Table 10 indicates the share of the difference in the relevant value between the 1992 and 2004 cohort that is due to the interest rate. For example, take the present value of benefits to be received by households. The measured difference in benefits is $294,000 in 2004 (from column 1) minus $245,000 in 1992 (from column 3). The part of the difference from $245,000 to 266,000 (the value in column 2 minus the value in column 3) is due to the lower interest rate facing the 2004 cohort. So as reported in column 4, 43% of the difference in benefits is due to the difference in interest rates [(266–245)/(294–245)].
In the case of taxes, the higher interest rate applicable when summing up the 1992 cohort's lifetime taxes increased the base value of the tax, and caused the difference in the taxes paid by the 2004 and 1992 cohorts to be understated by over a quarter.
These findings mean that the raw differences in present value overstate the fall in the benefit/tax ratio for Social Security between 1992 and 2004. Nevertheless, there has been a substantial decline in the value of benefits relative to taxes over the 12 year period. Remember that whatever the implications for differences between the cohorts in benefits and taxes, the level of benefits and taxes paid by the 2004 cohort are almost equal in present value, as shown in column 1.
More importantly, from the perspective of this paper, the differences in redistribution measured in this paper are somewhat affected by the difference in the interest rate. As seen in the last column, last row of Table 10, the measured difference in redistribution affecting each cohort is changed by 23% when the interest rates are standardized.
These exercises suggest our findings are not very sensitive either to the differences in the structure of families between the cohorts, or to differences in the interest rates that prevailed between the two cohorts.
5 Conclusions
This paper has measured the difference in redistribution of benefits fostered by the Social Security system between cohorts of individuals and households from the HRS, and how these differences have changed over time. In summarizing our findings, a number of results may be highlighted. Comparing the 1992 and 2004 cohorts, in 2004 benefits received by members of the highest AIME deciles are reduced by a greater proportionate amount from redistribution than were the benefits of those in the highest deciles in 1992. The fraction of total Social Security benefits redistributed from high to low-earning individuals increased from 9.98% for the 1992 cohort to 12.24% for the 2004 cohort. At the household level, the fraction of benefits redistributed from high to low-earning households increased from 5.06% to 6.82%. Nevertheless, a 5.42-percentage-point gap remains between the share of benefits redistributed at the individual and household levels. In sum, the 2004 Social Security system, by some measures, was somewhat more effective in redistributing benefits to low AIME households, but was still substantially less effective in redistributing benefits among households arrayed according to lifetime covered earnings than it was in redistributing benefits among individuals according to own earnings.
Looking to the future, it will not be long until data for the 2010 HRS households become available. One can expect an update of this study to indicate progress in the same direction as measured here. Women from the new, younger HRS cohort will have shown even greater attachment to the labor market. Nevertheless, the Social Security system is likely to remain less effective in redistributing benefits among families with different incomes than is suggested by the basic benefit formula.
From a policy perspective, this study provides basic facts upon which to base any policy changes meant to revise the redistributive effects of the OASI system. The degree of redistribution remains quite modest at the household level. Perhaps the lack of effective redistribution from those in the upper deciles has increased the popularity of the program as a source of income in retirement. That is an issue for policy makers to wrestle with. They must decide whether they are happy with the rather modest level of redistribution of Social Security benefits at the household level, or whether they would prefer a system that is more, or less, redistributive.