INTRODUCTION
Though chemical fertilizers have played a prominent role in increasing agricultural production, its improper use over the years can lead to soil degradation, resulting in lower yields. Majority of small and marginal farmers do not have financial resources to purchase sufficient fertilizers to replace soil nutrients removed through crop harvests. As a result, soil fertility has declined, and yields of staple food crops are typically low (Sanchez et al., Reference Sanchez, Shepherd, Soule, Place, Buresh, Izac, Mokwunye, Kwesiga, Ndiritu, Woomer, Buresh, Sanchez and Calhoun1997). Continuous use of chemical fertilizers, especially the nitrogenous fertilizers, may cause environmental hazards such as ground and surface water pollution by nitrate leaching that may deteriorate human and animal health (Pimentel, Reference Pimentel1996). So to reduce the amount of chemical fertilizers applied to the field without resulting in its deficiency will be the main challenge in fertilizer management in the field. One of the possible options to reduce their use could be recycling of locally available organic wastes, viz. crop residue, green manure and farmyard manure (FYM), which can be a valuable and inexpensive source of plant nutrients. Positive effects of organic wastes on soil structure, aggregate stability and water-holding capacity have been well documented (Odlare et al., Reference Odlare, Pell and Svensson2008; Wells et al., Reference Wells, Chan and Cornish2000).
Organic matter, which is the most important component of cultivated lands, is declining with time due to intensive cropping and use of higher doses of chemical fertilizers with little or no addition of organic manures in the farmer's field. Organic manures can supply a good amount of plant nutrients and, therefore, can contribute to crop yields substantially. They have the potential to improve the chemical, physical and biological properties of soil and are often proposed as alternatives to commercial mineral fertilizers. Traditional organic materials, such as crop residues and animal manures, however, cannot by themselves reverse soil fertility decline because (i) they are usually not available in sufficient quantities on most of the farms, and (ii) they are low in nutrients and their processing and application are labour-intensive (Palm et al., Reference Palm, Myers, Nandwa, Buresh, Sanchez and Calhoun1997). It is, therefore, necessary to use chemical fertilizers and organic manures in an integrated way to obtain sustainable crop production and profitability without declining soil fertility.
Where the main purpose of a recommendation to use organic materials was to decrease the required rate of mineral fertilizers, this raises questions about the optimal proportions of organic and inorganic fertilizers for increasing crop yields vis-à-vis maintaining soil health. Limited long-term experimental work has so far been done to work out the optimal proportions of organic and mineral fertilizers. Continuous integrated use of organic manures and chemical fertilizers would be quite promising in assessing the sustainability of a cropping system vis-à-vis devising a proper fertilizer schedule. The present investigation was, therefore, undertaken to study the long-term effects of reduced doses of chemical fertilizers along with different organics with reference to crop yields and soil properties.
MATERIALS AND METHODS
Study site
A long-term field experiment with rice followed by wheat was initiated during kharif 1991 season at the experimental farm of the College of Agriculture, Chaudhary Sarwan Kumar Himachal Pradesh Agricultural University, Palampur, HP, India, located at 32°6´ N latitude, 76°3´ E longitude and 1223.7 m altitude in North-West Himalayas. The site lies in sub-temperate humid zone of Himachal Pradesh, which is characterized by mild summers and severe winters, and experiences occasional snowfall during winters. The region receives an average rainfall of 2600 mm per annum, major portion of which (about 80%) is received during the months of June to September. Winter rains are received during December to February. At the beginning of the experiment in 1991, following properties of surface soils (0–0.15 m) were recorded: acidic soil with a pH of 5.5 (1:2.5 soil: water); 6.0 g kg−1 organic carbon (Walkley and Black, Reference Walkley and Black1934); 675, 22 and 221 kg ha−1 available N (Subbiah and Asija, Reference Subbiah and Asija1956), P (Olsen et al., Reference Olsen, Cole, Watanabe and Dean1954) and K (Jackson, Reference Jackson1973), respectively, and 11.5 c mol (p+) kg−1 cation exchange capacity (CEC) (Piper, Reference Piper1966). The soil texture was silty clay loam with 22.5, 43.6 and 31.7% sand, silt and clay, respectively. Taxonomically, these soils are classified as ‘Typic Hapludalf’ (Verma, Reference Verma1979).
Experimental details
The field experiment (randomised block design with four replicates) was established with rice and wheat as test crops and supplementing a part of nitrogen (25–50%) through different organic sources viz., FYM, wheat cut straw and green manure. Use of 100% NPK corresponds to the state level recommended dose of N, P and K for respective crops, which was 90:17:33 and 120:26:25 kg ha−1 for rice and wheat, respectively. The same set of eight treatments was repeated in the permanent laid out plots over the years with following treatment details: T1 – Control (neither manure nor chemical fertilizer); T2 –100% NPK to both rice and wheat crops through chemical fertilizers; T3 – 50% NPK through chemical fertilizers + 50% N through FYM to rice followed by 100% NPK to wheat through chemical fertilizers; T4 – 75% NPK through chemical fertilizers + 25% N through FYM to rice followed by 75% NPK through chemical fertilizers to wheat; T5 – 50% NPK through chemical fertilizers + 50% N through wheat cut straw to rice followed by 100% NPK through chemical fertilizers to wheat; T6 – 75% NPK through chemical fertilizers + 25% N through wheat cut straw to rice followed by 75% NPK through chemical fertilizers to wheat; T7 – 50% NPK through chemical fertilizers + 50% N through green manure (Sesbania aculeata) to rice followed by 100% NPK through chemical fertilizers to wheat and T8 – 75% NPK through chemical fertilizers + 25% N through green manure (Sesbania aculeata) to rice followed by 75% NPK through chemical fertilizers to wheat. Sesbania aculeata (Dhaincha) was grown as an ex-situ green manure crop during summer (May to July) every year for a period of 60–65 days and was chopped off into small pieces of 4–6 cm and incorporated into soil by a power-operated rotavator at the time of puddling before transplanting of rice.
In rice, half of N and entire quantity of P and K were applied as basal dose through urea, superphosphate and muriate of potash, respectively. The remaining half dose of N was applied at tillering stage. Different organics, viz. FYM, wheat cut straw and Sesbania aculeata (Dhaincha) as green manure were applied to rice crop only each year in specified treatments. In wheat one-third of N and entire amount of P and K were applied as basal dose through urea, superphosphate and muriate of potash, respectively. The remaining two-third amount of N was applied in two equal splits at tillering and grain filling stages. Rice crop (kharif) was sown during the first fortnight of June, transplanted during first fortnight of July and harvested during first week of October, while wheat crop (rabi) was sown during the second fortnight of November and harvested at maturity in the first fortnight of May every year.
Soil analysis
The air-dried surface soil samples (0–0.15 m) taken after the harvest of wheat in 2009–2010 formed the basis of study of chemical environment. Different chemical parameters, viz., pH, organic carbon, CEC and available N, P and K were estimated following standard procedures as given in the preceding section, and micronutrient cations were determined by Diphenyl Triamine Penta Acetic Acid (DTPA; Lindsay and Norvell, Reference Lindsay and Norvell1978).
Data Analysis
The data generated were statistically analyzed using analysis of variance technique (Gomez and Gomez, Reference Gomez and Gomez1981). To find out treatment differences, pooled analysis of grain yield data from 1991–1992 to 2009–2010 was done and results were compared using critical difference at 5% level of significance (p = 0.05). To minimize the year-to-year variation in grain yield, five years’ moving averages were worked out. For soil properties, treatment differences were also compared using critical difference at 5% level of significance among different treatments at the end of the 19th cropping cycle (2009–2010).
RESULTS
Grain yield
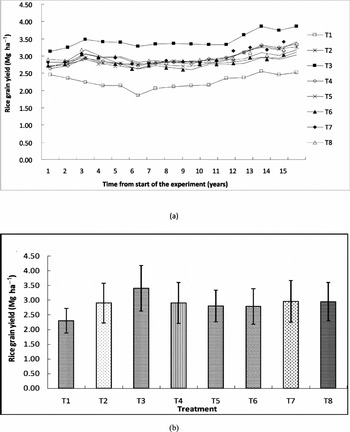
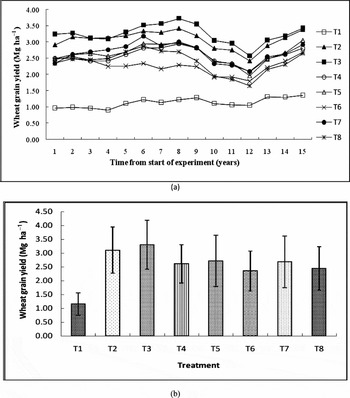
The data on grain yield of rice and wheat, based on five years’ moving averages for different treatments for the period 1991–1992 to 2009–2010, are presented in Figures 1a and 2a, respectively. The 19 years’ pooled grain yields for rice and wheat crops are also depicted in Figures 1a and 2b, respectively.
(a) Effect of different treatments (T1 – Control; T2 – 100% NPK to both the crops; T3 – 50% N through FYM plus 50% NPK to rice and 100% NPK to wheat; T4 – 25% N through FYM plus 75% NPK to rice and 75% NPK to wheat; T5 – 50% N through wheat cut straw plus 50% NPK to rice and 100% NPK to wheat; T6 – 25% N through wheat cut straw plus 75% NPK to rice and 75% NPK to wheat; T7 – 50% N through green manure plus 50% NPK to rice and 100% NPK to wheat; T8 – 25% N through green manure plus 75% NPK to rice and 75% NPK to wheat) on the grain yield of rice based on five years’ moving average, beginning in 1991. (b) Effect of different treatments on the grain yield of rice (pooled for 19 years). Error bars indicate standard deviation of the mean (n = 7); LSD (p = 0.05) for treatment differences = 0.178.

(a) Effect of different treatments (T1 – Control; T2 – 100% NPK to both the crops; T3 – 50% N through FYM plus 50% NPK to rice and 100% NPK to wheat; T4 – 25% N through FYM plus 75% NPK to rice and 75% NPK to wheat; T5 – 50% N through wheat cut straw plus 50% NPK to rice and 100% NPK to wheat; T6 – 25% N through wheat cut straw plus 75% NPK to rice and 75% NPK to wheat; T7 – 50% N through green manure plus 50% NPK to rice and 100% NPK to wheat; T8 – 25% N through green manure plus 75% NPK to rice and 75% NPK to wheat) on the grain yield of wheat based on five years’ moving average, beginning in 1991. (b) Effect of different treatments on the grain yield of wheat (pooled for 19 years). Error bars indicate standard deviation of the mean (n = 7); LSD (p = 0.05) for treatment differences = 0.193.

Figure 1a indicates that rice grain yield was the lowest in plots where no manure or fertilizer (control) was applied (T1). Application of 50% N through FYM plus 50% NPK through chemical fertilizers during kharif followed by 100% NPK through chemical fertilizers during rabi (T3) increased the rice grain yield from 3.13 Mg ha−1 (1991–1995) to 3.86 Mg ha−1 (2005–2009). Use of chemical fertilizer alone (T2) or in combination with organic manures (T3 to T8) increased the rice grain yield significantly over control. The plots receiving 50% N substitution with different organics recorded higher grain yield over 25% N substitution, the differences, however were significant only in case of FYM. Among different organics, FYM was found superior over rest of the sources. Figure 1b, depicting 19 years’ pooled yield shows that balanced application of NPK through chemical fertilizers (T2) sustained rice grain yield at around 2.90 Mg ha−1. The highest yield of about 3.40 Mg ha−1, however, was recorded in treatment T3, where 50% N through FYM plus 50% NPK through chemical fertilizers during kharif followed by 100% NPK through chemical fertilizers during rabi was applied as against 2.30 Mg ha−1 under control, i.e. an improvement of about 1.10 Mg ha−1. This 50% N substitution through FYM also resulted in about 0.50 Mg ha−1 more rice grain yield over 100% NPK-treated plots. The FYM addition could be preferred over all other treatments for sustaining higher yields. In absence of FYM, green manure or wheat cut straw could be an alternative for sustaining higher grain yields of rice in acidic soils.
The effect of integrated nutrient supply on grain yield of wheat based on five-year moving average values (1991–1992 to 2009–2010) has been presented in Figure 2a. The productivity of wheat was lowest in control plots (T1), where no chemical fertilizer or organic was applied. Application of 100% NPK through chemical fertilizers during both the seasons (T2) increased the grain yield of wheat over control. Substitution of N (either 50% or 25%) through any of the organic sources registered increase in wheat grain yield over control. Like rice, the highest wheat grain yield was also recorded under the treatment T3 where 50% N through FYM plus 50% NPK through chemical fertilizers during kharif followed by 100% NPK through chemical fertilizers during rabi was applied. Amongst different organics, FYM was found superior. Wheat cut straw or green manure was equally effective at their respective levels. It was further observed that substitution of 50% N through any of the organics was superior over 25% N substitution. Figure 2b, depicting 19 years’ pooled yield data, revealed that balanced application of NPK (T2) through chemical fertilizers sustained wheat grain yield at around 3.11 Mg ha−1. The integrated use of 50% N through FYM along with 50% NPK through chemical fertilizers to rice followed by 100% NPK through chemical fertilizers to wheat (T3) maintained the highest productivity of about 3.30 Mg ha−1 as against 1.15 Mg ha−1 under control, i.e. an improvement of about 2.15 Mg ha−1.
Soil properties
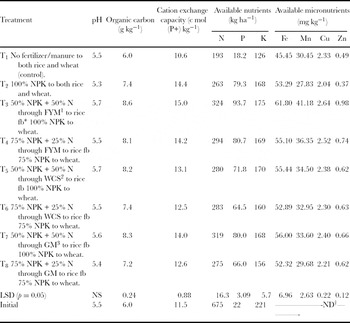
Table 1 depicts the data of different soil properties at the end of the 19th cropping cycle (2009–2010). Data revealed that different treatments had no significant effect on soil pH. Application of 100% NPK through chemical fertilizers (T2) reduced soil pH marginally to 5.3, while use of 50% NPK through chemical fertilizers along with 50% N either through FYM or wheat cut straw increased soil pH to 5.7 in comparison to its initial value of 5.5 recorded at the start of the experiment.
Effect of different treatments on soil properties after 19th cropping cycle (2009–2010).

*Followed by (1) farm yard manure, (2) wheat cut straw, (3) green manure; †not determined.
Unlike soil pH, different nutrient management practices had a significant effect on soil organic carbon. A definite buildup of organic carbon in all the treatments except T1 over its initial value of 6.0 g kg−1 at the start of the experiment (i.e. kharif 1991) was observed (Table 1). Cultivation of crops without any fertilizer or manure (control, T1) maintained organic carbon at its initial level of 6.0 g kg−1. Application of inorganic fertilizers (100% NPK, T2) over the years increased this value to 7.4 g kg−1. Use of organic manures along with chemical fertilizers further increased the soil organic carbon content and a maximum value of 8.6 g kg−1 was recorded in T3 where 50% NPK through chemical fertilizers along with 50% N through FYM during kharif followed by 100% NPK through chemical fertilizers during rabi was applied (Table 1).
The values of CEC after the harvest of wheat 2009–2010 varied from a minimum of 10.64 c mol (P+) kg−1 in control (T1) to a maximum of 15.0 c mol (P+) kg−1 in plots receiving 50% NPK through chemical fertilizers along with 50% N through FYM during kharif followed by 100% NPK through chemical fertilizers through inorganics during rabi (T3) for the last 19 years (Table 1). Like soil organic carbon, values of CEC also increased in all the treatments over its initial value of 11.5 c mol (P+) kg−1 except in control (T1), where a decline of about 7.8% was recorded. Application of chemical fertilizers either alone (T2) or in conjunction with organics (T3 to T8) increased the values of CEC significantly over control. Application of 100% NPK through chemical fertilizers (T2) to both the crops registered an increase of 35.8% in the values of CEC over control.
Application of varying levels of NPK and manures significantly influenced the available nitrogen status of soil (Table 1). It varied from 193 to 324 kg ha−1 in T1 and T3 treatment, respectively. The lowest value of available N in control (T1) was statistically inferior to all other treatments, while the highest value recorded in T3 was at par with the available N in T7, where 50% N was substituted through green manure in rice followed by 100% NPK through chemical fertilizers in wheat. Application of 100% NPK through chemical fertilizers to both the crops (T2) increased available N by 36.3% over control. Substitution of 50% of N recorded higher value of available N than 25% substitution, the difference, however, was significant in case of FYM- and green manure-treated plots only. There was overall depletion of available N over its initial value of 675 kg ha−1.
The available P content of the soil varied from 18.18 kg ha−1 in control (T1) to 93.68 kg ha−1 in plots which received 50% NPK through chemical fertilizers + 50% N through FYM in kharif followed by 100% NPK through chemical fertilizers in rabi (T3). Amongst integrated nutrient management treatments, T3 with the highest available P content was statistically superior over all other treatments. Substitution of 25% N through any of the organic sources resulted in significantly lower available P content in comparison to their 50% substitution through respective sources. There was a substantial buildup of available P in all the treatments except control (T1) from its initial value of 22 kg ha−1 (Table 1).
The available K status of the soil ranged from a minimum of 126 kg ha−1 under T1 to a maximum of 176 kg ha−1 under T3. Available K status in T1 was significantly lower, while in T3 it was significantly higher. The data further revealed that the application of either chemical fertilizers alone (T2) or in combination with organic manures (T3 to T8) recorded an increase in the available K content of the soil over control. Like N status, there was depletion in available K in all the treatments over its initial value of 221 kg ha−1.
The values of DTPA extractable micronutrient cations were also maximum where 50% NPK through chemical fertilizers + 50% N through FYM in kharif and 100% NPK through chemical fertilizers in rabi were applied (T3) followed by 75% NPK through chemical fertilizers + 25% N through FYM in kharif and 75% NPK through chemical fertilizers in rabi (T4), and which were significantly higher over control (Table 1). The highest values of micronutrient cations recorded in T3 were 61.80, 41.18, 2.64 and 0.98 mg kg−1 for Fe, Mn, Cu and Zn, respectively. The plots receiving 50% N substitution with different organic materials recorded higher micronutrient content in comparison to 25% N substitution. Among different organics, long-term application of FYM continuously for 19 years was found superior over the rest of the sources (Table 1).
DISCUSSION
The data presented above provide clear evidence that the omission of chemical fertilizers and organic manures for the last 19 years (control) resulted in low yield due to continuous mining of nutrients. However, the integrated use of chemical fertilizers with organics, viz. FYM, wheat cut straw or green manure, might have added huge quantity of organic matter in soil resulting in increased grain yield. Based on 17 years of field experimentation, Liang et al. (Reference Liang, Yang, He and Zhou2011) stated that high microbial activity and biomass addition through organic manures often lead to high nutrient availability to crops, resulting in high yields. Mohamed et al. (Reference Mohamed, Ewees, Seaf and Dalia2008) also reported that such positive results of organic manures are achieved as they are rich in both organic and mineral substances, which stimulate and activate biochemical processes in plants, which ultimately increase the grain yield and improve soil quality.
Use of FYM proved superior over rest of the organics tried. The additive effect of FYM application on crop yield was greater on rice than on wheat, which might be due to the fact that FYM was applied only to the rice crop every year, while in case of wheat, no fresh application of FYM was made, and whatsoever be the effect on wheat yield, it was due to its residual effect over the years. Use of FYM might have improved the physicochemical properties of soil that resulted in increased productivity (Chaudhary and Thakur, Reference Chaudhary and Thakur2007). Further, the organic matter supplies macro and micronutrients and several complexing agents, which maintain balanced supply of nutrients to crop. These results are also in conformity with the earlier findings (Gupta et al. Reference Gupta, Sharma and Vishvakarma2006; Sharma et al., Reference Sharma, Singh, Subehia, Jain, Kaushal and Verma2005; Urkurkar et al., Reference Urkurkar, Tiwari, Shrikant and Bajpai2010).
There was not significant effect of different treatments on soil pH. Slight increase in soil pH observed in some treatments involving conjoint use of organic manures and chemical fertilizers might be due to the moderating effect of organic manures, as it decreases the activity of exchangeable Al3+ ions in soil solution due to chelation effect of organic molecules (Hue, Reference Hue1992). Benito et al. (Reference Benito, Masaguer, Moliner, Arrigo and Palma2003) also reported no significant effect of pruning waste compost on soil pH.
A definite buildup of organic carbon under different treatments was observed. Application of 100% NPK through chemical fertilizers alone caused about 23% increase over control (T1), in which no manure or fertilizer was added. This may be due to the addition of root biomass in this treatment over the years. Use of different organic sources (T3–T8) further increased it (20 to 43%) over control. After 18 years of field experimentation, Meirong et al. (Reference Meirong, Zhongpei, Yuping, Han and Ming2011) also reported significant increase in soil organic carbon in all the treatments and found that organic manure application was the most effective treatment. Addition of biomass in integrated treatments through various organics and slow rate of organic matter decomposition due to lower temperature in wet temperate zone could be another reason for higher buildup of soil organic carbon (Sharma et al., Reference Sharma, Subehia and Sharma2002). Singh (Reference Singh2010) opined that integrated use of mineral fertilizers and organic manures could improve the soil quality under both the rice wheat and maize wheat cropping systems as evident from carbon management index.
Application of chemical fertilizers alone or in conjunction with different organic sources improved the CEC of soil. Integrated use of chemical fertilizers with organics increased soil organic carbon content (Table 1) that increased the CEC of soil. Benito et al. (Reference Benito, Masaguer, Moliner, Arrigo and Palma2003) also reported the increase in soil CEC by compost addition due to increase in total organic carbon and they further explained that organic matter will affect CEC by the following mechanisms: (1) More binding sites from organic matter particularly because the highly decomposed organic matter in compost has a large number of cation binding sites, and (2) increasing microbial activity and therefore stimulation of decomposition of native organic matter which also increases the number of binding sites. These results are also in conformity with the findings of Phogat et al. (Reference Phogat, Dahiya, Hooda, Sangwan and Solanki2004).
The lower content of available nitrogen in control plots is a result of mining of available nitrogen with continuous cropping without fertilization over a long period of time. Increase in available nitrogen with organics is attributed to its direct addition, as FYM, wheat cut straw and green manure contained 1.32, 0.49 and 3.2% total nitrogen, respectively, which after mineralization came into the soil solution form and became available with passage of time. The favourable soil conditions, viz. organic carbon, porosity, water-holding capacity etc. might have helped in the mineralization of soil nitrogen leading to their buildup. These results are in conformity with the earlier work (Gupta et al., Reference Gupta, Sharma and Vishvakarma2006; Urkurkar et al., Reference Urkurkar, Tiwari, Shrikant and Bajpai2010). A marked depletion of available nitrogen over initial status could be explained on the basis of high rainfall (around 2600 mm per annum) received in the experimental area that might have caused leaching losses for this nutrient over the years.
Build up of available phosphorus with the application of NPK fertilizers alone or in conjunction with organics might be due to the release of organic acids during decomposition which in turn helped in releasing phosphorus through solublising action on native phosphorus in the soil (Gupta et al., Reference Gupta, Sharma and Vishvakarma2006; Urkurkar et al., Reference Urkurkar, Tiwari, Shrikant and Bajpai2010). The organic matter also forms a cover on sesquioxides and makes them inactive and thus reduces the phosphate fixing capacity of soil, which ultimately helps in release of ample quantity of phosphorus as reported by Kumar and Prasad (Reference Kumar and Prasad2008). From a similar experiment conducted on Typic Ustochrept, a loamy sand soil of Punjab, India, Walia et al. (Reference Walia, Walia and Dhaliwal2010) have also reported that the long-term addition of FYM, wheat cut straw and green manure helped increase the available phosphorus in soil, which might be due to mineralization or solubilising of native phosphorus reserves. In the current study, FYM, wheat cut straw and green manure on an average contained 0.62, 0.14 and 0.51% phosphorus, respectively, and their continuous application might have contributed its appreciable accumulation in soil.
The depletion in native potassium pool even at recommended levels of NPK over initial value is due to its more removal (luxury consumption) by crops as compared to its addition. Increase in available potassium over control with the addition of organic manures might be due to the reduction of potassium fixation and release of potassium due to interaction of organic matter with clay, besides the direct potassium addition to the soil pool (Urkurkar et al., Reference Urkurkar, Tiwari, Shrikant and Bajpai2010). Such increase in the content of available potassium with the use of organics along with chemical fertilizers has also been reported by Gupta et al. (Reference Gupta, Sharma and Vishvakarma2006) and Walia et al. (Reference Walia, Walia and Dhaliwal2010).
Application of organics, viz. FYM, wheat cut straw and green manure increased micronutrient contents in soil (Table 1), which might be due to the formation of organic chelates, which decreased their affinity to adsorption, fixation and precipitation (Kher, Reference Kher1993; Prasad et al., Reference Prasad, Karmakar, Kumar and Mishra2010). The lower contents in untreated plots might be due to their mining with continuous cropping without any addition/substitution over the years. The long-term application of organics increased DTPA extractable Cu, Fe, Mo and Zn. Our results are similar to those of several other researchers who have reported significant increase in DTPA extractable micronutrients with the application of biosolids (Barbarick and Ippolito, Reference Barbarick and Ippolito2003; Evanylo et al., Reference Evanylo, Sukkariyah, Eborall and Zelazny2006; Schroder et al., Reference Schroder, Zhang, Zhou, Basta, Raun, Payton and Zazulak2008). Concentration of DTPA–Cu increased from 2.04 mg kg−1 in plots receiving chemical fertilizers alone (T2) to 2.64 mg kg−1 in the treatment receiving 50% N substitution through FYM in rice every year (T3). Concentrations ranged from 27.83 to 41.18 mg kg−1 and 0.37 to 0.98 mg kg−1 for DTPA–Mn and DTPA–Zn in T2 and T3 treatments, respectively, while the concentration of DTPA–Fe ranged from 45.45 mg kg−1 in T1 to 61.80 mg kg−1 in T3. Maftoun and Moshiri (Reference Maftoun and Moshiri2008) also reported that soil addition of municipal waste compost and poultry manure increased concentrations of DTPA extractable Fe, Mn, Cu and Pb in the post-harvest soil samples.
CONCLUSIONS
Our results indicate that use of 50% N through FYM along with 50% NPK through chemical fertilizers to rice followed by 100% NPK through chemical fertilizers to wheat over the years not only maintained the highest productivity of rice–wheat system but also improved soil chemical environment in terms of organic carbon, CEC and available macro and micronutrients status. Thus, by saving expenditure on costly chemical fertilizers and substituting plant nutrients through locally available organic sources farmers can not only sustain productivity but also improve soil chemical environment.
Acknowledgements
The authors feel privileged to thank the Indian Council of Agricultural Research for the financial and technical help to carry out this work by way of sponsoring All India Coordinated Research Project on Farming System Research at CSK Himachal Pradesh Agricultural University, Palampur, HP, India.