Introduction
The 2005–06 National Family Health Survey of India found that more than two-fifths of children under the age of five years were underweight. India presents a typical scenario in South Asia, fitting the adage of the ‘Asian Enigma’, whereby childhood malnutrition lags far behind other Asian countries with similar levels of economic development (UNICEF, 1990; Ramalingaswami et al., Reference Ramalingaswami, Johnsson and Rohde1996; Claeson et al., Reference Claeson, Bos, Mawji and Pathmanathan2000; Gragnolati et al., Reference Gragnolati, Shekar, Das, Bredenkamp and Lee2005; Svedberg, Reference Svedberg2008; Kanjilal et al., Reference Kanjilal, Mazumdar, Mukherjee and Rahman2010; Das & Bose, Reference Das and Bose2011; Mangeshkar, Reference Mangeshkar2012). Failing to deal effectively with the undernutrition problem could have dire consequences for child development. It is well established that nutritional outcome is affected by a host of individual and contextual factors. An individual child resides in a household, which is located within a community, which operates under the policies of a state or national government. Each level within the societal hierarchy has the potential to influence infant and child nutritional outcomes through genetic, behavioural and environmental factors (Griffiths et al., Reference Griffiths, Madise, Whitworth and Matthews2004). Macintyre and Ellaway (Reference Macintyre and Ellaway2000) suggested that households of similar socioeconomic status can have different health outcomes depending on the affluence of their neighbourhoods. Therefore, it is essential to know the socioeconomic conditions and food consumption patterns under which malnutrition prevails (Reddy, Reference Reddy2010).
Epidemiological studies conducted in developing countries have identified several factors associated with undernutrition in children, the most prominent being poverty, rural residence and low levels of parental education. Smith and Haddad (Reference Smith and Haddad2002) found that GDP per capita is another factor that contributes to the reduction in child undernutrition in developing countries. Apart from socioeconomic factors, dietary diversity is also associated with the nutritional status of young children (Taren & Chen, Reference Taren and Chen1993; Hatloy et al., Reference Hatloy, Halland, Diarra and Oshaug2000; Arimond & Ruel, Reference Arimond and Ruel2002; Onyango et al., Reference Onyango, Koski and Tucker2008). Recognizing the importance of dietary diversity for child growth and development, the World Health Organization included ‘diversity in complementary feeding’ as a specific recommendation for breast-fed children aged 6–23 months. The increased recognition of dietary diversity as an important element in healthy nutrition calls for more research in this area. Dietary diversity may vary at the household and state level, depending on the availability and individual preference for food. Availability and consumption depend upon local climatic conditions and food production practices. Thus agro-climatic regions have been identified as significant predictors of dietary diversity. Socioeconomic differences in food consumption patterns have been identified over different time periods (Popkin et al., Reference Popkin, Horton, Kim, Mahal and Shuigao2001; Darmon & Drewnowski, Reference Darmon and Drewnowski2008). Although food availability and consumption at the household level have been examined in several studies, the state-level food consumption pattern as a determinant of the nutritional status of children remains less explored.
Food consumption patterns have changed over time, and are influenced by income, individual preferences and geographical and social factors. The effects of changes in diet and physical activity patterns over time are reflected in nutritional outcomes such as average stature, body composition and morbidity (Popkin, Reference Popkin2003). Popkin (Reference Popkin1994) suggested that the rate of change in diet, physical activity and obesity is greater in developing than developed countries. Changes in diet may have both positive and negative influences on the health of a population. The existing literature suggests the benefits of a diverse diet in improving nutritional quality and child growth in developing countries (Patterson et al., Reference Patterson, Haines and Popkin1994; Ogle et al., Reference Ogle, Hung and Tuyet2001; Ruel, Reference Ruel2002; Arimond & Ruel, Reference Arimond and Ruel2004). A fall in dietary diversity leads to an increase in the proportion of malnourished population (Torlesse et al., Reference Torlesse, Kiess and Bloem2003; Block et al., Reference Block, Kiess, Webb, Kosen, Moench-Pfanner, Bloem and Peter Timmer2004). Ruel (Reference Ruel2002) rightly identified dietary diversity as a promising measurement tool. In India, although the problem of food security has been tackled to some extent, malnutrition is widespread. Therefore it is important to examine the association of changes in food consumption patterns in India with the nutritional status of children. Nutrition transition may thus be another important factor in the change in nutritional status of children. The agro-climatic region in which a state falls, along with individual preference for food, determine household food diversity, which in turn affects the nutritional status of children. In India there are wide variations in climatic conditions and agricultural production, so variations in food consumption patterns and availability should be taken into consideration when analysing the association of nutrition transition with child nutritional status.
Although many studies have reported a number of individual-level factors influencing the nutritional status of children, nutrition transition and its association with health have not been studied (Drewnowski & Popkin, Reference Drewnowski and Popkin1997; Popkin, Reference Popkin1994, Reference Popkin1998; Popkin et al., Reference Popkin, Horton, Kim, Mahal and Shuigao2001). There has been limited research on the association of dietary diversity at the state level as a predictor for child underweight in India. Earlier research has identified maternal, household and child characteristics as potential risk factors for child undernutrition (Pal, Reference Pal1999; Levinson et al., Reference Levinson, Barney, Bassett and Schultink2005; Svedberg, Reference Svedberg2008; Borooah, Reference Borooah2009; Chakrabarty & Anderson, Reference Chakraborty and Anderson2010; Kanjilal et al., Reference Kanjilal, Mazumdar, Mukherjee and Rahman2010; Psaki et al. Reference Psaki, Bhutta, Ahmed, Ahmed, Bessong and Islam2011; Shamsir et al., Reference Shamsir, Ahmed, Roy, Alam and Hossain2012). In view of the significant inter-state variations in the prevalence of underweight, it is clear that the problem of undernutrition in India is not only of alarming magnitude, but also of great complexity. Given the hierarchical nature of the association of various factors with nutritional status, it is important to examine their effect at the different levels at which they operate. This study attempted to answer the following question: what is the association of dietary diversity at the state level with the nutritional status of children in India?
Methods
Data sources
The study used multiple data sources as no single large-scale Indian survey provides data on food consumption and anthropometric information for individuals from the same household.
Food consumption data
Data on household food consumption were obtained from Consumer Expenditure Surveys of the National Sample Survey Organization (NSSO) for three time periods: 50th (1993–94), 61st (2004–05) and 68th (2011–12). These surveys provide information on quantity consumed and expenditure for more than 100 food items. Analysis was based on consumption during a reference period of 30 days prior to the survey. Information on consumption was collected for a range of food items, including cereals, pulses, vegetables, fruits, milk products, egg, meat, sugar, oil, spices and beverages (including tea, coffee, cold drinks, juice).
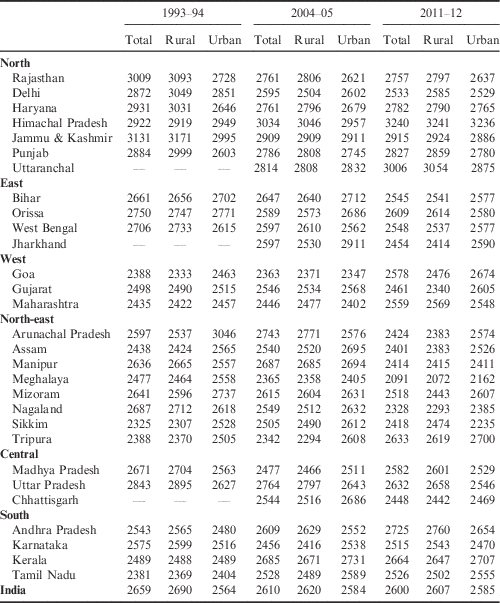
The daily ‘per consumer unit’ calorie intake at the state level for the three time periods was calculated (see Table 1). Per capita intake is calculated by dividing the total intake by household size and doesn’t take into account the age/sex composition of the household. Per consumer unit intake, on the other hand, assigns units depending on the age and sex of the individual, and therefore gives a better representation. Thus consumption per head is corrected by age and sex, with the consumption needs of adults not being weighted in the same way as those for a child. As an example, in a household with two parents and a child, the man counts for 1, the woman for 0.9 (to reflect her lower calorie requirements) and the child for 0.5, which leads to only 2.4 consumer equivalents instead of 3 (see Table 2 for conversion table).
Daily per consumer unit calorie intake in India by state and place of residence, NSSO, 1993–2012

Number of food consumer units assigned by person’s age

Anthropometric data
Child anthropometric indicator data were taken from the third (2005–06) National Family Health Survey (NFHS-3). Children under 6 months of age were excluded, as were those with missing information on height and weight. The final sample thus consisted of 46,887 children aged 6–59 months. Stunting, wasting and underweight were considered as indicators of child nutritional status using the WHO Reference Population (WHO, 2006) for comparison. Children whose z-scores for height-for-age, height-for-weight and weight-for-age fell below −2SD of the median for the reference population were considered to be stunted, wasted and underweight, respectively.
Study variables
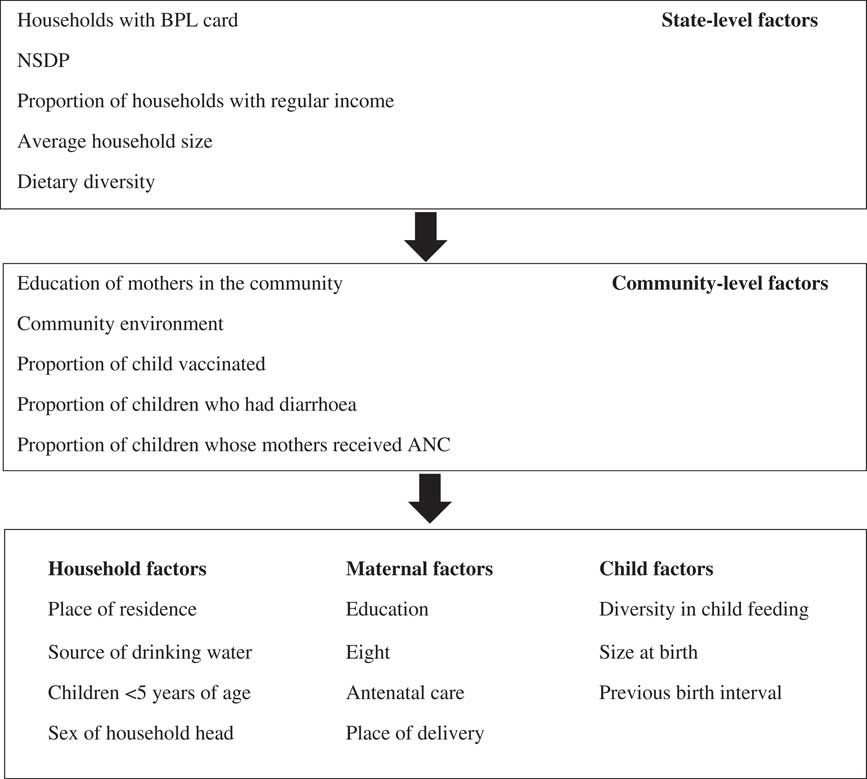
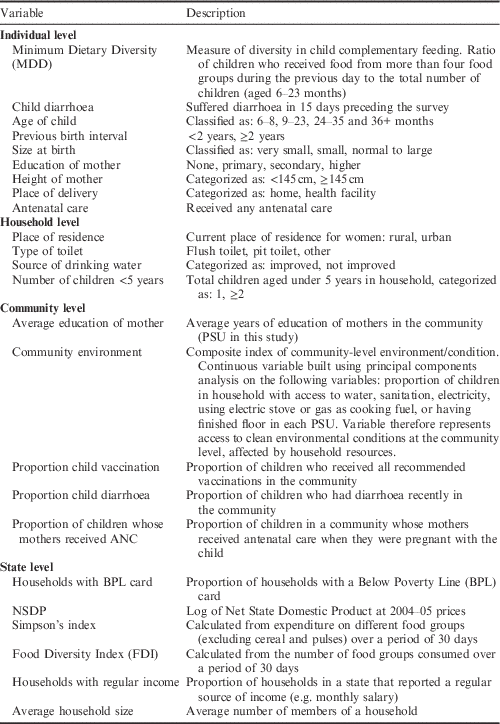
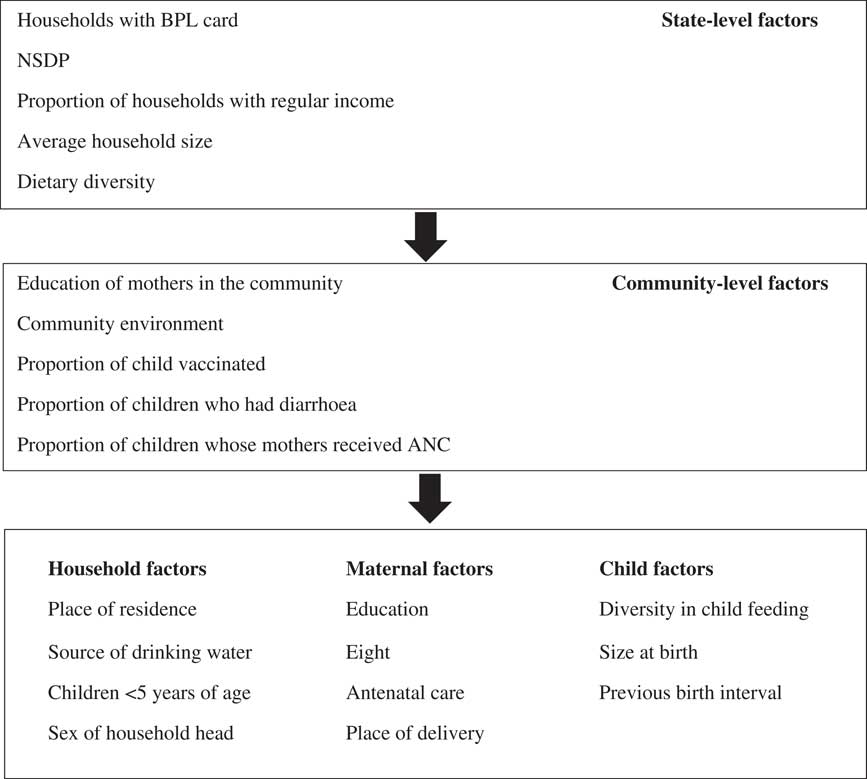
The dependent variables were child underweight (weight-for-age <−2SD), stunting (height-for-age <−2SD) and wasting (weight-for-height <−2SD). The independent variables at individual, household, community and state (contextual) levels are listed, along with their categories, in Table 3; the analytical framework for the study is shown in Fig. 1.
Analytical framework for the study.
Description of study variables

Indian agro-climatic regions
Indian states have been classified by agro-climatic region (Khanna, Reference Khanna1989). District identifiers were not available for the NFHS-3 data. Therefore, the classification of the states was done based on which climatic condition is most applicable to the state. If a state could be classified under two agro-climatic regions then the state was classified in the region that covers the major part of the state. The Western Himalayan Region (WHR) and Eastern Himalayan Region (EHR) follow the same classification as the planning commission, except that West Bengal was not included in the EHR. Delhi, Haryana and Punjab were included in the Trans Gangetic Plain Region (TGPR). The Lower, Middle and Upper Gangetic Plain Region (LMUGPR) comprised Uttar Pradesh, Bihar and West Bengal. Chhattisgarh, Jharkhand and Orissa were placed in the Eastern Plateau and Hills Region (EPHR). Madhya Pradesh and Maharashtra were included in the Central and Western Plateau and Hills Region (CWPHR). The Southern Plateau and Hills Region (SPHR) comprised Andhra Pradesh, Karnataka and Tamil Nadu. Kerala and Goa fell in the West Coast Plains and Ghat Region (WCR). Gujarat (GPHR) was considered to be a separate agro-climatic zone, along with Dadar & Nagar Haveli and Daman & Diu. The major part of Rajasthan (MIR) fell in the Western dry region, and was treated as a separate region although some parts of the state fell in the TGPR and Central Plateau and Hills Region. Andaman & Nicobar Island and Lakshadweep were classified as Island Regions (IR). These agro-climatic regions have been used previously to examine their association with the nutritional status of children (Singh et al., Reference Singh, Pathak, Chauhan and Pan2011).
Dietary diversity indices
Dietary diversity indices were constructed from the NSSO data taking into account quantity of food consumed and pattern of expenditure. The NSSO survey grouped food into nine broad categories: (i) cereals and cereal substitutes; (ii) roots and tubers; (iii) sugar and honey; (iv) pulses and nuts; (v) vegetables, fruits and beverages; (vi) meat, eggs and fish; vii) milk and milk products; (viii) oils and fats; (ix) miscellaneous food/food products. Foods were further classified into eleven groups: cereal and cereal products; pulses; fruits; vegetables; milk products; eggs, fish & meat; sugar; oil; processed food; and ‘other’. Food consumption data were based on a reference period of 30 days prior to the survey. Cereals and pulses were excluded from the calculation of diversity indices as these are assumed to be consumed throughout the country irrespective of region, residence and economic condition of the household.
Dietary diversity indices were calculated for three time periods of the Consumer Expenditure Survey, and the average value of the indices was used in the multilevel analysis.
The Food Diversity Index (FDI) was calculated as follows:
 $${\rm FDI}_{{it}} \,{\equals}\, \mathop \sum\limits_{j\,{\equals}\,1}^n S_{{jit}}^{2} $$
where FDI it is the food diversity index for state i at time t and S jit is the proportion of commodity j of the total food consumption of the household in the reference period (30 days). A high value of the index implies a less diverse food basket and vice versa (Gaiha et al., Reference Gaiha, Kaicker, Imai, Kulkarni and Thapa2012).
A second index of food diversity (Simpson’s index) was also calculated:
 $${\rm Simpson’s \ index}\,{\equals}\,1{\minus} \mathop \sum\limits_i w_{i}^{2} $$
where w i is the proportion of expenditure on food group i to total food expenditure of the household for the reference period (30 days). Simpson’s index has a value of between zero and one: the higher the index, the more diversified the diet (Nguyen & Winters Reference Nguyen and Winters2011). Simpson’s index is based on expenditure on the same food groups used to calculate the FDI. The variation in prices of different food items was controlled with the help of the Consumer Price Index (CPI).
Analysis
In order to maintain hierarchy in the data, and to avoid underestimation from a single-level model, multi-level regression analysis was used to examine the determinants of child nutritional status. Three-level multilevel regression analysis was performed with individuals and households within the community, and community within the states as lowest to highest levels. The dietary diversity indices (FDI and Simpson’s index) are used as indicators of state-level dietary diversity and its association is examined with nutritional status of children.
Due to the stratified nature of data in the NFHS, children were nested into mothers, mothers were nested into households, households into Primary Sampling Units (PSUs) and PSUs into states. Multilevel logistic regression models were estimated with a log-link function to analyse the factors associated with underweight and stunting for children aged 6–59 months. Multilevel regression coefficients were estimated using Markov Chain Monte Carlo (MCMC) estimation procedures. Proximate determinants were grouped at different hierarchical levels, i.e. individual/household, community and state levels.
 $$ln\left[ {{{\pi _{{ijk}} } \over {1{\minus}\pi _{{ijk}} }}} \right]\,{\equals}\,\alpha {\plus} \beta x_{{ijk}} {\plus} \gamma w_{{jk}} {\plus}\delta z_{k} {\plus}\mu _{{jk}} {\plus}\vartheta _{k} $$
where
 $ln\left[ {{{\pi _{{ijk}} } \over {1{\minus}\pi _{{ijk}} }}} \right]$
is the logit in which π
ijk
is the probability of stunting/wasting/underweight for child i in community (PSU) j and state k. The terms x
ijk
, w
jk
and z
k
are vectors of individual/household-, community- and state-level characteristics; α is a constant, β and γ are vectors of estimated parameter coefficient and μ
jk
and
 $\vartheta _{k} $
are unexplained residual terms at community and state level.
Thus a three-level model was fitted to examine the influence of individual/household-, community- and state-level factors as fixed effects and μ
jk
and
 $\vartheta _{k} $
as community- and state-level random effects on the three indicators of child nutritional status (stunting/wasting/underweight).
Six models were used. In Model I (the null model) the indicator of nutritional status was the dependent variable with no covariates. Model II included agro-climatic regions; Model III included household, maternal and child characteristics; Model IV included community-level factors; Model V included state-level variables. Finally, Model VI was the full model with all the covariates at the respective levels. The models were three-level random intercept models with two clusters: state and community. The covariates were included in the analytical models with the aim of isolating the effect of contextual and socioeconomic factors on the nutritional status of children.
The fixed effects, i.e. measures of association, are presented as odds ratios (ORs) with corresponding 95% credible intervals. Measures of random effects included intra-cluster correlation (ICC) and proportional change in variance (PCV).
Results
Dietary diversity at the state level: quantity consumed
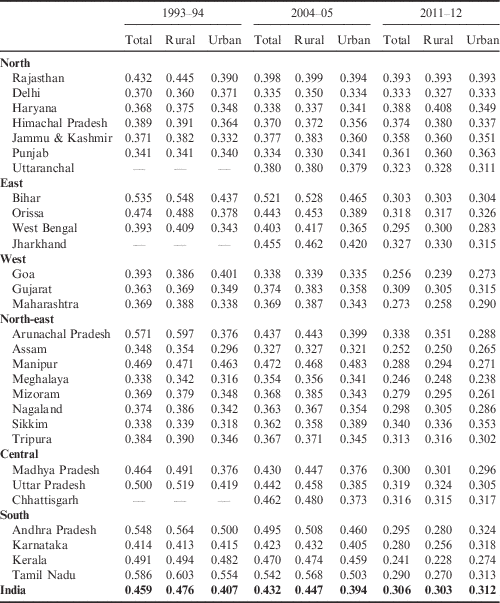
The results for dietary diversity based on quantity of food consumed in the 30-day reference period are given in Table 4 by state and rural/urban residence for the three time periods (1993–94, 2004–05 and 2011–12). A lower value of the Food Diversity Index (FDI) indicates high diversity. The FDI for the whole of India was 0.459 in 1993–94 and 0.306 in 2011–12, indicating that dietary diversity has increased in India over time. In 1993–94, Meghalaya and Sikkim (0.338 each) had the lowest values of FDI, indicating highest dietary diversity, followed by Punjab (0.341), Assam (0.348) and Gujarat (0.363). On the other hand, lowest dietary diversity was observed in Tamil Nadu (0.586) followed by Arunachal Pradesh (0.571), Andhra Pradesh (0.548) and Bihar (0.535). In 2011–12 Kerala had the most diverse diet (0.241), followed by Meghalaya (0.246), Assam (0.252) and Goa (0.256). The lowest dietary diversity, on the other hand, was observed in Rajasthan (0.393), Haryana (0.388) and Himachal Pradesh (0.374). The highest increase in dietary diversity was observed in the three southern states of Kerala, Tamil Nadu and Andhra Pradesh. On the other hand, dietary diversity declined in Punjab and Haryana during 1993–2012.
Food Diversity Index (FDI) by Indian state and place of residence, NSSO Consumer Expenditure Survey, 1993–2012

The FDI in rural areas declined from 0.476 (1993–94) to 0.447 (2004–05) and 0.303 (2011–12). Dietary diversity was highest in Sikkim, followed by Punjab and Meghalaya, in 1993–94. In 2011–12, dietary diversity was highest in Andhra Pradesh followed by Arunachal Pradesh and Assam. On the other hand, dietary diversity was lowest in Tamil Nadu and West Bengal in 1993–94 and 2011–12, respectively, for the rural areas. Similarly, in urban areas, the FDI changed from 0.407 (1993–94) to 0.394 (2004–05) and 0.312 (2011–12). In the urban areas, dietary diversity was highest in the three north-eastern states, i.e. Assam, Meghalaya and Sikkim, in 1993–94. In 2011–12, dietary diversity was also highest in the north-eastern states of Meghalaya, Mizoram, Assam and Manipur. The lowest dietary diversity was seen in Tamil Nadu and Andhra Pradesh in 1993–94, whereas Rajasthan and Punjab had the lowest dietary diversity in 2011–12. Although the ranking of the states has changed, dietary diversity has increased in the majority of states over time.
Dietary diversity at the state level: expenditure on food
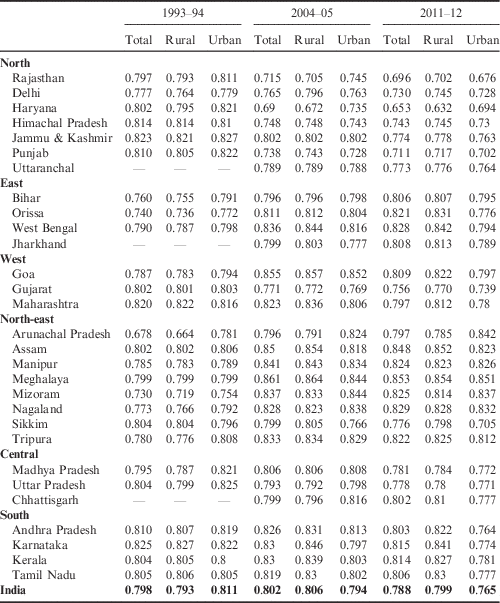
Dietary diversity was also examined based on expenditure on different food groups using Simpson’s index (see Table 5). The value of Simpson’s index increased initially from 0.798 (1993–94) to 0.802 (2004–05) and then declined to 0.788 (2011–12). In rural areas Simpson’s index increased in 2004–05 and then declined in 2011–12. However, urban areas show a consistent decline in diversity in food expenditure. In 1993–94 the highest diversity was seen in Karnataka (0.825) followed by Jammu & Kashmir (0.823) and Maharashtra (0.820). The lowest diversity was identified in Arunachal Pradesh (0.678). In 2011–12, highest diversity in food expenditure was seen in Meghalaya (0.853) followed by Assam (848), and the lowest diversity was seen in Haryana (0.653). In the urban areas in 1993–94, Jammu & Kashmir (0.827) had the highest diversity followed by Uttar Pradesh (0.825). In the rural areas, Karnataka (0.827) had the highest diversity followed by Maharashtra (0.822) and Jammu & Kashmir (0.821); the lowest was observed in Arunachal Pradesh (0.664). In 2011–12 Meghalaya had the highest diversity in the all India (0.799), urban (0.851) and rural (0.854) areas.
Simpson’s index of dietary diversity based on per capita expenditure by state and place of residence, 1993–2012

Multilevel regression analysis
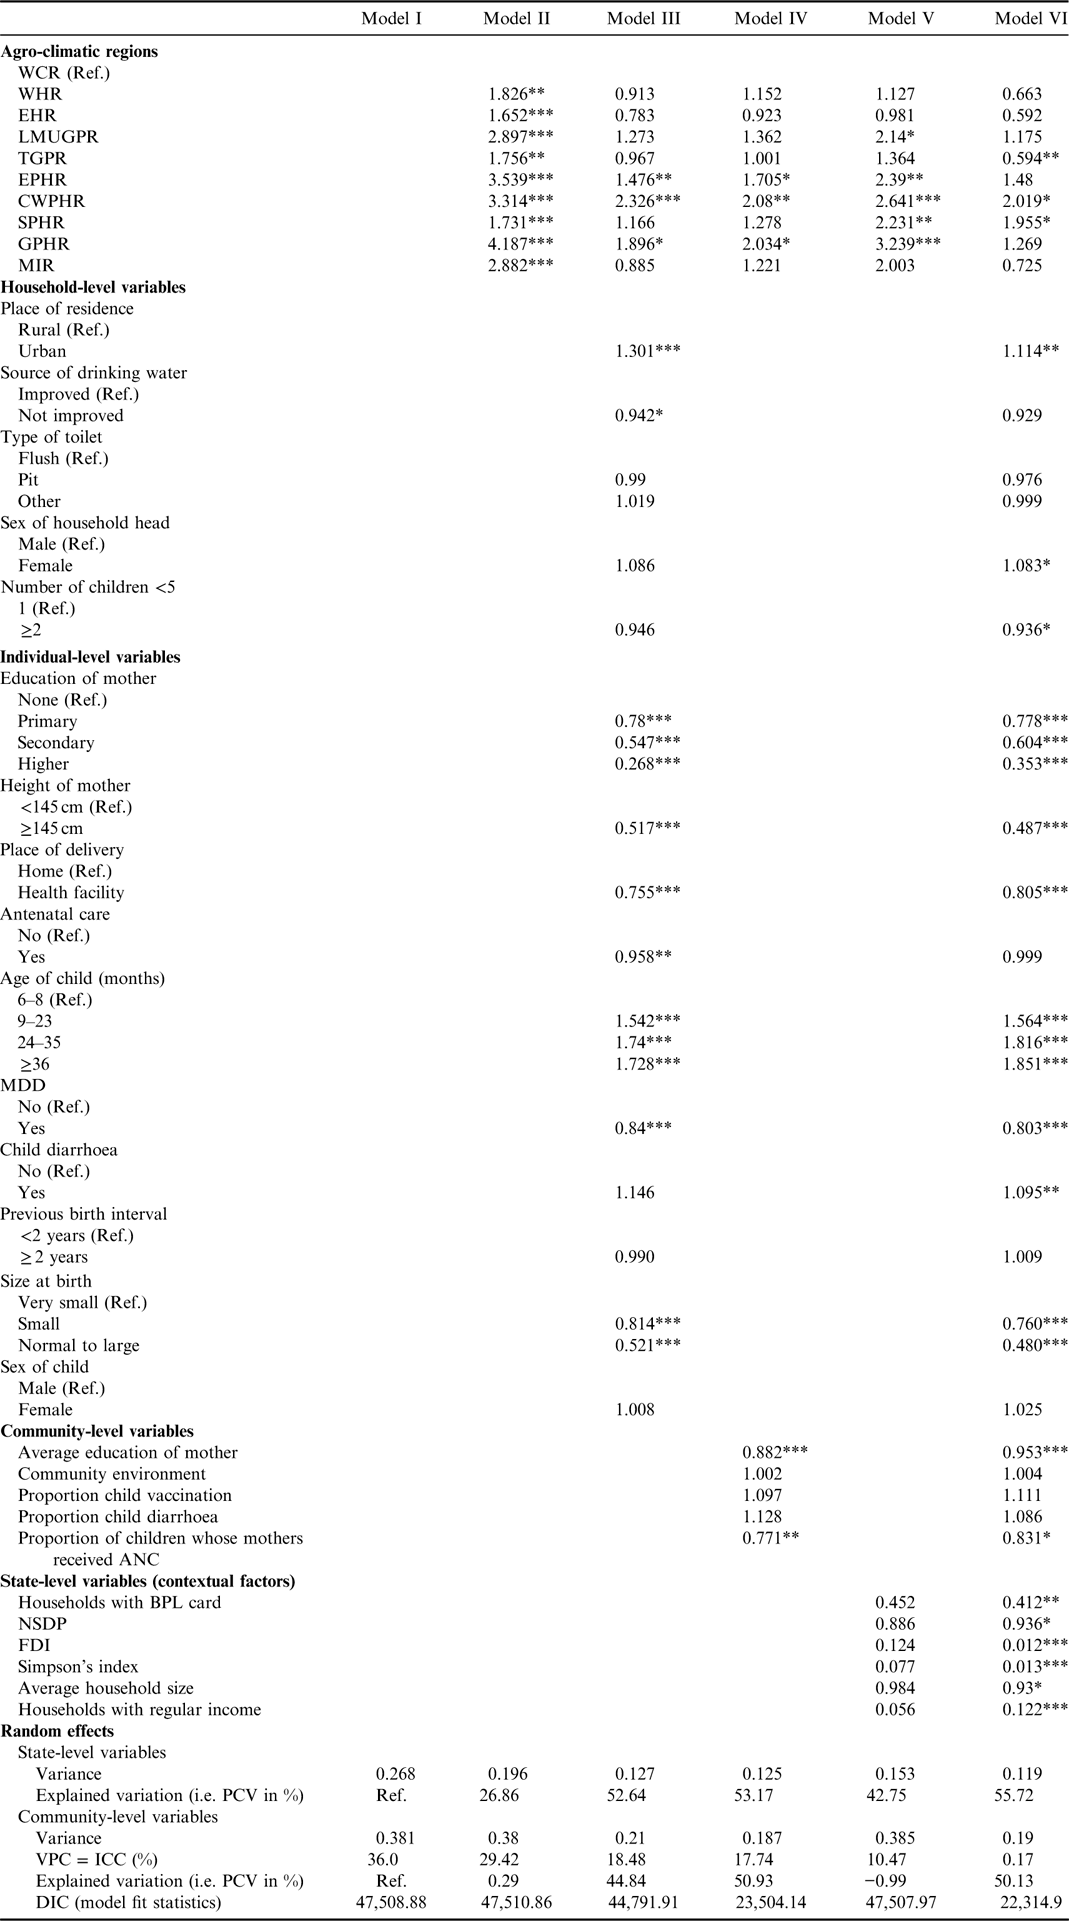
Six models were used to examine the effect of state-level dietary diversity scores and other socioeconomic determinants on child underweight by agro-climatic region (Table 6). The results of the null model (Model I) showed a significant variation in child underweight at community and state levels. Intra-class correlations (ICCs) of 6.8% and 36%, respectively, were found for child underweight at the state and community levels.
Multilevel regression on the association of socioeconomic and contextual factors with underweight among children aged 6–59 months, India, 2005–06

WCR: Western Coastal Region; WHR: Western Himalayan Region; EHR: Eastern Himalayan Region; LMUGPR: Lower, Middle and Upper Gangetic Plain; TGPR: Trans Gangetic Plain Region; EPHR: Eastern Plateau and Hills Region; CWPHR: Central and Western Plateau and Hills Region; SPHR: Southern Plateau and Hills Region; GPHR: Gujarat Plain and Hill Region; MIR: Major part of Rajasthan.
***p<0.01; **p<0.05; *p<0.10.
Model II shows the effect of the agro-climatic region on the odds of child underweight. Compared with children in the Western Coastal Region (WCR), children in other agro-climatic regions were more likely to be underweight. Children from GPHR (OR=4.19) and EPHR (OR=3.54) were at higher risk of being underweight than those from other regions compared with WCR. Comparing measures of variation in the null model and regions model, the inclusion of agro-climatic region of residence as a covariate in the multilevel model revealed significant variance by community and state. As indicated by the proportional change in variance (PCV), 27% of the variance in child underweight across states was explained by region of residence.
After the inclusion of household, maternal and child characteristics in the model (Model III), only EPHR and CWPHR showed significantly higher risks of underweight for children than the WCR. In comparison with the null model, after incorporating household-, maternal- and child-level covariates in the model, the measures of variation remained significant across communities, with ICC estimated at 18.5% and 3.5% across community and state levels, respectively.
Selected community-level variables were included in Model IV. The proportion of educated mothers and the proportion of children whose mothers received antenatal care were two significant factors associated with child underweight. After inclusion of community-level variables in the model, the measures of variation remained significant across communities, with ICC estimated at 18% and 3.5% at community and state levels, respectively.
State-level covariates were considered in Model V. After incorporating only state-level factors into the multilevel models, the odds of child underweight remained significantly higher in the GPHR, CWPHR, SPHR and EPHR than the WCR. In addition, the dietary diversity of the state, proportion of households with a regular salary, NSDP and proportion of households living below the poverty line were significantly associated with child underweight. Values of ICC of 4.4% and 10.4% across state and community levels, respectively, were associated with odds of child underweight.
In the full model (Model VI), all selected factors were incorporated. The results indicate that state-level variables, including proportion of households with a BPL card, log NSDP, Simpson’s index, FDI, average household size and proportion of household with a regular salaried income, had a significant association with child underweight. Moreover, education of mother and proportion of children whose mothers received antenatal care were significant predictors of child underweight. Among the household- and individual-level factors, age of the child, recent incidence of diarrhoea, diversity in child feeding (MDD) and height and education of the mother were important predictors of child underweight. Also, more than 50% of variation in child underweight could be explained by state- and community-level factors, compared with the null model.
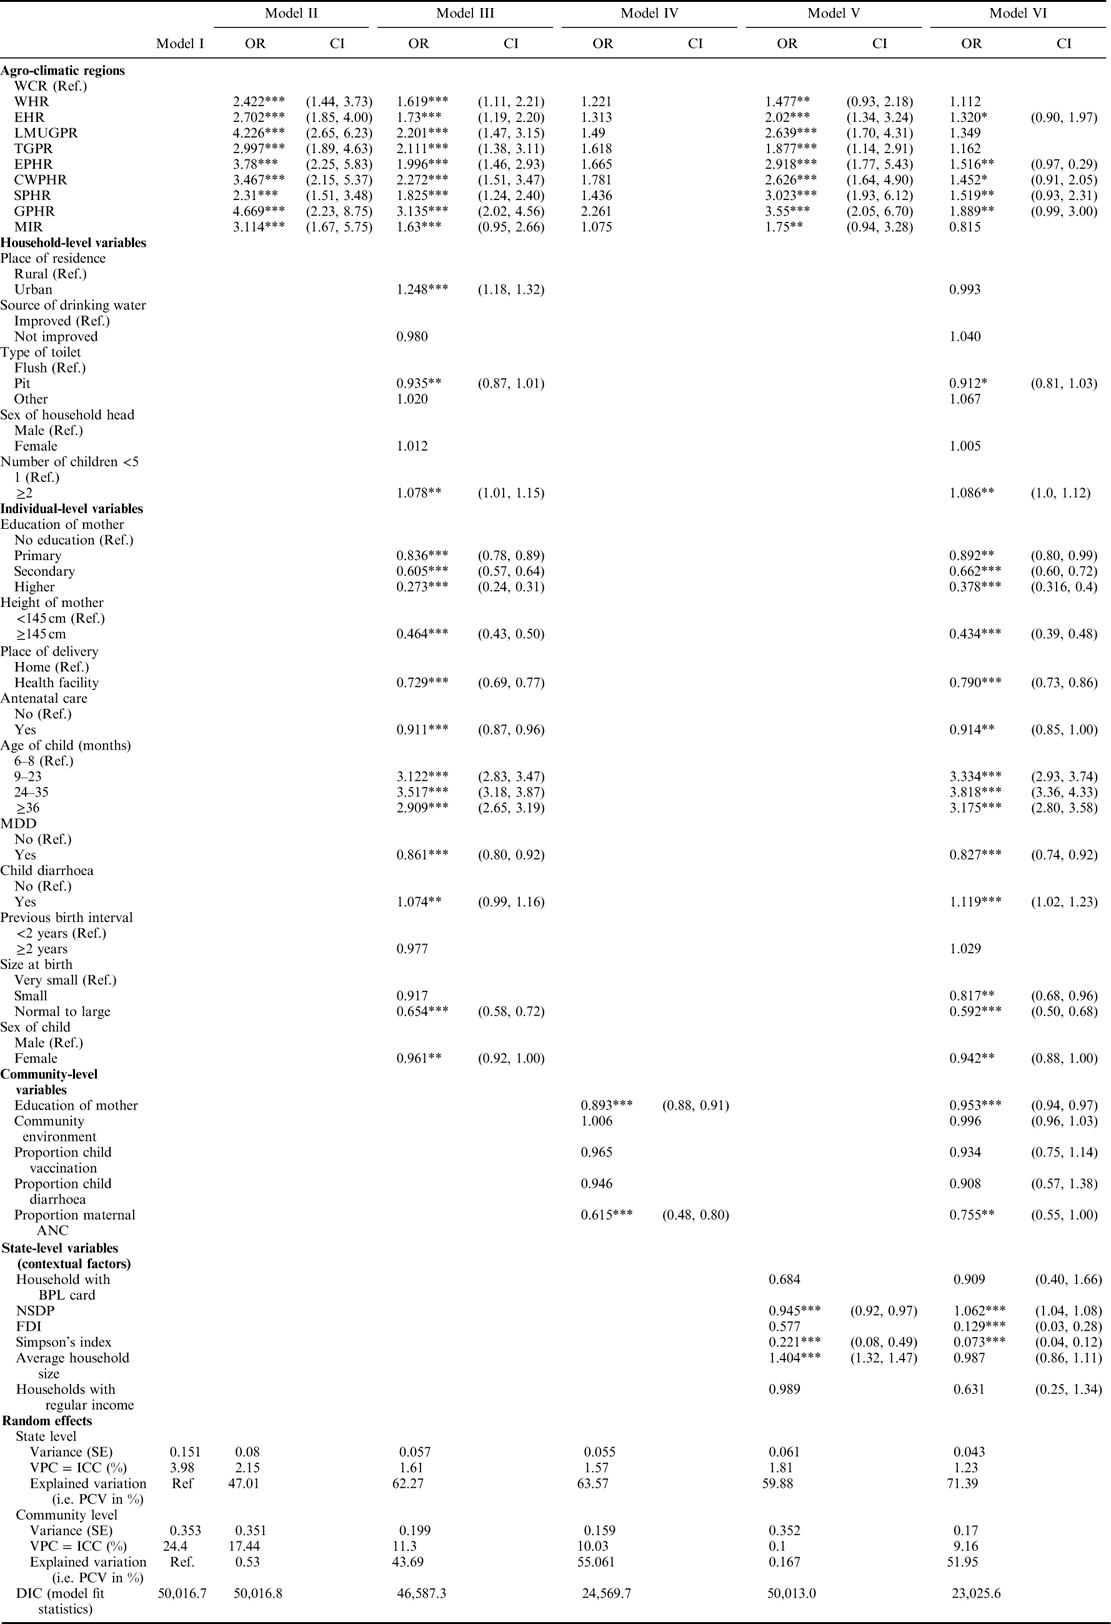
The analysis on stunting indicated that ICC values of 4% and 24% are explained by state- and community-level factors, which justifies the use of multilevel regression to examine child stunting (Table 7). The inclusion of agro-climatic region in the model showed that 17% of the variation in stunting among children could be explained by community-level factors. The model with only the community-level variables showed that ICC at 10% is associated with community level. Overall, the full model showed that 9% ICC was associated with community-level factors. The analysis shows that state-level dietary diversity and NSDP are significant predictors for stunting. Among the community-level factors, education of mother and proportion of children whose mothers received antenatal care were significantly associated with stunting. Furthermore, diversity in child feeding, a recent episode of diarrhoea, height and education of mother, place of delivery and antenatal care were significantly associated with stunting among children.
Multilevel regression on the association of socioeconomic and contextual factors with stunting among children aged 6–59 months, India, 2005–06

See footnote to Table 6 for definition of abbreviations.
***p<0.01; **p<0.05; *p<0.10.
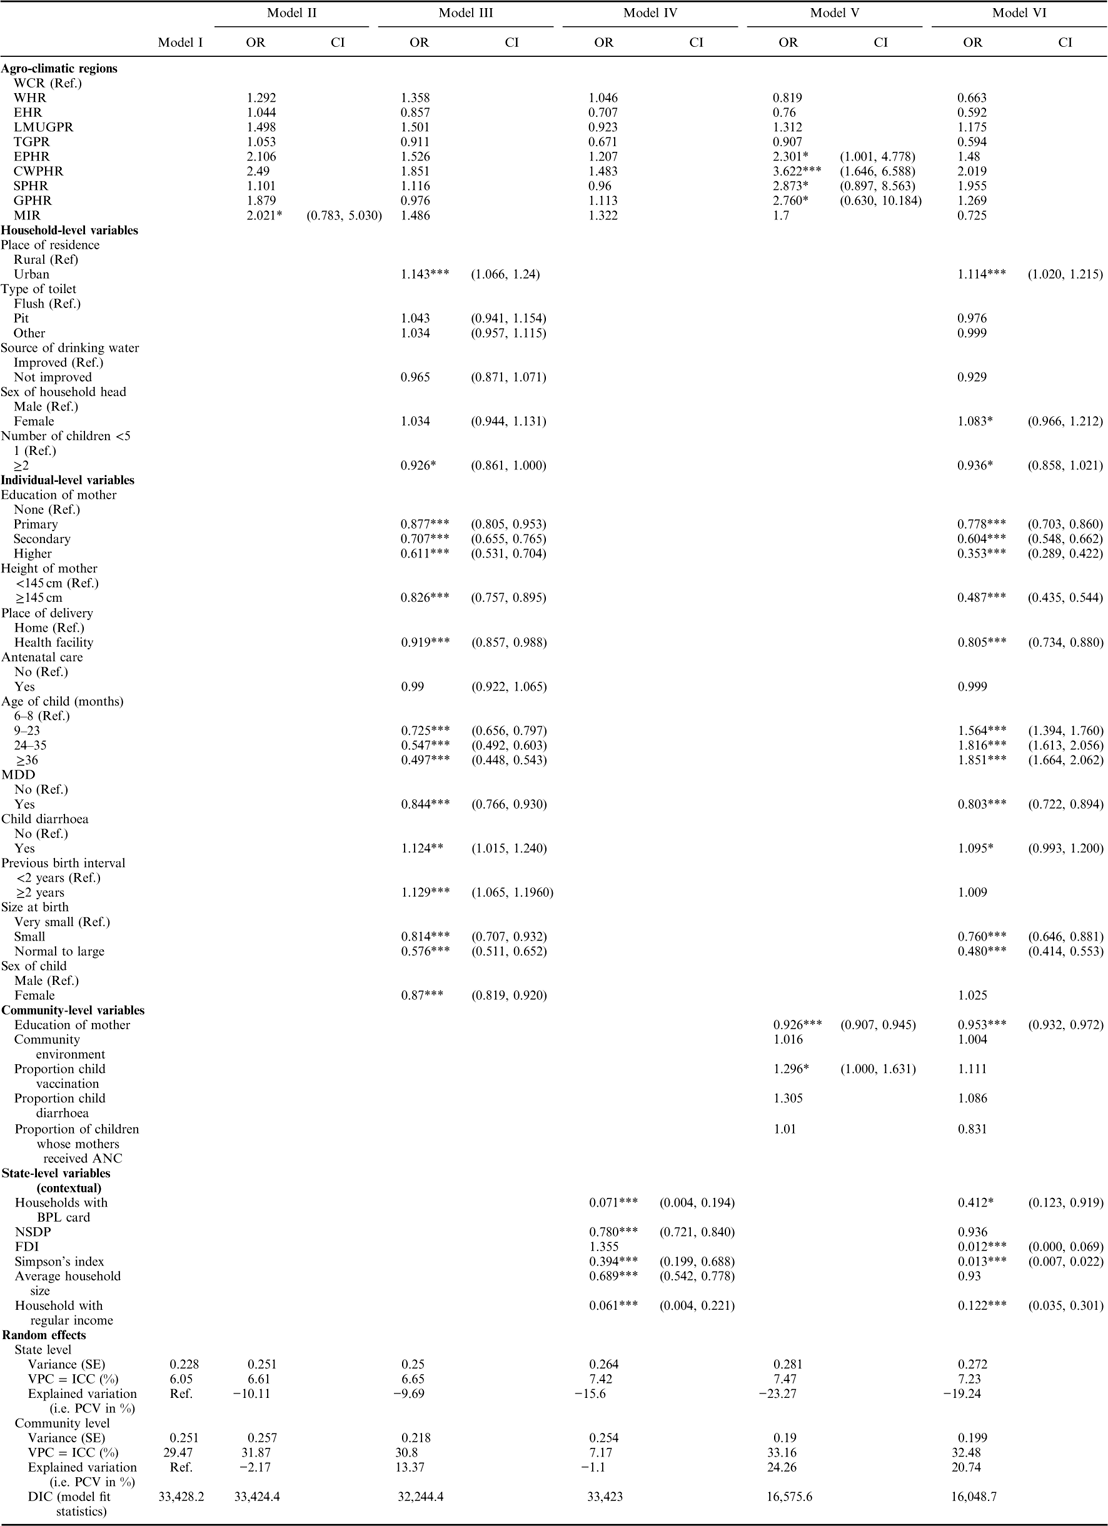
The multilevel analysis on wasting among children aged 6–59 months suggests that intra-class correlations (ICCs) of 6% and 29% at the state and community levels, respectively, could be explained by state- and community-level factors (Table 8). The FDI is a significant predictor for low weight-for-height among children, as is education of mother in a community. Place of residence, place of delivery and height of mother are the other household- and individual-level factors associated with wasting among children.
Multilevel regression on the association of socioeconomic and contextual factors with wasting among children aged 6–59 months, India, 2005–06

See footnote to Table 6 for definition of abbreviations.
***p<0.01; **p<0.05; *p<0.10.
Discussion
The percentage of malnourished children in India is higher than that in many other countries with similar levels of socioeconomic development, and is also among the highest in the world. There is therefore an urgent need to identify the factors associated with child malnutrition. To date, the existing literature has focused on household socioeconomic factors as determinants of child malnutrition, but changes in food consumption patterns could be another important determinant.
In India, changes in food consumption patterns occurred after the ‘green revolution’ (Kohli & Singh, Reference Kohli and Singh1997; Verma et al., Reference Verma, Datta, Mandal and Tripathi2008). It is important to identify how the food consumption pattern of the country affects children. Most existing studies have examined the association of individual food consumption with nutritional status indicators, and few have studied the effect of macro-level food diversity. Therefore, this study examined the trend in dietary diversity in India, and its association with the nutritional status of children under the age of five.
The study extracted information on food consumption from a household survey to examine state-level dietary diversity and its association with the nutritional status of children in India. The study found that calorie intake has declined in India over time. The economic condition of the household may be an important factor for the reduction in calorie intake, with high-income households spending more on foods rich in nutrients and the poor only spending on basic requirements. Although total calorie intake has declined in India, average per consumer unit calorie intake is above the recommended level of consumption. Simultaneously, total calorie intake in urban areas has increased.
The study examined the association of dietary diversity at the household and state level with the nutritional status of children. Two approaches were used to examine state-level dietary diversity; i) the proportion of each food group to the total food consumption basket, and ii) the share of each food group in total food expenditure. An improvement in dietary diversity based on the quantity of each food group to total food was observed. The indicator based on proportion of expenditure showed a decline in diversity in urban areas over time. Diversity declined in Punjab and Haryana during 1993–2012, but daily per consumer unit calorie intake remained above the recommended level. Punjab and Haryana contribute the highest share of rice and wheat production in India, so it is possible that in these states total calorie intake is dominated by these two food items and their ‘food basket’ is not diverse. On the other hand, it was found that dietary diversity has increased in Kerala, Tamil Nadu and Andhra Pradesh, with a simultaneous increase being observed in total calorie intake. Thus it may be said that high calorie intake does not indicate greater dietary diversity, and should be measured with more appropriate indicators.
The food consumption pattern at the state level is influenced by many factors such as climatic conditions, production of different food items and the proportion of poor and non-poor households in the state. All possible state socioeconomic indicators were therefore included in the analysis. Different models were applied to maintain the hierarchy when examining the association of factors with the three indicators of nutritional status of children (stunting, wasting and underweight).
Compared with the Western Coastal Region (WCR), other agro-climatic regions had higher risks of underweight and stunting, but no significant association was observed for wasting. After adding household-level factors to the model, all regions had a significant association with stunting; only EPHR and CWPHR had a significantly higher risk of child underweight, and no significant association was observed for wasting. After adding the community variable the regional effect on nutritional indicators disappeared. After adding all the variables in the full model, agro-climatic regions had a significant association with stunting and underweight, but no significant association with wasting.
The multilevel analysis found that state dietary diversity was significantly positively associated with reduction in child stunting, wasting and underweight. The information on food consumption available in the Consumer Expenditure Survey was at the household level, so a high dietary diversity index indicates a high proportion of households with a diverse diet. The study results confirm that diverse food consumption in a state is significantly associated with improved nutritional status of children. The findings further show that the proportion of households with a regular income is significantly positively associated with reducing low weight-for-age and low weight-for-height of children. Moreover, Net State Domestic Product (NSDP) was significantly positively associated with low weight-for-age and low height-for-age among children. Hadad et al. (Reference Haddad, Alderman, Appleton, Song and Yohannes2002) suggested that greater income at the state level leads to higher quality health care and improved water and sanitation systems. Other studies have also observed a positive association of GDP with a reduction in child undernutrition (Subramanyam et al., Reference Subramanyam, Kawachi, Berkman and Subramanian2011; Harttgen et al., Reference Harttgen, Klasen and Vollmer2013). Madise et al. (Reference Madise, Matthews and Margetts1999) suggested that regional economic development is an important source of variation in weight-for-age z-scores in pre-school children. It is assumed that economic growth will improve the income of the poor, thus increasing the diversity of their diet leading to improved nutritional status (Ravallion, Reference Ravallion1990). Vollmer et al. (Reference Vollmer, Harttgen, Subramanyam, Finlay, Klasen and Subramanian2014), on the other hand, reported a null or very small association of increases in per capita GDP and reductions in early childhood undernutrition.
Griffiths et al. (Reference Griffiths, Madise, Whitworth and Matthews2004) observed that individuals are influenced by national policies on health, agriculture, economics and the environment. These factors, along with the household economic condition, guide food choice at the household level, which impacts the nutritional status of children. This study also observed that community-level factors, such as the education of mother, make an important contribution to the nutritional status of children. Communities where mothers have high average years of education tend to have better anthropometric indicators among children. Additionally, a high proportion of mothers receiving antenatal care significantly reduces the risk of children being underweight, stunted or wasted. This finding implies that care during pregnancy has a long-term impact on the health of children.
Diversity in complementary feeding also had significant association with the three indicators of nutritional status of children. Earlier studies in India have identified a significant association of caste/tribe of the household with the nutritional status of children, but the present study focused primarily on the hierarchy of the covariates in assessing nutritional status. Therefore, the interaction factor was excluded from the analysis. The World Health Organization have recommended guidelines for the complementary feeding of children. This study observed that if children were fed according to the WHO guidelines they were less likely to be undernourished, and this has been supported by other studies (Nair, Reference Nair2007). Sex of the child was significantly associated with stunting, but not with underweight or wasting. Additionally, education of mother was another significant determinant of nutritional status of children. It was also observed that, after controlling the effect of all the factors in the multilevel analysis, macro-level indicators had a higher level of association with the indicators of nutritional status than the individual-level indicators.
In conclusion, this study observed that dietary diversity has increased in India over time, although total calorie intake has declined. It also found a significant association between state dietary diversity and the nutritional status of children. Increased self-sufficiency of the state in multi-grain production would not only increase dietary diversity but also improve the nutritional status of children. The findings highlight the need to look beyond the conventional indicators of the nutritional status of children and concentrate on improving dietary diversity within states and regions. Diversity in complementary feeding also affects the nutritional status of children, so increasing the awareness of the recommended WHO guidelines among mothers would help improve the nutritional status of children. The study also observed that providing recommended antenatal care has a long-term impact on the nutritional status of children.
Improving the food consumption pattern at the state level, better education of mothers, provision of antenatal care and increasing diversity in complementary feeding are the crucial indicators to bring down the percentage of malnourished children in India. There should be greater focus on increasing dietary diversity rather that increasing calorie intake.