I. INTRODUCTION
Vapochromic materials are promising candidates for intelligent devices, such as “electronic noses” that can detect volatile organic compounds (VOCs) in the environment. Ideally, such materials would not only detect VOCs below the parts per million (ppm) level, but would also show a unique response for each VOC. Of particular interest are responsive compounds that show dramatic and reversible color changes upon exposure to VOCs. These materials exhibit reversible structural changes triggered by vapor uptake, which are accompanied by a dramatic color change of the solid allowing the detection of VOCs even by naked eye. This has been demonstrated with various metal compounds, such as Pt(II)-containing cyclometalated complexes. One approach to assemble these complexes is to utilize coordination polymerization reactions, by tuning the bond strength with appropriate assembly of metal ions and coordinating Pt(II) and Pd(II) metalloligands (Daws et al., Reference Daws, Exstrom, Sowa and Mann1997; Buss et al., Reference Buss, Anderson, Pomije, Lutz, Britton and Mann1998; Wenger, Reference Wenger2013; Kobayashi and Kato, Reference Kobayashi and Kato2014). Coordination polymers [K(H2O)][Pt(ppy)(CN)2] and [K(H2O)][Pt(bzq)(CN)2] (where ppy = 2-phenylpyridinate and bzq = 7,8-benzoquinolate) are two examples of anionic complexes exhibiting vapochromism. These monohydrate-potassium salts are soluble in water and vary in color, Pt(ppy) being purple and Pt(bzq) being red (Forniés et al., Reference Forniés, Fuertes, López, Martín and Sicilia2008). Upon heating to 110 °C, these compounds lose the crystal water and experience a change in color from purple [Pt(ppy)] or red [Pt(bzq)] to yellow. When the anhydrous species are exposed to the air, they undergo inverse changes of color within seconds due to water molecules uptake. The origin of this vapochromic behavior is thought to be related to the altered metallophilic Pt–Pt interactions upon solvent absorption. However, so far only the Pt(ppy) precursor complex has been structurally characterized (Forniés et al., Reference Forniés, Fuertes, López, Martín and Sicilia2008). In this study, in situ Pair Distribution Function (PDF) measurements were performed at the Brookhaven National Laboratory by varying the temperature on the sample. The dynamics of the structural changes for each of the four compounds studied here were characterized via multivariate analysis of the PDF data (Caliandro and Belviso, Reference Caliandro and Belviso2014). The structural information obtained provides further insight into strategies to achieve engineered vapochromic complexes, which selectively and rapidly respond to specific vapors in small quantities.
II. SAMPLES DESCRIPTION AND SPECTROSCOPIC CHARACTERIZATION
Compounds [K(H2O)][Pt(ppy)(CN)2] and [K(H2O)][Pt(bzq)(CN)2] were prepared according to what reported in Forniés et al. (Reference Forniés, Fuertes, López, Martín and Sicilia2008), and characterized by infrared (IR),1H NMR, and UV–vis spectroscopy. Especially significant are the presence in their IR of two ν CN absorptions about 2100 and 2120 cm−1, corresponding to two terminal CN ligands in a cis arrangement and a strong absorption at 3400 cm−1 indicative of the presence of water in the solid (Forniés et al., Reference Forniés, Fuertes, López, Martín and Sicilia2008). The amount of water can be determined from their proton nuclear magnetic resonance (1H NMR) spectra in non-water containing acetone-d 6, which in addition to the signals corresponding to the bzq or ppy group show one signal at about 2.9 ppm, corresponding to one molecule of water (Forniés et al., Reference Forniés, Fuertes, López, Martín and Sicilia2008).
The UV–vis spectra of each one of these compounds in the solid state show intense absorptions at λ < 450 nm assigned to IL/MLCT transitions and an intense absorption at λ = 564 nm [Pt(ppy)] or 548 nm [Pt(bzq)] (Forniés et al., Reference Forniés, Fuertes, López, Martín and Sicilia2008). The latter is assigned to 1MMLCT [dσ*(Pt) → π*(CN)] transitions, and it is the responsible for the intense color showed by these compounds; it also is considered as the fingerprint of the existence of short Pt · Pt contacts (3.0–3.5 Å) in the z-axis.
Upon heating compounds [K(H2O)][Pt(ppy)(CN)2] and [K(H2O)][Pt(bzq)(CN)2] in the oven at 110 °C, the anhydrous species were obtained, which exhibit a yellow color. The absence of water in the solid can be probed by IR and 1H NMR spectra in non-water containing acetone-d 6.
Their UV–vis spectra in the solid state show the absence of the lowest energy absorption assigned to the 1MMLCT transitions, being indicative of the profound structural changes operating in the solids by the loss of the water molecules.
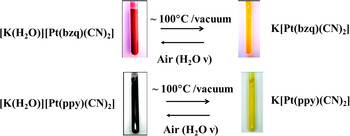
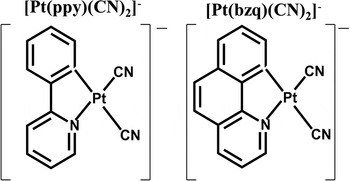
The observed color changes for the Pt(bzq) and Pt(ppy) samples are summarized in Figure 1. Vapochromic transitions manifest themselves with dramatic color changes, and can be achieved by heating the samples or putting them in vacuum. Reverse transitions are obtained by allowing water molecules in air to interact with the powder sample. The Pt ligands are depicted in Figure 2. They exhibit very similar structure, with only two added carbon atoms present in bzq, which complete a third aromatic ring. Samples were mounted on quartz capillaries of 1 mm diameter for X-ray diffraction experiments.
(Color online) Scheme of the color and external conditions related to the vapochromic transition for the two compounds studied.

Scheme of the two Pt-based compounds considered in this study.

III. DIFFRACTION EXPERIMENTS
A. Data collection
X-ray data were collected at the X17A beamline of the National Synchrotron Light Source (NSLS) at the Brookhaven National Laboratory with an X-ray energy of 66.7 keV (0.185 97 Å) and 0.5 × 0.5 mm2 beam size. A large two-dimensional (2D) Perkin Elmer area detector (2048 × 2048 pixels and 200 × 200 µm2 pixel size) was mounted orthogonal to the beam path, 202 mm downstream from the sample. Lanthanum hexaboride was measured as standard material to calibrate the sample and detector geometry, including the sample-to-detector distance. The temperature was first increased from 20 to 150 °C, and then decreased to 20 °C by using a cryo-cooler. A step of 5 °C was done every 10 min, during which a complete measurement and a monochromator realignment were automatically performed. Each data collection lasted about 2 min, and in the remaining 8 min the X-ray shutter was closed to avoid radiation damage of the samples. An empty capillary was measured for background estimation.
B. Data analysis
Raw 2D data were azimuthally integrated and converted into 1D intensity versus 2ϑ and versus momentum transfer Q = 4π sin ϑ /λ by using the FIT2D program (Hammersley et al., Reference Hammersley, Svensson, Hanfland and Hauserman1996). PDF profiles were calculated from the Q profiles by the program PDFGetX3 (Juhás et al., Reference Juhás, Davis, Farrow and Billinge2013). Time-dependent PDF profiles were processed by the program RootProf (Caliandro and Belviso, Reference Caliandro and Belviso2014) to perform qualitative analysis through principal component analysis (PCA). It is a projection method (Wold et al., Reference Wold, Esbensen and Geladi1987), which can be used to reduce the dimensionality of the data set constituted by the measured profiles. Principal components (PCs) are calculated as eigenvectors of the covariance matrix of the data, whose eigenvalues represent the variance of the data along the eigenvector directions. The initial dimensionality of the data set, equal to the number of 2θ values used to describe the diffraction profiles (N), is reduced to n, representing the number of PCs used. Score and loading vectors are two alternative representations of the data matrix: the former carry information about samples (measurements) in variable (2θ) space, the latter about variables in sample space.
IV. RESULTS AND DISCUSSION
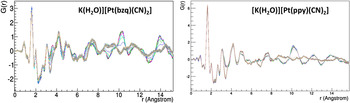
PDF profiles obtained at different temperatures for sample Pt(bzq) and Pt(ppy) are superimposed in Figure 3, where abrupt changes can be revealed, indicating the occurrence of relevant structural changes in the compounds. It is worthwhile noticing that variations in the PDF profiles manifest themselves for interatomic distances above 3 Å, while an almost perfect overlap occurs at shorter distances. As suggested by Rademacher et al. (Reference Rademacher, Daemen, Chronisterc and Proffen2012), the PDF profiles can be ideally divided into three regions: below 3 Å, where only intramolecular distances are present; between 3 and 8 Å, where intra-molecular and intermolecular distances overlap, and beyond 8 Å, where only intermolecular distances are present. The three regions show increasing variations in the PDF profiles, indicating that the molecule itself does not change its conformation upon heating, while the crystal packing is strongly influenced by such external perturbation, and the mutual position of different molecules in the crystal is varied. In the intermolecular distances region, in particular, PDF curves tend to flatten as the temperature is increased, remaining almost constant for higher temperatures. This indicates a decrease of the structural order at long range, due to a deterioration of the crystal lattice. Another striking feature arising from the analysis of Figure 3 is the similarity between the PDF functions of the two compounds, which suggest a similar molecular arrangement within the crystals.
(Color online) Overlap of PDF distributions obtained while heating the vapochromic samples. Only the part with interatomic distance r < 15 Å is shown.

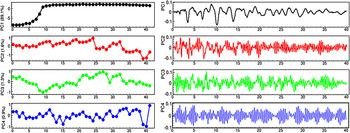
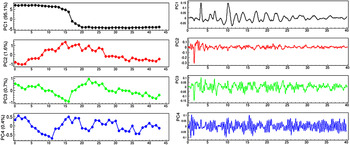
A detailed investigation of the variations of the PDF curves as a function of the temperature can be carried out by using the differential approach, i.e. by subtracting the starting PDF from the subsequent ones to highlight the residual that corresponds to the structural part which is changing with temperature. We implemented such an approach by using all PDF profiles together, given as input for PCA. The results for Pt(bzq) and Pt(ppy) are shown in Figures 4 and 5, respectively, where the PCA scores (left) and loadings (right) are reported as a function of the measurement number and of the interatomic distance, respectively. The main features of the PDF profiles are captured by the first PC, which explains 89.1 and 95.1% of the total data variance for Pt(bzq) and Pt(ppy), respectively. The PC1 scores supply the dynamic trend of the structural variations during measurements. It can be noted that an abrupt change occurs around measurement n. 9 for Pt(bzq) and n. 17 for Pt(ppy), and that no change occur at later measurements, while the temperature is ramped down. This indicates that during in situ heating/cooling process, reverse transitions were not attained upon returning to the initial temperature on the sample. Such behavior can be attributed to an uneven air flow within the capillary. In fact, after unmounting the sample we observed a color change confined to the region of the capillary hit by the X-ray beam, indicating that the water molecules have only reached the more exposed powder in the capillary. It is worthwhile noting that the reverse sign of the PC1 scores and loadings of Pt(ppy) with respect to those of Pt(bzq) is not significant, given that the scores and loadings calculated by PCA have a sign ambiguity.
(Color online) Scores (left) and loadings (right) of the four first PCs obtained by applying PCA to PDF measurements on sample [K(H2O)][Pt(bzq)(CN)2]. The percentage of total data variance explained by each principal component is reported as vertical title in the scores plots.

(Color online) Scores (left) and loadings (right) of the four first PCs obtained by applying PCA to PDF measurements on sample [K(H2O)][Pt(ppy)(CN)2]. The percentage of total data variance explained by each principal component is reported as vertical title in the scores plots.

The PC1 loadings represent the PDF signal associated to the kinetic behavior captured by the PC1 scores. For both Pt(bzq) and Pt(ppy), they satisfy basic expectations for typical PDF profiles, which have been listed by Chapman et al. (Reference Chapman, Lapidus and Chupas2015) as: absence of negative intensity peaks, envelope with decreasing peak amplitude at high interatomic distances and limited presence of high-frequency components (ν ≈ 2π/Q max). Thus, the PC1 loadings represent the part of the crystal structure, which is involved in the vapochromic changes. Interestingly, the sharp peaks of the PC1 loadings for the two compounds have the same positions (taking into consideration the above-mentioned sign ambiguity) indicating similar structural changes triggered by temperature variations. The first peak occurs at an interatomic distance of about 3.2 Å, which is consistent with the typical Pt–Pt bond distance and thus it is reasonable to assign the presence of such peaks to Pt–Pt intra-molecular distances within the crystal packing. As a consequence, the main structural variations related to vapochromic transitions are due to altered Pt–Pt distances in the crystal lattice. Such evidence is in agreement with previous investigations of the optical properties of these compounds (Forniés et al., Reference Forniés, Fuertes, López, Martín and Sicilia2008). On the other hand, the color of the complexes strongly depends on the intermolecular distance between Pt(II) ions.
Subsequent PCs in Figure 4 have loadings with large deviations from typical experimentally derived PDF curves. In particular, they are dominated by high-frequency signals, close to ν ≈ 2π/Q max, which is the characteristic periodicity in r space of ripple artifacts arising from Fourier transformations of scattering factors measured up to Q max (Chapman et al., Reference Chapman, Lapidus and Chupas2015). In other words, these components represent noise in the data, in increasing amount for higher components. The higher PCs of Pt(ppy) shown in Figure 5 are instead significantly different from those of Pt(bzq). The PC2 loadings, and at a lesser extend the PC3 ones, have positive peaks above a linear baseline and lack high-frequency components. They follow the typical envelope of experimentally derived PDF curves, with peak intensity decreasing with the interatomic distance. These components thus reflect secondary structural changes different from those captured by PC1. It is interesting to note that they have major contribution from peaks at interatomic distances of about 1.8 Å, thus involving intramolecular distances only. In addition, the PC2 and PC3 scores reveal that such structural changes do not occur abruptly around the transition temperature, such as in PC1, but they rather follow the temperature variations exerted on the sample during the in situ heating. In fact, the PC2 scores increase almost linearly up to measurement n. 15, and then decrease up to the last measurement, where the initial value is reached. A similar trend is followed by the PC3 scores.
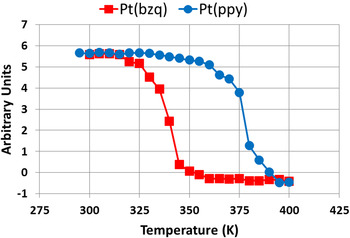
The dynamics of the main structural variations involved in the vapochromic transitions can be investigated by plotting the PC1 scores versus the temperature values associated to the different measurements. In doing this, we are allowed to rescale the PC1 scores values by arbitrary constants and change their sign, as they are calculated in arbitrary units. Such study, reported in Figure 6 by using only the measurements with increasing temperature, reveals that the vapochromic transitions of the two compounds have different characteristics. The critical temperature of the Pt(bzq) compound, i.e. the temperature at which the PC1 curve has a flex, is about 340 K, while that of the Pt(ppy) compound is about 378 K. Besides the higher transition temperature, the two vapochromic transitions have a different mechanism of structural transformations, related to the slope of the characteristic curves around the critical temperature. That of Pt(bzq) occurs abruptly between the two states,; that of Pt(ppy) has a more smooth trend, which points to a transition, which is accompanied by structural distortions occurring beside the main structural changes. Such behavior reflects the above considerations on subsequent PCs different from noise in the Pt(ppy) case.
(Color online) Rescaled scores of the first PC obtained by principal component decompositions applied to PDF measurements on Pt(bzq) and Pt(ppy) compounds, as a function of the temperature on the sample. Only measurements for which the temperature on the sample was increasing have been reported.

V. CONCLUSIONS
The characteristic curves describing the dynamics of the transition have been derived by using the multivariate analysis approach applied on in situ X-ray PDF measurements. The analysis of such curves has allowed us to find the characteristic temperature of the transitions and to guess about the underlying mechanism. These two features depend strongly on the ligand forming the vapochromic compound, with the bzq ligand triggering a sharper transition occurring at lower temperature, the ppy one triggering a smoother transition occurring at a 38 K higher temperature. Moreover, the general features shown by the loadings of the first PC indicate that the Pt–Pt contacts play a major role in determining the structural changes. For the Pt(ppy) compound, such changes are accompanied by structural distortion of the ligand structure, evidenced by PCs of higher order. We plan to perform static structural investigations by using X-ray powder diffraction on the same compounds, which could corroborate such findings.
ACKNOWLEDGEMENTS
Use of the National Synchrotron Light Source, Brookhaven National Laboratory, was supported by the U.S. Department of Energy, Office of Science, Office of Basic Energy Sciences, under Contract No. DE-AC02-98CH10886. This research has been partially supported by the short-term mobility CNR program.