I. INTRODUCTION
Bismuth–antimony alloys show the highest thermoelectric (TE) performance of any material at cryogenic temperatures. However, the performance of existing Bi1–x Sb x materials falls short for effective solid-state cryo-cooling applications where power is being constantly delivered to the device being cooled. TE nanowires are a potential solution to this limitation. Nanowire geometries have enhanced phonon surface scattering, reducing the thermal conductivity and thus enhancing the TE figure of merit (zT). Additionally, theory predicts high TE performance from trigonally oriented, highly crystalline nanowires via quantum confinement to efficiently optimize carrier concentrations. Reference Lin, Sun and Dresselhaus1,Reference Hicks and Dresselhaus2 However, to date, TE nanowire quality has been inadequate to realize high performance.
There are numerous methods reported in the literature to synthesize Bi1–x Sb x nanowires, such as pressure injection from a melt, Reference Huber, Onakoya and Ervin3 electrodeposition from aqueous solutions, Reference Li, Li, Zhang, Yang and Zhang4–Reference Dou, Zhu, Huang, Li and Li7 and nonaqueous electrodeposition. Reference Martín-González, Prieto, Knox, Gronsky, Sands and Stacy8,Reference Prieto, Martín-González, Keyani, Gronsky, Sands and Stacy9 Among these reports some researchers have focused on a subset of the important parameters (composition, crystallinity, orientation), but no reports show control of all the three factors simultaneously.
Macrocomposition, the average of the entire nanowire array, is the most easily controlled of the three parameters. For example, electrodeposited Bi1–x Sb x nanowires have been reported with controlled x ranging from 0.05 to 0.92. Reference Li, Li, Zhang, Yang and Zhang4–Reference Müller, Schötz, Picht, Sigle, Kopold, Rauber, Alber, Neumann and Toimil-Molares6,Reference Martín-González, Prieto, Knox, Gronsky, Sands and Stacy8,Reference Prieto, Martín-González, Keyani, Gronsky, Sands and Stacy9 However, uniform composition along the length of a given nanowire is more difficult to achieve. Bi1–x Sb x alloy nanowires formed by pressure injection show nonuniform composition due to phase segregation upon cooling from the melt. Reference Huber, Onakoya and Ervin3 Electrodeposited Bi1–x Sb x alloy nanowires can also be nonuniform in composition, with an Sb-rich region at one end of the nanowire. Reference Martín-González, Prieto, Knox, Gronsky, Sands and Stacy8,Reference Prieto, Martín-González, Keyani, Gronsky, Sands and Stacy9 Control of nanowire crystalline quality has also been demonstrated. Bi1–x Sb x alloy grown by pulsed electrodeposition has been reported to be single-crystalline. Reference Li, Li, Zhang, Yang and Zhang4,Reference Dou, Zhu, Huang, Li and Li7
Orientation is the most difficult critical issue. No reports exist of Bi1–x Sb x nanowires in the preferred trigonal orientation. Reference Rabin, Lin and Dresselhaus10 Instead, electrodeposited Bi1–x Sb x nanowires are predominately (110) oriented, Reference Müller, Schötz, Picht, Sigle, Kopold, Rauber, Alber, Neumann and Toimil-Molares6,Reference Martín-González, Prieto, Knox, Gronsky, Sands and Stacy8,Reference Prieto, Martín-González, Keyani, Gronsky, Sands and Stacy9 although this can be changed to (202) by controlling the potential. Reference Dou, Zhu, Huang, Li and Li7 Simultaneous control of all the three parameters during electrodeposition is difficult since no single factor alone has a strong self-governing effect on the composition or crystalline quality of an alloy. Reference Yeager11,Reference Prentice12
In this study, we discuss factors influencing the overall quality of electroformed Bi1–x Sb x nanowires with the goal of tailoring the composition, and preferred trigonal orientation. We demonstrate that the use of two different Sb complexes yields differing quality nanowires, despite having similar concentrations and electroforming conditions. We have used a nonaqueous solvent (DMSO) both for its wide electrochemical window and for the increased solubility of Sb salts. Reference Martín-González, Prieto, Knox, Gronsky, Sands and Stacy8 By controlling the solution chemistry, pulse parameters, and sample geometry we were able to form highly crystalline arrays of trigonally oriented Bi1–x Sb x nanowires with controlled composition both along the lengths of individual nanowires and across an entire array.
II. EXPERIMENTAL SECTION
Anodized aluminum oxide (AAO) templates ∼6 mm × 10 mm grown directly on Si substrates were prepared by a process reported earlier. Reference Limmer, Yelton, Siegal, Lensch-Falk, Pillars and Medlin13,Reference Oh, Shin and Thompson14 The pore size for the AAO templates was ∼75 ± 5 nm with controlled depths ranging from 3 to 10 µm. Electroforming was carried out using solutions of 30 or 50 mM Bi(NO3)3·5H2O (Sigma-Aldrich) and 30 or 50 mM SbCl3 or SbI3 (Sigma-Aldrich) in dimethyl sulfoxide (DMSO) (Fisher Scientific). KClO4 (0.1 M, J.T. Baker) was added as a supporting electrolyte to improve conductivity and deposition uniformity. For simplicity, the baths will be referred to by the ratio of [Bi3+] to [Sb3+] (i.e., 3:5 for 30 mM [Bi3+] and 50 mM [Sb3+]).
For cyclic voltammetry measurements, the working electrode was a 0.196 cm2 Pt disc, while for the electroforming an AAO template was used. To reduce edge effects during nanowire electrodeposition, we completely covered the templates with polyimide tape exposing only a 4 mm circular hole in the center of the AAO template. Without masking, the nanowire arrays preferentially overplated along edges and prevented nanowire growth in the sample centers. The reference electrode was Ag/AgCl (saturated KCl, 222 mV versus NHE). This reference electrode was separated from the bulk solution by a double junction filled with DMSO.
Cyclic voltammetry (CV) scans and nanowire electroforming were performed using Voltalab PGZ301 or PGZ402 potentiostat (Radiometer Analytical) controlled by VoltaMaster 4 software. For each individual component of the bulk solution, CV scans were performed at a scan rate of 10 mV/s in DMSO with supporting electrolyte (0.1 M KClO4). Nanowire arrays were electroformed using a galvanostatic pulse regime at room temperature. The electroforming was performed in a 3-electrode configuration with dry N2 agitation. At the start of each run, the open-circuit potential of the cell was allowed to stabilize to less than 2 mV/min drift.
All current densities for deposition are reported based on the geometric area exposed by the polyimide mask (0.126 cm2). As the AAO template is known to have ∼50% porosity, Reference Limmer, Yelton, Siegal, Lensch-Falk, Pillars and Medlin13 the effective current densities are ∼2x those reported here. Deposition was initiated with a high-current pulse strike consisting of 5–10 cycles at −16 mA/cm2 for 200 ms, followed by 1 s at −0.2 mA/cm2. High current densities help provide a larger number of nucleation sites. Reference Brande and Winand15 Nanowire samples grown without the preliminary strike showed identical results via x-ray diffraction (XRD). During nanowire electroforming, the deposition on-time was fixed at 500 ms, followed by 1.5 s off-time. The current densities ranged from −1.0 to −3.0 mA/cm2 during the “on” segment, and −0.2 mA/cm2 was applied during the “off” cycle to minimize the double-layer charging time for the following “on” cycle. At a deposition current of −1.0 mA/cm2, the growth rate of the nanowires was ∼2.4 µm/h. After electroforming, the masked AAO template was rinsed in DMSO, and then soaked in isopropanol overnight to ease the removal of the mask without damaging the sample.
XRD θ–2θ scans using a Cu Kα source, with 0.04° steps and 5 s dwell times were used to determine the resulting material phase(s) and crystalline orientations. The dimension, microstructure, and composition of the nanowires were analyzed using transmission electron microscopy (TEM) on a 200 kV JEOL 2010F equipped with an energy-dispersive x-ray spectroscopy (EDS) detector (Oxford Inc.). Nanowires were prepared for TEM by either (a) sonicating freestanding nanowires (on Si, after AAO removal), then drop-casting onto ultrathin lacey carbon TEM grids (Ted Pella), or (b) via focused ion beam (FIB) lift out techniques. To form freestanding arrays of nanowires, the AAO template was removed by etching in de-aerated 5 wt% H3PO4 solution at 30 °C for 6 h with N2 bubbling. After etching the samples were repeatedly rinsed with DI water, followed by several isopropanol rinses. Finally, the samples were dried in supercritical CO2 (Samdri-PVT-3D critical point dryer, Tousimis) to prevent agglomeration of the nanowires. Scanning TEM (STEM, in the JEOL 2010F) with a nominal 1.6 nm diameter probe was used to acquire EDS spectra from individual points along a nanowire to examine its compositional uniformity.
To quantify these measurements, we prepared a bulk Bi1–x Sb x alloy standard. Measured amounts of Bi and Sb were melted together in a quartz tube evacuated to ∼5 × 10⁻⁸ Torr and sealed while under vacuum. The material was melted at 650 °C, quenched in ice water, and finally homogenized by annealing at 250 °C for 33 days. Homogeneity was verified using EDS in a SEM. Composition of the ingot was measured by inductively coupled plasma spectroscopy (ICP-OES/MS) (Evans Analytical Group, EAG, Sunnyvale, CA), giving an alloy composition of Bi0.69Sb0.31 with a measurement error ±1.6 at.%. Thin sections of the standard were prepared via FIB and EDS data were collected in STEM mode. From the measured x-ray intensities of the Bi and Sb L-series collected from the standard and the concentrations determined by ICP-OES/MS, we calculated a k-factor that was used for our subsequent EDS analysis.
III. RESULTS
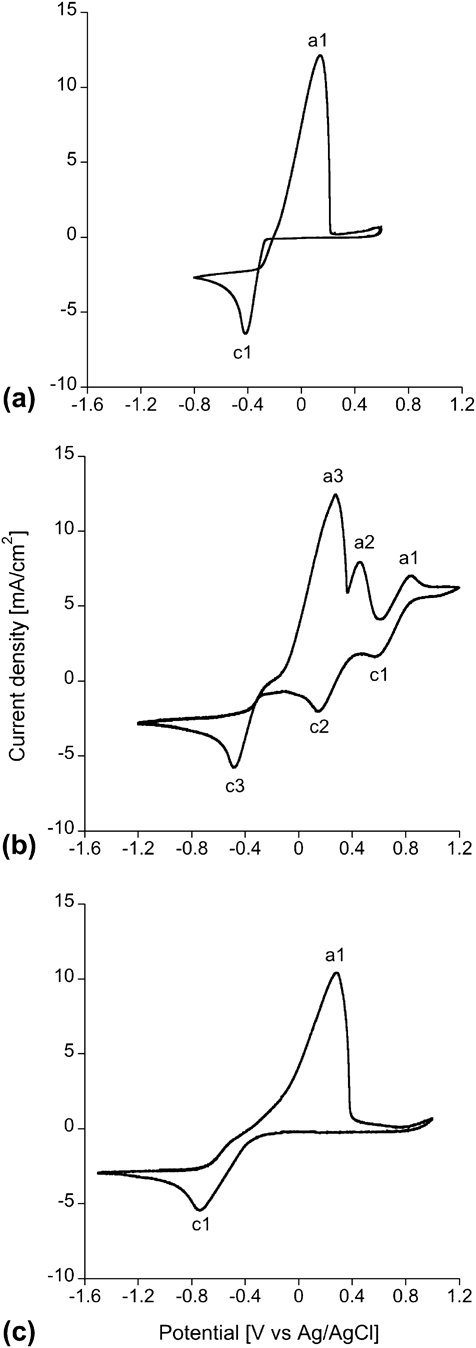
Figure 1 shows CV scans of the individual bath components in DMSO with supporting electrolyte. Bi(NO3)3 shows a cathodic peak (c1) at −416 mV, corresponding to the reduction of Bi3+ to Bi metal. SbCl3 has a cathodic peak (c1) at −738 mV for the reduction of Sb3+ to Sb metal, which is significantly negative of the Bi3+ peak. SbI3 has a reduction peak (c3) closer to that of Bi3+ at −483 mV, with a similar limiting current. This peak is presumably also for the reduction of Sb3+ to Sb metal. However, there are two additional cathodic peaks and corresponding anodic peaks (c1, a1, c2, a2) in the SbI3 data. We believe that these peaks are due to redox of iodide species; CVs of KI (not shown) have similar peaks.
CV scans at 10 mV/s of (a) 50 mM Bi(NO3)3, (b) 50 mM SbI3, and (c) 50 mM SbCl3 in DMSO with 0.1 M KClO4. All major anodic (e.g., a1) and cathodic (e.g., c1) peaks are labeled.

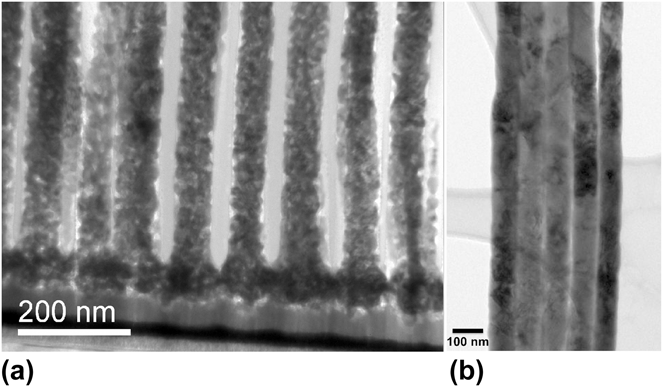
Figure 2(a) is a bright field (BF) STEM image of a nanowire/AAO cross section prepared by FIB lift out. The nanowires were deposited from 1:1 solution using SbI3 at −3 mA/cm2. Nanowires appear polycrystalline, with some fine scale porosity and grain sizes ranging from 5 to 8 nm. Using similar operating parameters, but replacing SbI3 with SbCl3, resulted in contrasting effects. Figure 2(b) is a TEM image showing a cluster of several nanowires synthesized from 1:1 solution using SbCl3 deposited at −1 mA/cm2.
(a) BF STEM image of nanowire/AAO cross-section prepared by FIB lift out. Nanowires synthesized from 1:1 solution using SbI3. Nanowires are polycrystalline with grains ranging from 5 to 8 nm. (b) BF TEM image of nanowires synthesized from 1:1 solution using SbCl3. The template has been removed and the wires are supported on a holey carbon grid.

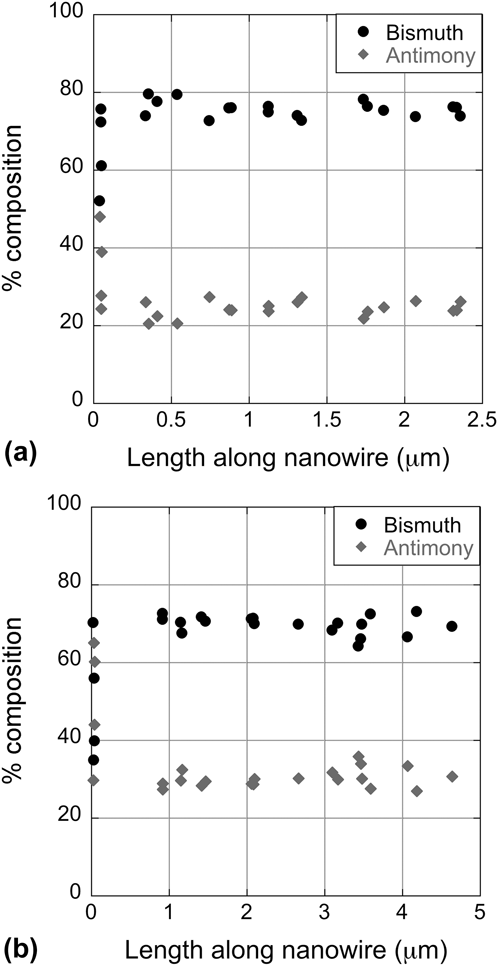
Figure 3 shows EDS measurements along the nanowire axis for nanowires deposited from 3:5 solution using SbCl3 at −1 mA/cm2, measured in the growth direction. The points are averaged from four Bi1–x Sb x wires. Figure 3(a) shows the results of nanowires near the center of the circular deposition region, while Fig. 3(b) shows data on wires from near the edge. The edge region with varying compositions extended inward ∼100 μm from the mask, yielding a uniform center region of ∼4.8 mm diameter. In both cases, the Sb concentration is higher in the first ∼20 nm, presumably from the high-current strike used at the start of the deposition which would favor the deposition of the less noble metal. Reference Paunovic and Schlesinger16
EDS measurements from several different Bi1–x Sb x wires, deposited from a 3:5 solution with SbCl3 at −1 mA/cm2. (a) Average composition of 4 wires sampled from the center of the array. (b) Average composition of 4 wires sampled from the edge of the array.

The nanowires from both the center and edge regions have good compositional uniformity along the nanowire length. The average composition along the length of nanowires sampled from the center of the array is Bi0.75Sb.25 with a ±1.7 at.% error margin. However, the average composition of nanowires from the edge of the array was slightly diminished in Bi, yielding Bi0.70Sb0.30 with a ±1.4 at.% error margin. This result suggests that the current densities were somewhat higher at the edge of the sample, which is expected for this deposition geometry.
Baths with SbI3 did not yield the desired composition for the nanowires. From SbI3-based baths, very little Sb was incorporated into the nanowires, with the sample shown in Fig. 2(a) containing only 2–8 at.% Sb, with the composition varying from grain to grain. For the SbCl3 baths, however, the resulting nanowires were close to the targeted 25–30 at.% Sb, with excellent composition uniformly along their entire lengths.
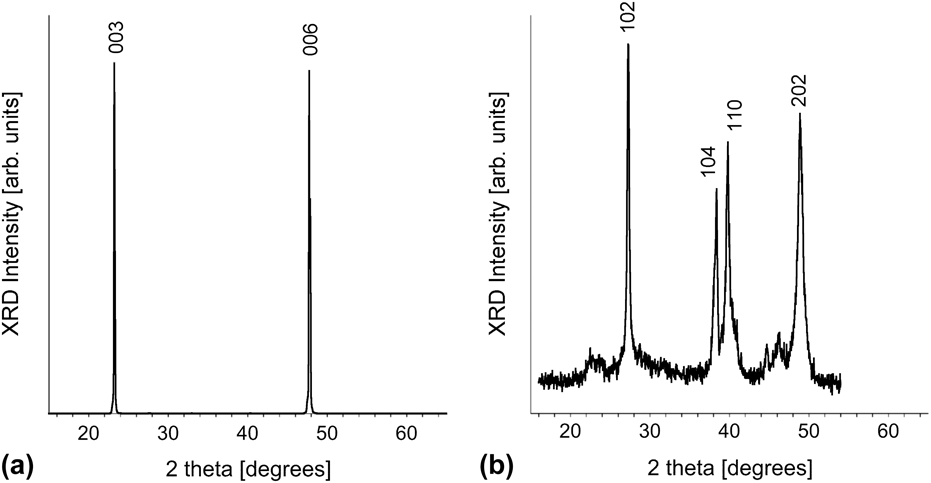
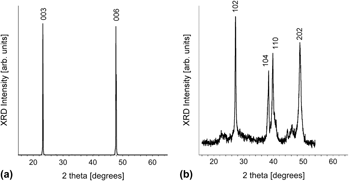
Figure 4 shows XRD scans for nanowires grown at −1 mA/cm2 from 1:1 solution containing SbCl3 [Fig. 4(a)] and SbI3 [Fig. 4(b)], respectively. The use of SbCl3 yields highly crystalline Bi1–x Sb x nanowires with a very strong trigonal texture, indicated by the presence of only the (003) and (006) diffraction peaks. Bi and Sb form a complete solid solution. At the Sb concentrations observed in this work, the XRD data are similar to bulk Bi. In bulk Bi the trigonal peaks are fairly weak, about 9% for (003) and 3% for (006) relative to the most intense peak (102) (JCPDF, 5-519), which is unobserved in this data when plotted on a linear scale. Nanowires grown using SbI3-based chemistry yield fine-grained polycrystalline nanowires with neither a strong preferred texture nor evidence of trigonal orientations. Here, the peak intensities are similar to bulk Bi, with (102) the most intense peak, and (104) and (110) having similar intensities.
(a) XRD scans of nanowires grown using galvanostatic pulses at −1 mA/cm2 current densities from a 1:1 SbCl3-based solution show a Bi1–x Sb x structure with pronounced trigonal texture. (b) XRD scans of nanowires grown at −1 mA/cm2 current densities from a 1:1 SbI3-based solution yields fine-grained polycrystalline nanowires with no preferred orientation.

IV. DISCUSSION
Based on the CV data, SbI3 appears to be a better choice of Sb3+ source, since it has a reduction peak very close to that of Bi3+. Normally having the two reduction peaks so close together is preferred for alloy deposition. Since the solution inside the pores is quiescent, mass transport rates within the pores depend on the metal ion concentration, current density, temperature, and polarization dynamics. Inside the pores, the diffusion-limited current density quickly decreases with the square root of time. A fast pulse transient improves the rate of mass transport over that of direct plating in nanopores. In principle, potential pulse regimes and galvanic pulse regimes are not alike. During a potentiostatic pulse, the concentration gradient at the growth surface changes over time, whereas the concentration gradient remains constant during a galvanostatic pulse. This means that for the galvanostatic case, the flux of both species (Bi and Sb) is constant over the duration of the pulse.
Our goal was not only to synthesize nanowires with uniform composition along the wire length, but also to maintain macrouniformity across the entire array. We targeted a 25–30 Sb at.% alloy composition based on theoretical modeling for n-type behavior for a 25 nm diameter wire. Reference Rabin, Lin and Dresselhaus10 Electroforming of Bi1–x Sb x arrays is sensitive to current density distribution, geometry, and localized concentration gradients; each greatly influencing the mass ratio of a deposited alloy.
The excellent compositional uniformity along the length of the wires as well as across the entire array demonstrates the effectiveness of pulsed electrodeposition for the growth of Bi1–x Sb x wires. EDS measurements from several different Bi1–x Sb x wires showed good macrouniformity from the center to the edge of the arrays (Fig. 3). Although compositional uniformity along the lengths of individual nanowires is easily demonstrated regardless of location, maintaining macrouniformity across an array is more challenging. When electroforming alloys using ionic species of vastly different reduction potentials from solutions where the electrolyte resistivity controls the current distribution, the geometry greatly affects compositional uniformity. Reference Prentice12,Reference Paunovic and Schlesinger16,Reference Bard and Faulkner17 Previous work examined the composition of multiple individual Bi1–x Sb x alloy nanowires, Reference Prieto, Martín-González, Keyani, Gronsky, Sands and Stacy9 but without information about where in the sample each wire came from it is impossible to draw any conclusion about how the composition varies across the sample. This is the first report to examine the macrouniformity of Bi1–x Sb x alloy nanowire arrays.
Crystallinity of the electroformed nanowire arrays ranged from randomly oriented polycrystalline using the SbI3 source to highly trigonally oriented using the SbCl3 source. Since both texture and composition are highly influenced by the current density, simply adjusting the operating parameters of similar ionic active couples offers a high degree of tunable properties. Reference Müller, Schötz, Picht, Sigle, Kopold, Rauber, Alber, Neumann and Toimil-Molares6,Reference Martín-González, Prieto, Knox, Gronsky, Sands and Stacy8,Reference Michel, Diliberto, Stein, Bolle and Boulanger18,Reference Martín-González, Prieto, Gronsky, Sands and Stacy19
Although composed of similar electroactive species, there was a notable difference in crystallinity between the nanowires electroformed from the SbI3- and SbCl3-based chemistries. There are a few possible explanations for this difference. First, according to Koch and Purdy, I− shows a stronger specific adsorption than Cl− in DMSO solutions. Reference Koch and Purdy20 The strong affinity to adsorb I− during deposition acts as a grain refiner for the nanowires interfering with grain growth.
The extra redox peaks seen in the CV for the SbI3 solution (Fig. 1) may also explain the significant difference in grain size between the two baths. From measurements on KI solutions, we believe that these extra peaks are from iodide redox reactions. Iodide is oxidized to iodine at the counter electrode via a two-step process Reference Koch and Purdy20 :
 $$6{{\rm{I}}^ - } \to 2{\rm{I}}_3^ - + 4{{\rm{e}}^ - }\quad {\rm{,}}$$
 $$2{\rm{I}}_3^ - \to 3{{\rm{I}}_2} + 2{{\rm{e}}^ - }\quad {\rm{.}}$$
The iodine thus formed could be re-reduced at the working electrode, interrupting the deposition. It is also possible the iodide is reacting with DMSO, forming a tri-iodide ion Reference Krueger21 :
 $${\left( {{\rm{C}}{{\rm{H}}_3}} \right)_2}{\rm{SO}} + 3{{\rm{I}}^ - } + 2{{\rm{H}}^ + } \to {\left( {{\rm{C}}{{\rm{H}}_3}} \right)_2}{\rm{S}} + {\rm{I}}_3^ - + {{\rm{H}}_2}{\rm{O}}\quad {\rm{.}}$$
Nanowire arrays electroformed using galvanostatic pulses at −1 mA/cm2 current densities from the SbCl3-based chemistry yield highly oriented Bi1–x Sb x structures with XRD evidence only for the trigonal texturing [Fig. 4(a)] preferred for optimal TE properties. In contrast, electroformed arrays from the SbI3-based chemistry yield polycrystalline grains with no preferred texture [Fig. 4(b)]. Since the overpotential greatly influences the competition between nucleation of new crystallites and the growth rate of existing crystallites, we varied the current density. Reference Dini22 However, using a higher (−3 mA/cm2) current density still yields nanowire arrays composed of very fine polycrystalline grains with no evidence for trigonal texturing.
The trigonal orientation has not been previously reported in electrodeposited Bi1–x Sb x nanowires. The mechanism by which we have been able to obtain this orientation is unclear. One difference in our synthesis is the use of galvanostatic pulse deposition, in contrast to previous reports that have used either a constant potential or a pulsed potential for nanowire growth. Since it is possible to change orientation via different plating conditions, Reference Dou, Zhu, Huang, Li and Li7 this may account for the observed orientation.
V. CONCLUSION
We electroformed Bi1–x Sb x nanowire arrays using a galvanostatic pulse regime with attention to composition, crystalline quality, and orientation. To minimize the oxidation behavior from both bismuth and antimony, we used a nonaqueous neutral solvent, larger counter electrode and a galvanostatic pulse. To further reduce oxide by-products we biased the working electrode during each “off” cycle with a small negative current. By adjusting the ratios of the pulse regime from fixed molar concentrations of Bi and Sb, we achieved high compositional uniformity along the lengths of individual nanowires. The macrocomposition of nanowires from the bulk of the array (center region) was Bi0.75Sb0.25 with a measurement error of ±1.7 at.%. Under strict control of current distribution, the macrouniformity at the edge of the arrays deviated by ∼5 at.% (Bi0.70Sb0.30 with a measurement error of ±1.4 at.%), even though the nanouniformity along the length of each wire was maintained. The crystallinity of as-electroformed nanowires ranged from randomly oriented polycrystalline to highly trigonally oriented depending on the chemistry. Under similar operating conditions, arrays electroformed from SbI3-based chemistries were polycrystalline, whereas arrays synthesized from the SbCl3-based chemistry with galvanostatic pulses exhibited strong trigonal texturing.
ACKNOWLEDGMENTS
The authors wish to thank Donald L. Overmyer for assistance with film deposition and x-ray diffraction. Sandia National Laboratories is a multi-program laboratory managed and operated by Sandia Corporation, a wholly owned subsidiary of Lockheed Martin Corporation, for the U.S. Department of Energy's National Nuclear Security Administration under contract DE-AC04-94AL85000.