

1. INTRODUCTION
1.1 Why Should We Pay Attention to the Elderly’s Legal Problems?
“Ageing society” is a key term in the twenty-first century. Currently, most developed countries are facing an ageing society due to medical advancement, declining birth rates, and the ageing of the baby-boomer generation. It is estimated that, globally, the number of people aged 60 years or over will rise threefold by 2100, as compared with 2017.Footnote 1 The World Health Organization argues that an ageing society brings “both challenges and opportunities.”Footnote 2
Japan is ageing at a higher rate than any other country. The proportion of the population aged 65 years or over reached 27.3% in 2016 and is estimated to rise to 33.3% by 2036.Footnote 3 In 2015, the average life expectancy was 80.75 for men and 86.99 for women, while it had been 69.31 and 74.66, respectively, in 1970. Simultaneously, the average Japanese family is having fewer children: the total fertility rate was 1.44 in 2016, whereas it was 2.13 in 1970.Footnote 4
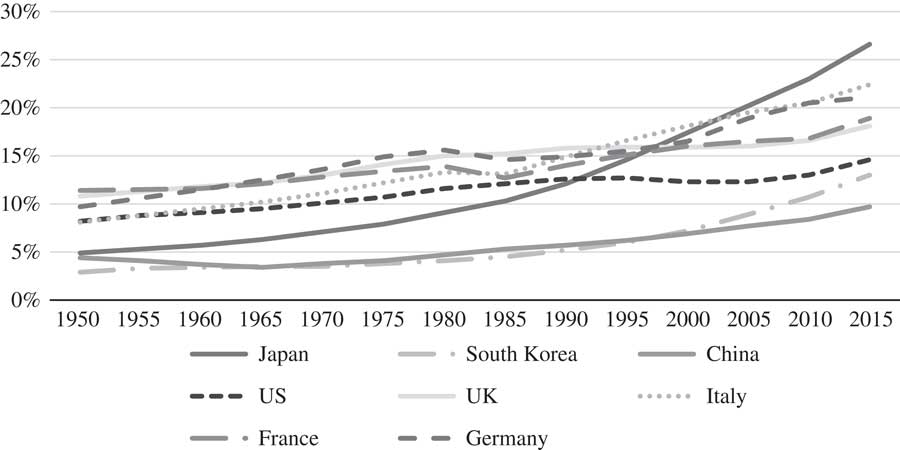
Ageing is a worldwide issue. Italy’s proportion of the population aged 65 years or over, at 22.4%, was the second highest in the world (and estimated to soon become the highest) and Germany’s 21.1% was the third highest in 2015 (see Figure 1).Footnote 5 Asian countries are also facing serious ageing problems. For example, South Korea’s proportion of the population aged 65 years or over was 13.1% and Singapore’s proportion was 11.7% in 2015.Footnote 6
Percentage of the population aged 65+ (2015)

Against the backdrop of the ageing society, “elder law”Footnote 7 has been garnering both practical and academic attention internationally as an area of the law. As is the case with consumer law and poverty law, elder law targets a specific group of people and was developed mainly in the US,Footnote 8 where attorneys had handled legal issues involving elderly people before the area was established as such, especially regarding estate-planning issues.Footnote 9
The two main areas of elder-law practice are health law and income-and-asset protection and preservation. First, since more elderly face health problems compared to younger people and as their physical/cognitive capacities decline, they seek help with formal documents concerning health-care decisions or assistance from guardians.Footnote 10 This increase is occurring in Japan as well. The number of requests for adult guardianship is increasing remarkably with a rise in the number of dementia patients. There were 34,249 cases in 2016Footnote 11—a significant increase from the 9,007 cases in the 2000 Japanese Fiscal Year (JFY).Footnote 12
Second, elderly people are concerned with financial planning such as pensions, social security, or inheritance, and seek advice on such issues.Footnote 13 In Japan, 51.4% of households receiving supplemental security income are elderly households.Footnote 14 Additionally, estate-planning needs are increasing: the number of notarized wills was 105,350 in 2016 compared to 74,160 in 2007.Footnote 15
In short, elderly people have various legal needs, including the two main areas of health and finances (“later life planning” according to Frolik)Footnote 16 arising from the decline of their physical/cognitive capacities and of their expected societal roles as they retire and enjoy private life.Footnote 17 In the US, the National Academy of Elder Law Attorneys (NAELA) was established to certify and provide training to attorneys specialized in this area. Although no national organizations that certify elder-law attorneys exist in Japan, legal professionals make great effort to meet the elderly’s legal needs.
1.2 Legal Services for the Elderly in Japan
A key factor that has facilitated legal services for the elderly has been Japanese judicial reform, which took place in the 1990s. The Judicial Reform Council proposed multiple approaches to facilitate judicial-system access and meet people’s various legal needs.Footnote 18 One approach was to expand civil legal aid, which is important for the right of access to the courts.Footnote 19 Additionally, the Access to Justice Committee of the Headquarters for the Promotion of the Justice System Reform considered establishing a new organization to provide legal consultation and legal aid. Later, the 2004 Comprehensive Legal Support Act established the Japan Legal Support Centre (JLSC).Footnote 20
The JLSC is a semi-incorporated administrative agency providing legal information, civil legal aid, services for areas with few practising lawyers, and crime-victim support. It also acts as a court-appointed defence counsel and entrusted operations by government, local authority, or nonprofit corporations.Footnote 21 It focuses particularly on elderly and people with disabilities, whose legal needs tend to remain latent.Footnote 22 Previously, there was an eligibility requirement (family income) for elderly and people with disabilities to be able to utilize JLSC legal consultation. However, after the 2018 amendment, the elderly or people with disabilities whose cognitive abilities are insufficient can avail themselves of JLSC legal consultation without any financial precondition.Footnote 23
According to the JLSC, 18.3% of people who used the information hotline in JFY 2016 were aged 60 or over. As for problems particularly related to elderly people, 6% (20,248 cases) were about wills/inheritances and 1.9% (6,396 cases) were categorized as elderly/people with disabilities.Footnote 24
Bar associations also provide legal services for elderly people. The Japanese Bar Association established the Aged Society Task Force in 2009. They provided legal consultation through a local community hotline as a pilot project and then established a new project (“Himawari-Anshin Jigyo”) to promote advocacy for elderly people, improve the elderly’s legal-service access, provide active consultation for elderly people (especially counselling through phone and home visits), construct a one-stop service, and build networks among multidisciplinary teams.Footnote 25 Currently, most local bar associations have a legal consulting service centre for elderly people, in which 45.1% of total consultations concerned wills/inheritance, 9.9% concerned guardianship, 9.7% were general consultations, and 35.4% were other categories in JFY 2012.Footnote 26
Shiho-Shoshi (judicial scriveners) also focus on elderly individuals’ legal problems, especially adult guardianship. Established in 1999, the Legal Support Adult Guardian Centre introduces available Shiho-Shoshi to users and provides consultation services about guardianship.Footnote 27
1.3 The Elderly’s Access to Legal Services
As mentioned earlier, the elderly have multiple options to receive legal advice. However, the existence of legal services does not necessarily mean they have enough legal access. According to “Experiences of Problems and Disputing Behaviour Research”Footnote 28—conducted in Japan in 2005, with 20,514 participants, 12,408 of whom gave valid responses—fewer people aged 60–70 (compared with those aged 20–39) consulted attorneys, which suggests that there are obstacles preventing elderly people from consulting legal professionals.Footnote 29
Empirical research on access to justice has drawn increased attention and has been conducted in various countries, including Japan.Footnote 30 Previous studies identified that personal factors including age,Footnote 31 sex,Footnote 32 income,Footnote 33 educational level,Footnote 34 assumed to be plaintiff or defendant,Footnote 35 legal system experiences,Footnote 36 connections with legal professionals,Footnote 37 and factors concerning specific cases affect people’s legal-service usage.Footnote 38 However, there has been little empirical research into or few theoretical discussions on elderly people’s legal access in Japan,Footnote 39 though financial, physical, and psychological barriers have been highlighted by attorneys, based on their impressions of cases in which they have been involved.Footnote 40
An exceptional empirical survey was conducted by the JLSC in 2008. Of 3,000 respondents (aged 20 or over), 1,636 answered the questions. Of these, 25.2% had experienced legal problems. Specifically, among the respondents aged 65 or over, only 14.4% had experienced legal problems. This implies two possibilities: elderly people do not face legal problems often or they fail to recognize their legal problems compared to younger people.Footnote 41 Researchers then compared the elderly who consulted legal professionals when they had legal problems with those who did not. Results revealed that elderly women (compared to men) tended not to consult legal professionals. Furthermore, elderly respondents without legal connections (compared to elderly respondents with connections) tended not to consult legal professionals when facing legal problems.Footnote 42
Some empirical studies have been conducted in other countries. In the UK, whose proportion of the population aged 65 or over was 18.1% in 2015,Footnote 43 Age Concern, a charitable organization, conducted a secondary analysis utilizing data from the Civil and Social Justice Survey by the Legal Services Research Centre, revealing that 26% of respondents aged 50 years or over had experienced civil-law problems in the previous three and a half years.Footnote 44 To solve the problems, 51% of the respondents sought advice, 31% dealt with the problems by themselves, and 10% did nothing. Approximately 5% failed to obtain any help and dealt with the problems by themselves, and 2% did not receive any help and gave up. Compared to younger respondents, more respondents aged 80 years or over answered “did nothing.”Footnote 45 All respondents, regardless of age, chose “it would not make any difference” as their main reason for doing nothing. However, respondents aged 50 years or over also tended to choose options like “there was no dispute or the other person was right,” “it would take too much time” and “it would be too stressful” compared to younger respondents,Footnote 46 suggesting that elderly people tend to feel helpless and give up on solving such problems.
Basu and Duffy and Duffy et al. explored the problems of legal access for elderly people in Northern Ireland.Footnote 47 The percentage of Northern Ireland people aged 65 or over was 15% compared to 16.8% in the UK in 2012.Footnote 48 By conducting interview surveys with elderly people and service providers, they found that some senior citizens distrusted lawyers and the “older-old” especially tended to hesitate in contacting legal services.Footnote 49 Moreover, elderly people who provide informal care for infirm family members like a spouse, brother, or sister were found to be too tired to consult lawyers.Footnote 50 Furthermore, elderly people could not recognize they needed legal assistance and did not know where to obtain it.Footnote 51 Consequently, Basu and Duffy argued that “providing accessible and affordable information” is important.Footnote 52
Ellison et al. tried to identify factors affecting elderly people’s legal access in New South Wales, Australia, through qualitative interview surveys.Footnote 53 The percentage of Australians aged 65 or over increased from 12% in 1996 to 15.2% in 2016, with the percentage for New South Wales being 15.7%.Footnote 54 Ellison et al. revealed that “physical and mental incapacity, dependency on others, diminished self-confidence, anxiety about the possible consequences, and ignorance of the available information and advice services,”Footnote 55 along with lack of knowledge about utilizing modern technology, prevented elderly people from seeking legal advice. Alternatively, Sage-Jacobson argued that factors like lack of knowledge about modern technology no longer prevent the elderly from accessing legal services because more elderly people know how to utilize modern technology.Footnote 56
A national survey of advice-seeking behaviour in Taiwan, whose proportion of the population aged 65 or over was 12.3% in 2015,Footnote 57 examined the behaviour differences between elderly and younger respondents. Huang, Lin, and Chen revealed that, compared to younger respondents, the elderly tended to seek non-legal rather than legal advice.Footnote 58 These results imply that elderly people may first prefer to consult informal actors, not legal professionals, when facing legal problems.
In summary, previous studies have indicated physical/cognitive, psychological, and informational/network barriers for the elderly’s legal-service access. However, they have not examined how those barriers affect the actual process by which elderly people attempt to access legal services. Furthermore, while multiple studies have argued knowledge/information about legal services is important, which segments of the elderly actually possess this knowledge and how those without such knowledge handle problems remain unknown.
Therefore, this study attempts to answer three empirical research questions: (1) What kinds of legal problems have elderly people experienced? (2) What factors affect elderly people’s decisions to consult lawyers about problems? (3) Do Japanese elderly people know where to consult lawyers when necessary? Specifically, who will they attempt to consult regarding legal problems and why?
It is important for the international community to understand the current situation in Japan’s super-ageing society because other developed countries are on the same trajectory in terms of ageing. Findings in Japan are expected to be applicable to other developed countries as well.
2. METHODS
To answer these questions, this study adopted a mixed-methods approach.Footnote 59 Specifically, both quantitative and qualitative studies were included. First, a quantitative study examined the overall trend and then a qualitative study attempted to explain the quantitative results. One advantage of this approach is that qualitative data can explain why and how the quantitative results emerged.Footnote 60 Thus, in contrast to previous studies about the elderly’s legal access with either a quantitative or a qualitative survey, this study can multi-directionally explain the elderly’s experiences and knowledge.
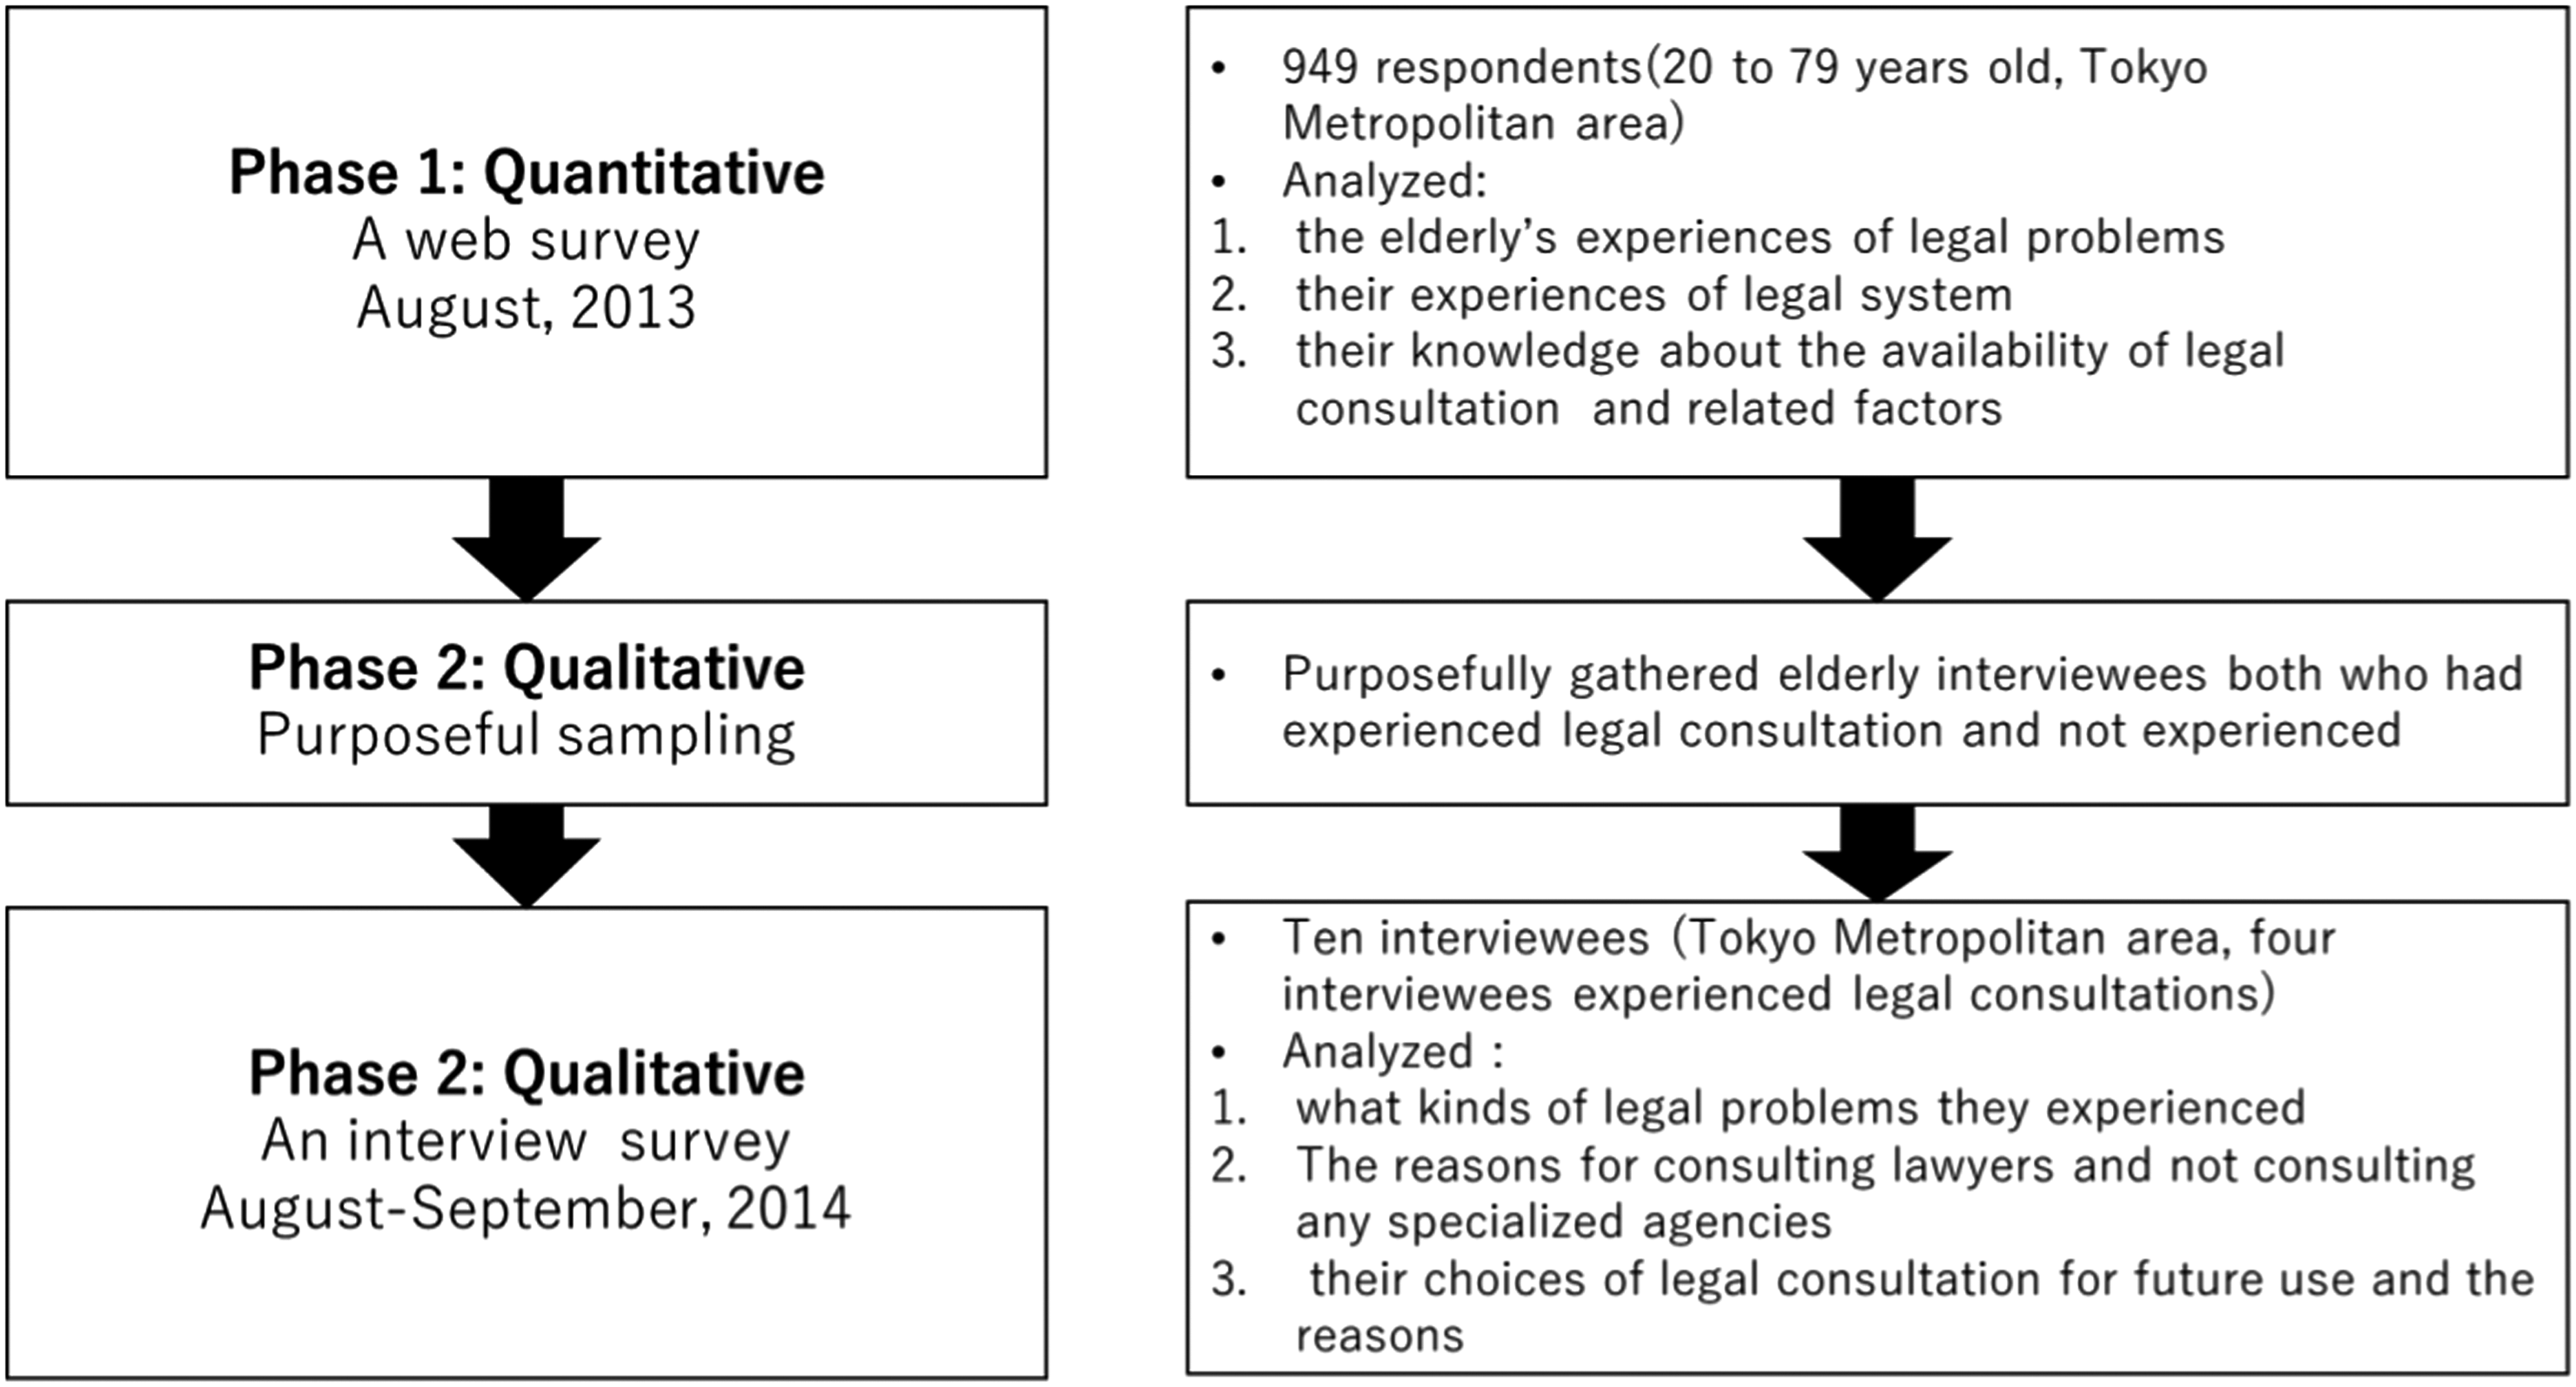
As shown in Figure 2, a web survey was conducted in Phase 1 to quantitatively identify the overall trend of the elderly’s experiences of legal consultation and their knowledge about legal-consultation availability. In Phase 2, purposeful sampling was conducted.Footnote 61 More specifically, elderly interviewees with or without legal-consultation experience were recruited. An interview survey was carried out to qualitatively describe how they dealt with their problems and their choices of legal consultation for future use. This study prioritizes the qualitative survey because it focused on how elderly people dealt with their problems and why they chose that particular method.
Research design
Since the participants in this survey needed to understand the aims of the study to ensure appropriate ethical consideration, the participants were limited to the elderly with sufficient judgemental capacities. As a result, people aged 60 years or over (rather than 65) were operationally defined as “elderly people” for both the web survey and the interview survey.
2.1 Phase 1: Web Survey
A web-survey method was chosen for this study because it was predicted that a mail survey of elderly people would produce many missing values, whereas a web survey would not. Conversely, a web survey has a sampling bias: respondents of a web survey are limited to those who can utilize the Internet. However, the number of elderly people using the Internet is increasing rapidly in Japan. In 2014, 80.2% of 60- to 64-year-olds, 69.8% of 65- to 69-year-olds, and 50.2% of 70- to 79-year-olds used the Internet.Footnote 62 Since a growing number of elderly people have started using the Internet, it can be assumed that elderly respondents of a web survey represent the general population to a greater extent than previously.
Having considered the advantages and disadvantages, this study chose a web survey because such a method would gather more reliable data while also acknowledging the limitations this may impose on the study’s results.
2.1.1 Sample
A questionnaire survey was conducted to analyze the elderly’s experiences of legal problems, legal consulting, and their knowledge of legal services. A Japanese research company administered the web survey.
Unlike previous studies in Japan that did not administer questionnaires to people over 70,Footnote 63 949 participants whose ages ranged from 20 to 79 (mean 49.23; S.D. 16.361) answered the questions in this survey. To understand the unique characteristics of elderly respondents, people under the age of 60 were included for comparison.
All respondents were residents in the capital area (Tokyo, Kanagawa, Chiba, and Saitama). The sample consisted of 476 men and 473 women, with a minimum of 150 respondents in each ten-year age bracket. People who had registered as respondents for surveys on the research company’s website received an e-mail from the research company regarding this survey. If they agreed to respond to this survey, they visited the site and answered questions. In exchange for doing so, they received points that they could exchange for prizes.
2.1.2 Question Items
Question items covered three aspects of legal problems: experience of legal support, impressions of the legal system, and opinions about case examples. This paper presents the results of the first item group. Most of the question items regarding experience of legal support were modified from “Experiences of Problems and Disputing Behaviour Research.”Footnote 64 In addition, questions about knowing where to access legal consultation were created for the present study.
2.2 Phase 2: Interview Survey
To identify the process by which elderly people decide to consult lawyers and their knowledge about legal consultation, semi-structured interviews were conducted with ten elderly people living in the Tokyo metropolitan area in 2014. Each person was interviewed for one to two hours and the conversations were recorded on a digital voice recorder with the consent of the interviewees. Transcripts of the interviews were analyzed as follows. First, each statement was summarized and given a short label that represented the critical nature of the statement. The validity of that short label name was checked by a graduate student majoring in clinical psychology (who was ignorant of the research purpose) to assure objectivity. Second, similar labels were combined and named as subcategories. Third, higher categories were formed from the subcategories.Footnote 65 The names of categories are presented in italics in the ‘Results’ section.
2.2.1 Sample
To interview elderly people both with and without experience of legal consultation, this study conducted purposeful sampling. First, a researcher (who is not involved in the present study) introduced Interviewees B, C, D, E, H, I, and J to the author. Then, Interviewee B introduced A, F, and G to the author. Interviewees did not participate in the web survey.
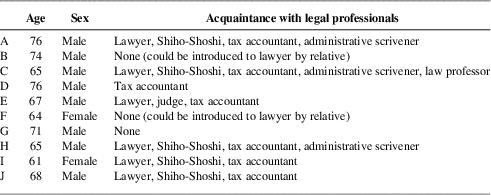
The details of the interviewees are presented in Table 1. All information about the interviewees is accurate as of 2014. Of the interviewees, eight were male and two female, and their average age was 68.7 years old. Since the balance between elderly interviewees with and without legal-consultation experience was the priority in this study, the two gender groups were not balanced.
Interviewees

2.2.2 Question Items
Question items covered three aspects of legal problems: (1) experiences of law-related problems; (2) experiences of legal services; and (3) knowledge about where to consult legal professionals. Some items of groups (1) and (2) were adapted or modified from extant research.Footnote 66 Some question items were the same as on the web survey to compare the results between the two studies.
3. RESULTS
3.1 What Kinds of Law-Related Problems Have Elderly People Experienced?
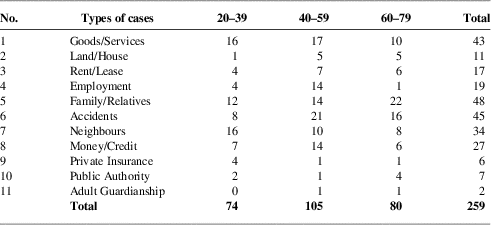
Of the web-survey respondents, 259 of the 949 respondents (27.3%) had experienced one or more troubles in the previous five years.Footnote 67 Particularly, respondents aged 40–59 had experienced more trouble in the past five years than those in the other age groups (χ2(2)=9.059, p=0.011).Footnote 68 As shown in Table 2, more respondents aged 60 years or over had experienced family/relative troubles in the past five years as compared with younger respondents.Footnote 69
The most serious trouble in the past five years—Question: Which was the most serious trouble?

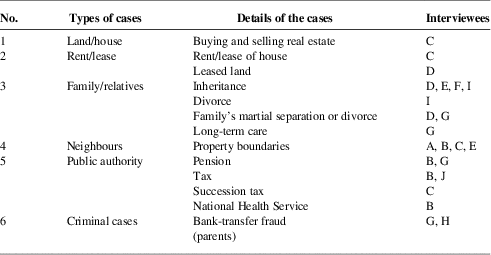
As for the interview survey, all interviewees had experienced law-related problems after they turned 55.Footnote 70 Law-related problems that had started before they turned 55 but continued to the present were included. As presented in Table 3, four interviewees experienced problems with neighbours and five experienced problems involving family or relatives. Problems with neighbours are not unique to elderly people. However, since elderly people tend to have lived in the same place for many years, the trouble is prolonged (Interviewee B). Conversely, elderly people had more chances to face inheritance problems because of their longer lives (compared to younger people).Footnote 71 In the present sample, three interviewees had experienced inheritance procedures for their parents’ assets and one experienced the inheritance procedure for her former husband.
Experiences of law-related problems (after age 55)

3.2 How Did They Deal with Law-Related Problems?
In the web survey, respondents were asked whether they had consulted a lawyer or gone through court procedures to solve troubles in the previous five years.Footnote 72 As shown in Table 4, 82 of 259 (31.7%) respondents had utilized the legal system,Footnote 73 whereas respondents aged 20–39 had not, compared to middle-aged and older respondents (χ2(2)=6.212, p=0.045).
Experience of the legal system to solve serious troubles in the previous five years

Among elderly respondents, 36.3% had utilized the legal system, whereas 63.7% had not. What, then, made some elders utilize the legal system and not others? To answer this question, further analysis was conducted on the interview data.
The interview survey revealed that four interviewees consulted lawyers about their law-related problems and one consulted the police, while five interviewees did not consult any specialized agencies.Footnote 74 In this section, facilitative and obstructive factors in consulting lawyers will be analyzed.
3.2.1 Reasons for Consulting Lawyers
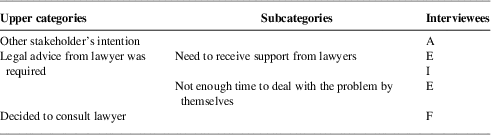
Interviewees who consulted lawyers were asked why they had decided to do so. The answers were the other stakeholder’s intention (Interviewee A), legal advice from a lawyer was required (Interviewees E and I), and made up her mind to consult a lawyer (Interviewee F), as shown in Table 5.
Reasons for consulting lawyers

Interviewee A consulted a lawyer about his land’s boundary line. Since his land was to be sold to the other person, Interviewee A wanted to demarcate the line as soon as possible. Thus, because of the other stakeholder’s intention, Interviewee A decided to consult a lawyer and file a lawsuit against his neighbour. He hired a lawyer who was an acquaintance of the other stakeholder.
Interviewee E consulted a lawyer he was acquainted with about his father’s brother’s inheritance procedure (his father passed away soon after that). Since it seemed difficult and unnecessary for him to conduct the procedure by himself and he was busy with his job at that time, he decided to hire a lawyer.
Interviewee I consulted a lawyer after deciding to divorce her husband. While both Interviewees E and I consulted lawyers because legal advice from a lawyer was required, they had contrasting attitudes towards problem-solving. Interviewee E entrusted everything to a lawyer, whereas Interviewee I got involved in the problem-solving process by making use of another lawyer’s expertise. She proactively utilized a lawyer because she had received helpful support from another lawyer about the lease of her house and it was this individual who had introduced her to the divorce lawyer.
Interviewee F and her son hired a lawyer to refuse her former husband’s inheritance. Since they had made up their mind to refuse the inheritance, they decided to consult a lawyer who was her son’s acquaintance.
In short, four interviewees consulted lawyers because (1) they could recognize their concerns as legal problems; and (2) there was a lawyer in their own personal network. As Sandefur has mentioned, people who do not seek legal advice often believe their problems are unrelated to the law.Footnote 75 Since the interviewees’ cases were typical legal cases like divorce, inheritance, and property boundaries, it may have been easy for them to recognize the legal needs. Additionally, as previous studies have shown,Footnote 76 connections with legal professionals play an important role in accessing legal services.
3.2.2 Reasons for Not Consulting Any Specialized Agencies
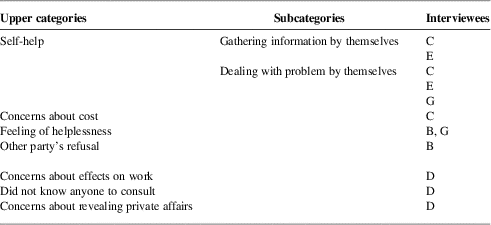
Five interviewees did not consult lawyers or any specialized agencies because they engaged in self-help (Interviewees C, E, and G), were concerned about the cost of legal services (Interviewee C), had feelings of helplessness (Interviewees B and G), because of the other party’s refusal (Interviewee B), did not know anyone to consult (Interviewee D), were concerned about revealing his private affairs (Interviewee D), or were concerned about the negative effects on his business (Interviewee D) (Table 6).
Reasons for not consulting any specialized agencies

The five interviewees were divided into two groups based on their connections with legal professionals and attitudes towards dispute resolution. First, Interviewees C and E did not consult any legal professionals even though they had a direct connection with lawyers because they engaged in self-help. Interviewee C searched how to draft a tenancy agreement on the Internet and prepared it himself: he had worked in the legal department of a company and knew how expensive the cost of legal services is. Additionally, to deal with the property-boundary problem with his new neighbour, Interviewee E conducted research about local regulations at the local government office. He did not consult lawyers because the problem was solved through negotiation between the two parties.
The second group—Interviewees B, D, and G—did not consult legal professionals because of their feeling of helplessness and lack of connection with legal professionals. Interviewee B has suffered the boundary-line problem with his neighbours for over 20 years. He has faced harassment by the neighbours, such as shouting at him. Interviewee B thought that it would be desirable to request assistance from a third party and discussed the problem with the neighbours. However, the neighbours did not agree (the other party’s refusal) and he thought their behaviour would not change even if he consulted specialized agencies.
Interviewee G did not consult any specialized agencies about his brother, who had suffered a cerebral stroke 20 years before, because of his feeling of helplessness. He did not consult any lawyers about the inheritance procedure from their mother because the amount was very small. Studies have shown that some people facing legal problems tend to make their own judgements about whether the problem is legal as well as misunderstanding the usefulness of specialized agencies.Footnote 77
Interviewee D has faced a land-leasing problem for over 20 years. After the owner of the land his company had leased passed away, the heirs could not agree how to use the land. Eventually, Interviewee D was asked to pay an increased rent through an estate agent. He consulted a lawyer to whom he was introduced by his friends when he was 53 years old but did not receive any helpful advice. He did not consult any other lawyers other than the original because he did not know any to consult and he was concerned about revealing his private affairs. He was also concerned about the negative effect on his business if the issue became public. The negative impression he had with the original lawyer made him think that lawyers cannot deal efficiently with problems.
In short, the first group had enough resources in the form of experience and information to solve their law-related problems by themselves. As Sage-Jacobson has argued, interviewees in the first group may have a “holistic view” of their legal access.Footnote 78 In other words, they did not access legal services because they had other effective options. In contrast, the second group did not consult lawyers because they felt helpless about their prolonged problems and lacked information about legal services.
3.3 The Elderly’s Knowledge About the Availability of Legal Consultation
3.3.1 Web Survey
Previous studies revealed that connection with legal professionals and experience in utilizing the legal system were positively associated with people’s legal access.Footnote 79 Even though a person may not have such connection or experience, it is possible to have knowledge about legal consultation. Thus, informational factors can affect the elderly’s access to legal services.
As presented in Table 7, more respondents aged 60–79 had knowledge about the availability of legal consultation compared to younger respondents (χ2(2)=70.845, p<0.001). These results suggest web-survey respondents presumably had a higher education compared to Japan’s general population and that some elderly people may have increased resources that were obtained during their longer lifetimes. In other words, ageing has both positive and negative aspects: accumulating useful knowledge and declining physical and/or judgemental functions, respectively.
Knowledge about the availability of legal consultations

What factors are associated with the elderly’s knowledge about the availability of legal consultation? The relationship between age group, knowledge of legal-consultation availability, and attributes (including sex, education level, living alone or not, working or not working,Footnote 80 annual family income)Footnote 81 were analyzed.
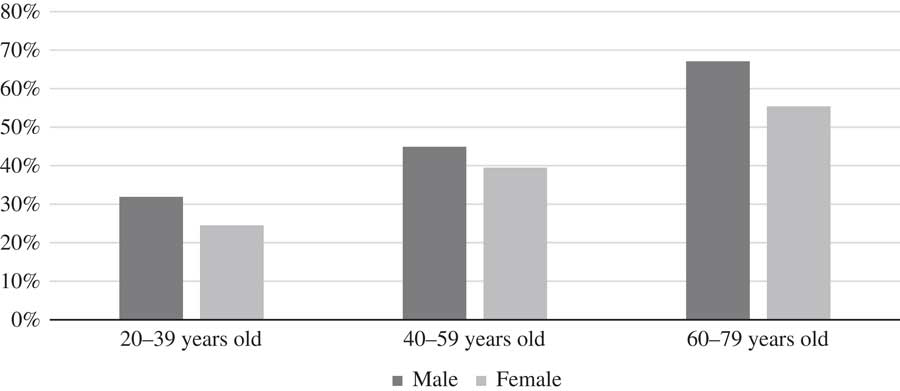
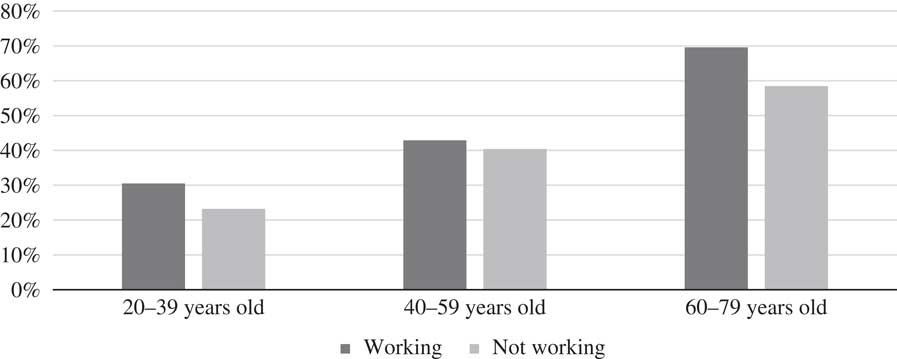
First, the Mantel-Haenszel test was applied to examine the relationships among age group, knowledge, and attributes is independent. Then, the relationship between knowledge and the other variables was analyzed by chi-square test and residual analysis for each age group.Footnote 82 Results showed that, only among respondents aged 60–79, more male respondents tended to know about the availability of legal consultation than their female counterparts (Figure 3).Footnote 83 Additionally, again, only among respondents aged 60–79, more of the working respondents tend to have knowledge compared to those not working, although the difference was only marginally significant (Figure 4).Footnote 84
The percentage of respondents who have knowledge about the availability of legal consultation (male versus female; N=949)

The percentage of respondents who have knowledge about the availability of legal consultation (working versus non-working; N=949)

In short, elderly respondents who are female and not working tend to not know about the availability of legal consultation whereas elderly respondents in general know more about the availability of legal consultation than do younger respondents. The results indicate, as mentioned earlier, that elderly people are not a homogeneous group.
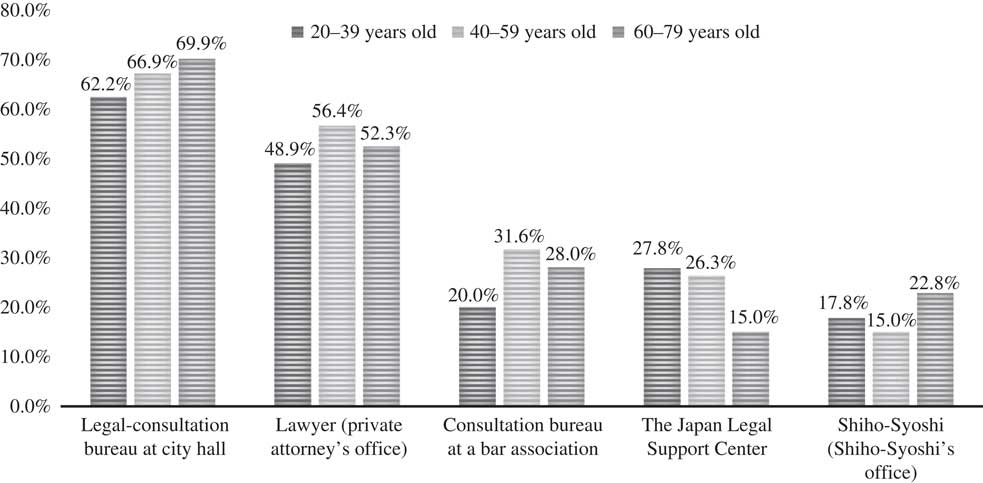
Furthermore, respondents who answered that they knew the location of legal consulting were asked to specify places (multiple answers).Footnote 85Figure 5 shows the top five answers. More elderly respondents tended to mention this bureau at the local government office. Although it was not statistically significant, more elderly respondents tended to mention this bureau, suggesting that legal services at local government offices are generally familiar to people, including the elderly. Generally, a legal consultation at a local government office is offered for less than 30 minutes and is free for local citizens. Lawyers from the bar association provide legal services in rotation.
Availability of legal consultations that respondents know about—Question: Please choose as many of the following places as you know (N=416)

3.3.2 Interview Survey
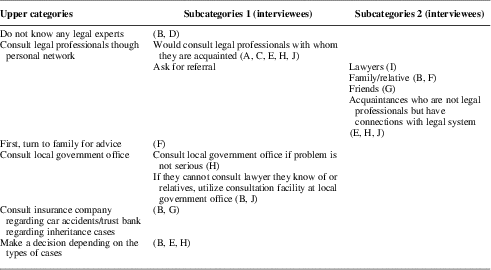
The web-survey study results raised two questions. First, how do the elderly decide which legal-consultation service they should opt for? Second, how do the elderly unaware of the availability of legal consultation handle law-related problems? These questions were examined in the interview survey. During interviews, interviewees were asked which legal services they would utilize if they faced legal challenges in the future and why (Table 8).
a) Do Not Know Any Legal Experts
As previous studies have pointed out,Footnote 86 lack of information is the first challenge for people, including the elderly, in seeking legal advice. Interviewees B and D said they were unaware where to receive legal advice on inheritance or adult guardianship. Interviewee B had no experience of lawyer consultation but thought his brother-in-law could introduce him to a lawyer if needed. Conversely, Interviewee D had not made any previous contact with legal professionals when he consulted a lawyer at the age of 53.
b) Consult Legal Professionals Through Their Personal Network
Interviewees who know specific lawyers answered they would consult legal professionals of their acquaintance (Interviewees A, C, E, H, and J). Also, some said they would ask someone such as lawyers, family, friends, or acquaintances for referrals (Interviewees B, E, F, G, H, I, and J). Interviewees E and H said they would hesitate to consult a lawyer whom they would be meeting for the first time. This suggests that contact with legal professionals increases their confidence in legal professionals and psychologically facilitates legal services access. As Interviewee E noted: “I hesitate to consult a lawyer without a personal connection or referral from someone. Maybe we need a new system that makes it easier for us [i.e. first-time clients] to consult a lawyer.”
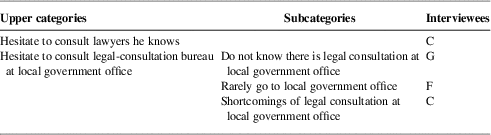
In contrast, Interviewee C argued he would be reluctant to consult a lawyer he knew (Table 9) because he would need to explain personal issues relevant to his privacy. In other words, he would hesitate to talk about his personal issues to a lawyer who knew too much about him: he would prefer to ask the lawyer to refer him to someone else.
c) Family
Interviewee F said she would first turn to family for advice. Ellison et al. argued that elderly people tend to depend on informal networks at first rather than seeking advice from legal professionals.Footnote 87 It is known that Japanese elderly people usually consult family first when they face any anxiety.Footnote 88
Since Interviewee F carried out her father’s nursing care at home and could not leave often, she said she would be unable to access lawyers without using her family’s or close friends’ networks. In other words, personal networks with family or friends with a larger social network are very important for those elderly who do not know any legal professionals.
d) Local Authority
As the web survey showed, 135 of 315 (38.5%) elderly respondents are aware of the availability of legal consultation at local government offices. This consultation is easily accessible to everyone, including elderly people, in Japan.
Some interviewees would consult a legal professional available at the local government office if the problem is not very serious (Interviewee H) or if the interviewee cannot consult lawyers of their acquaintance or relatives (Interviewees B and J). According to Kosai, 80% of respondents who used legal-consultation services at the local government office did not know any lawyers.Footnote 89 Conversely, in this survey, Interviewees J and H did know specific legal professionals. They stated they would choose among legal services depending on case type. Such elderly people can utilize the resources and knowledge that they have obtained from their years of experience.
In contrast, Interviewees C, F, and G would hesitate to use local government office legal consultation (Table 9). Interviewee G did not know anything about such legal consultation and Interviewee F rarely goes to the local government office. Additionally, Interviewee C pointed out one of the shortcomings of the legal consultation provided there: most of the bar-association lawyers providing the service cannot be hired by the person consulting them because the service is treated as a government service.Footnote 90
In short, although the local office is one of the most easily accessible legal services for elderly people, some of them expect it will provide only limited results.
e) Insurance Company and Trust Bank
Interviewees B and G stated that they would consult insurance companies in relation to car accidents, whereas they would choose a bank specializing in trusts for inheritance cases. Elderly people can easily access private companies for specific cases. In fact, the number of wills that trust banks are keeping increased from 20,167 in 1996 to 128,366 in 2017.Footnote 91
f) Make a Decision Depending on the Types of Cases
Choices of legal consultation for future use and the reasons

Legal services that the interviewees do not consult

Interviewees B, E, and H explained they would decide whom to consult depending on case type, suggesting that a legal case’s nature would affect not only people’s access to, but also their choice of, legal services.Footnote 92
4. CONCLUSION
Based upon interpretations of data obtained from both the web and interview survey, the answers to the research questions posed are presented as follows.
First, elderly people tend to experience problems involving family or relatives, property-boundary cases, and concerns with neighbours. Although these problems are not unique to elderly people, they may have more occasion to face them compared to younger people. Since the problems listed above are usually prolonged and emotional, support for elderly people from third-party or specialized agencies including legal professionals seems necessary.
Second, elderly people could access legal services if able to recognize their problems as legal and if they had connections with legal professionals. Those elderly people who did not consult lawyers fell into two groups. The first did not seek to access a lawyer because their resources or experience allowed them to solve the problems by themselves. Elderly respondents belonging to this first group have connections to legal professionals. In contrast, elderly respondents in the second group did not have any lawyer connections. They did not consult lawyers because they felt helpless and because of this lack of connection with or information about legal services. Concerns about cost were not critical to the decision: some people may not worry about legal-consultation cost if they can acquire helpful advice.Footnote 93
Third, more elderly respondents had knowledge about the sources of legal consultation compared to younger people. However, more male elderly respondents had knowledge compared to their female counterparts and more working elderly respondents had knowledge compared to their non-working counterparts. Also, if elderly people face legal challenges, they prefer to consult legal professionals in their personal network. For those who do not have connections with legal professionals, legal consultation at the local government office and family members function as important information sources.
The result contributed to the theoretical advancement of the literature on access to justice. The result showed that the feeling of helplessness among the elderly interviewees affected their decisions not to consult legal professionals. In other words, the elderly interviewees recognized their prolonged problems as difficult problems, which could not be solved by any special agency. Additionally, the elderly’s constructed negative image of lawyers affected his non-use of legal consultation. The result supports the theory that the social construction of a person’s problems is one of the most important factors affecting access to justice.Footnote 94 This means that research and policy focusing on access to justice should pay attention not only to resources (such as family income and connections with legal professionals), but also to how people’s problems or needs are constructed socially.
As a whole, elderly people are not a uniform population. Some have sufficient resources that they do not encounter difficulties in accessing legal services. However, others cannot recognize their problems as legal, feel helpless, or have little knowledge about legal consultation. For the former group, the current approaches of legal professional organizations such as free telephone consultation would be effective. However, for the latter group, legal professionals need to help them recognize their legal problems. Since the number of legal professionals who can provide legal support for elderly people in Japan is limited, they should consider co-operating with other professionals or organizations. For example, social workers, who work closely with elderly people, can identify the elderly’s legal problems easier than can legal professionals. Co-operating with social workers is also meaningful when the elderly’s judgement capacity is questionable. According to the interview survey, consultation at local government offices is one of the desirable possibilities because elderly people can easily access such services. For example, some cities are trying to solve the elderly’s problems by co-operating with the JLSC. When local authority social workers have questions about citizens’ problems, JLSC lawyers provide legal information to them by phone.Footnote 95 Moreover, in other countries, some lawyers practise in co-operation with social workers.Footnote 96 How legal professionals and local authorities or other welfare workers can refine the co-operation model needs to be discussed in future studies.
On the other hand, some elderly people cannot even access local government offices. The female interviewee who was taking care of her father at home said that she did not have a chance to consult local government offices. Further, elderly people who were female and not working tend to not know of any legal services, including legal consultations at local government offices. Since over half the elderly households are single-elderly households and elderly-couple households,Footnote 97 it will be harder to facilitate elderly’s access to specialized agencies by family. Outreach activities by local government officers, especially social workers or local community, would be effective in identifying elderly people who have such problems.
This study has some limitations. First, some sampling issues existed in both the web and interview surveys. Since the web survey entails Internet access, people who do not use the Internet were unable to participate. As mentioned earlier, however, more Japanese elderly people are currently accessing the Internet, so the representativeness of Internet samples is not as serious a problem as it was a decade ago. To generalize the conclusions, we need to conduct a similar study to replicate the results.Footnote 98 Additionally, the interview survey was conducted using snowball sampling and the number of interviewees was limited. Further research targeting elderly people with more variety in terms of gender, health condition, income, or family factors is necessary to generalize the points that arose from the interview survey. Family factors, such as taking care of elderly parents at home, can make the elderly struggle to access legal professionals, as the results suggested.
Second, as mentioned in Section 2, “elderly people” was operationally defined as people aged 60 years and over in both surveys to ensure appropriate ethical consideration. As a result, this paper could not discuss elderly people whose judgement capacity is declining, based on data. Other research designs, such as asking help from their family to answer the questions or interviewing service providers,Footnote 99 are necessary in order to obtain data on such elderly people.
Third, the respondents were limited to the Tokyo metropolitan area. Of course, residents from other regions may experience other issues, such as distance from legal consultation. Further research regarding the differences between residents from the Tokyo metropolitan area and from other areas, especially the countryside, will be valuable for portraying the whole picture of Japan’s legal access.
Fourth, some of the present findings may be only applicable to the currently elderly. Additional research is necessary to identify differences between different generations.Footnote 100