Introduction
In addition to facial schwannoma, other benign tumours of the middle ear that have been reported to lead to the development of facial palsy include glomus tumour,Reference Yamamoto, Ohmura, Isono, Hirano and Mizukami1, Reference Michaels and Hellquist2 adenomaReference Jahrsdoerfer, Fechner, Moon, Selman and Powell3, Reference Hagen, Leonard, Ichionse and Cox4 and haemangioma.Reference Salib, Tziambazis, McDermott, Chavada and Irving5–Reference Eby, Fisch and Makek7 In the present report, we describe a case of lymphangioma of the middle ear which led to the development of facial palsy. Histopathological examination revealed infiltration of the lymphangioma into the facial nerve tissue, suggesting that this infiltration was the cause of the facial palsy.
Case report
A 61-year-old man was referred to our department with the chief complaints of left-sided hearing impairment and left facial palsy. The left-sided hearing impairment had been found during a routine medical examination in the summer of 2001, and the patient had visited an otolaryngologist. Exudative otitis media had been diagnosed and the clinical course observed. At the beginning of autumn of the same year, the patient had felt that his left lip movement was not smooth, and he had visited the ENT department of a university hospital. No abnormality had been found and the patient's symptoms had been left untreated. The palsy had worsened thereafter, and the patient had visited the ENT clinic of a general hospital. A red, tumourous lesion was noted in the left tympanum, together with exudate retention. A left facial palsy was also noted. Therefore, the patient had been referred to our ENT department on 3 September 2002.
The patient had no particular past medical history or familial medical history.
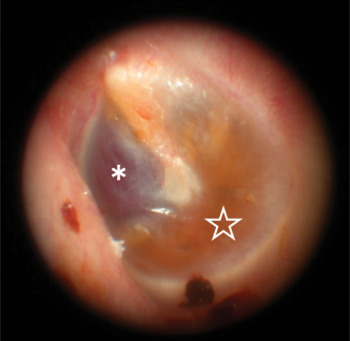
At the first visit to our ENT clinic, a dark red, nonpulsatile mass was seen through the anterosuperior quadrant of the left tympanic membrane on otoscopy. Exudate retention was also noted (Figure 1). Facial palsy was scored as 27/40 using Yanagihara's grading system (grade III using the House–Brackmann grading system).
Otoscopic findings for the left tympanic membrane. A dark red mass (*) is seen through the anterosuperior quadrant, with retained exudate (✯).

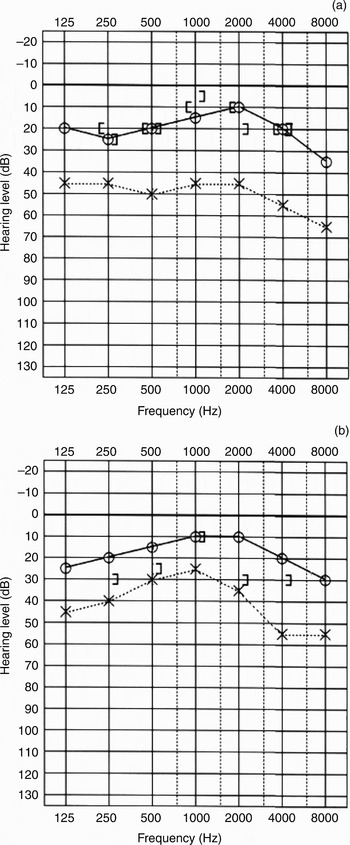
On pure tone audiometry, conductive deafness (at 46 dB) accompanied by a 34-dB air–bone conduction gap were identified in the left ear, using the quartering method (Figure 2a).
Puretone audiograms: (a) before surgery; (b) after surgery.

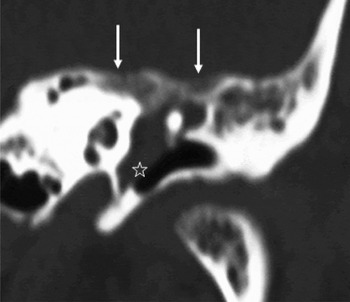
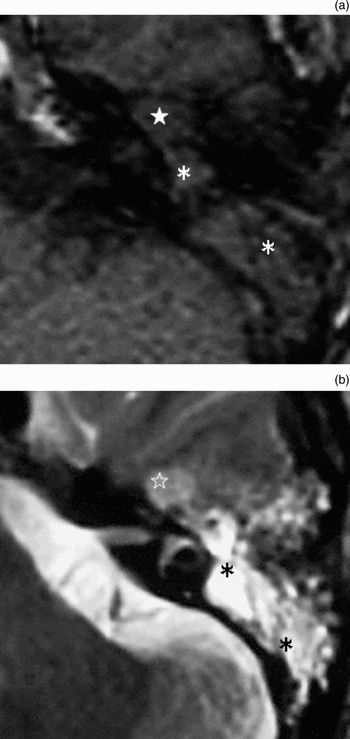
Computed tomography (CT) detected a soft tissue density lesion, accompanied by bony destruction of the middle cranial fossa, in the region encompassing the epi- and mesotympanum (Figure 3). On magnetic resonance imaging (MRI), T1-weighted scans detected a signal equivalent to the parenchymal brain signal in this region, while T2-weighted scans detected a tumourous lesion with a slightly higher signal intensity (Figure 4). These findings suggested a middle-ear tumour such as a glomus tumour or schwannoma. Angiography was performed but no tumour staining was evident.
Coronal computed tomography scan showing a lesion of soft tissue density (✯) in the epi- to mesotympanum region. Bone destruction (↓) is also seen in the middle cranial fossa.

Magnetic resonance imaging findings. (a) Axial, T1-weighted scan showing a mass (★) with a signal slightly lower than that of brain in the anterior region of the epitympanum. A lesion with a signal iso-intense to that of brain (*) is seen in the region extending from the posterior region of the epitympanum through to the mastoid antrum. (b) Axial, T2-weighted scan showing a mass (✯) with a slightly high intensity signal. A lesion with a high intensity signal (*) is also seen extending from the posterior part of the epitympanum to the mastoid antrum.

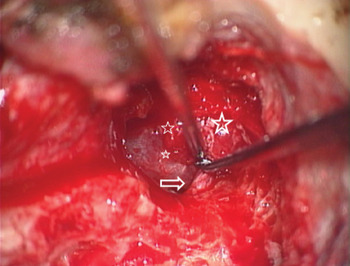
A left middle-ear tumour was diagnosed. This tumour was removed via a transmastoid approach on 26 September 2002. The tumour was dark red and soft with a smooth surface, and occupied the region encompassing the epi- and mesotympanum. The pathology report for a rapidly frozen specimen indicated a vascular system tumour. The tumour was combined with the facial nerve from the geniculate ganglion through to the tympanic portion (Figure 5). As separation of the tumour from the facial nerve was not possible, it was necessary to cut the facial nerve to remove the tumour. To accomplish this, the heads of the malleus and incus were excised in order to clearly visualise the tumour and the facial nerve. The facial nerve stump on the medial side was rerouted to the tympanic portion and connected with the stump of the peripheral region with fibrin glue. The auditory ossicles were reconstructed following the modified type III columella method, using auricular cartilage.
Intra-operative findings. The tumourous lesion (✯) is seen to be joined to the horizontal region of the facial nerve (⇒), occupying the region from the epi- to the mesotympanum.

Facial nerve function was completely paralysed immediately after surgery, but slowly recovered over the following three months. Although synkinesis was noted 16 months after surgery, the patient's Yanagihara score improved to 21/40 (House–Brackmann grade III).
Thirty-two months after surgery, synkinesis was still present and the patient's Yanagihara's score was still 21/40. This score persisted even at seven years and three months post-operatively, indicating that no further healing had occurred. The patient was investigated every year for post-operative recurrence, using CT scanning. The last follow-up CT, performed six years and 11 months post-operatively, revealed no recurrence. The patient's post-operative air conduction threshold also improved, to 26 dB, as measured by pure tone audiometry (quartering method) (Figure 2b).
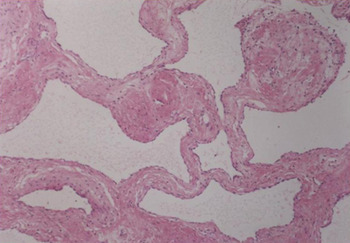
Histopathological examination revealed proliferation of large and small dilated lumina accompanied by relatively homogeneous fibrous stromal spaces, indicating cavernous expansion. Vascular spaces were divided and lumina lined by a single layer of endothelial cells, and no erythrocytes or other blood cells were noted. These findings identified the tumour as a cavernous lymphangioma (Figure 6).
Photomicrograph showing proliferation of dilated lumina accompanied by sclerosing sclerosedstroma. The lumina are lined by a single layer of endothelial cells. No erythrocytes or other blood cells are present, indicating that the tumour is a cavernous lymphangioma. (H&E; ×100)

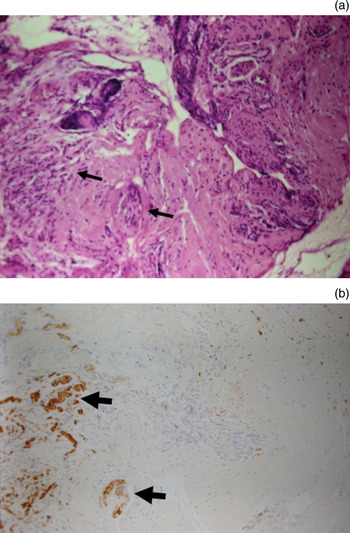
Immunohistochemical analysis identified an S100 protein positive and neuron-specific enolase positive peripheral nerve bundle adjacent to the capsular structure, but no positivity was detected in the centre of the tumour (Figure 7).
(a) Haematoxylin and eosin stained photomicrograph showing tumour invasion of neural tissue (arrows) in the marginal region of the tumour (×200). (b) Photomicrograph of nerve tissue stained for S-100 protein, from the same region, showing tumour tissue invading neural tissue and neural tissue (⇒) surrounded by tumour tissue (×200).

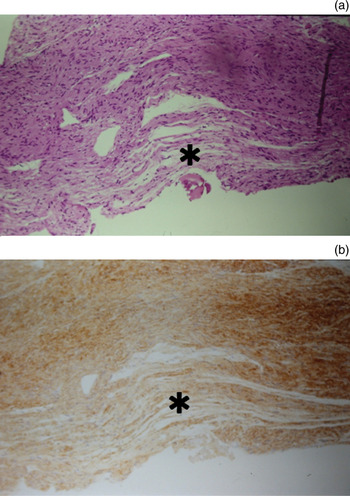
These findings indicated that the tumour had invaded the nerve tissue, and that this was the probable cause of the observed facial palsy. Neural atrophy was noted in the nerve tissue on the peripheral side of the tumour, albeit of a mild degree (Figure 8).
(a) Photomicrograph showing mild and partial neurodegeneration (*) in neural tissue on the periphery of the tumour (H&E; ×100). (b) Photomicrograph of nerve tissue stained for S-100 protein, from the same region, showing mild neurodegeneration (*) (×100).

Discussion
Lymphangioma is a benign, vascular system derived tumour. It commonly occurs in the head and neck region, particularly in the posterior neck triangle.Reference Bailey8–Reference Hancock, St-Vil, Luks, Di Lorenzo and Blanchard10 Occurrence in the temporal bone is very rare. There have been no previously reported cases in Japan, and few elsewhere; none of these latter cases developed facial palsy.Reference Nazarian, Gebarski and Niparko11–Reference Tanna, Sidell, Schwartz and Schessel14 However, there have been several reports of temporal bone haemangioma, another vascular system tumour, with some cases complicated by facial palsy.Reference Salib, Tziambazis, McDermott, Chavada and Irving5–Reference Eby, Fisch and Makek7
Lymphangioma in the temporal bone is reported to be accompanied by bone destruction evident on imaging, as in other vascular tumours.Reference Nazarian, Gebarski and Niparko11, Reference Evans, Baugh, Gildsdorf, Heidelberger and Niparko12 In the present case, differentiation between a small lymphangioma and haemangioma was difficult. Lymphangioma and haemangioma are histopathologically very similar, but lymphangioma can be diagnosed based on the absence of lumenal blood cells. In our patient, no blood cell components were noted in a region bounded by relatively homogeneous stroma, and lymphangioma was thus diagnosed.
• A case of middle-ear lymphangioma with facial palsy is described
• The tumour was accompanied by bone destruction of the middle cranial fossa, and was joined to the facial nerve
• Facial palsy due to a benign middle-ear tumour is rare, and is possibly caused by compression by the tumour and/or vascular compromise
• In this patient, lymphangiomatous invasion of the facial nerve tissue was histopathologically confirmed, suggesting that tumour invasion was the cause of facial palsy
A diagnosis of tumour-induced facial nerve ischaemia is suggested by the developmental history of the resultant facial palsy.Reference Bailey8 In our patient, histopathological examination revealed tumour invasion of the surrounding neural tissue. The tumour and the facial nerve were joined, making separation impossible. The facial nerve on the peripheral side of the tumour was mildly atrophied; tumour invasion may have caused this atrophy and induced facial palsy.
Acknowledgement
We are indebted to Dr Takashi Nikaido, pathologist, for pathological examination of the present case.