


Introduction
Seasonal variations of firn density have been observed in numerous field snow-pit and firn-core studies. These variations are more pronounced in the top several meters of firn, and generally becoming less significant with increasing depth. Interpretation of the causes of these density variations during firn diagenesis is usually complicated by the variety of changing surface weather conditions. At Plateau station in Antarctica where there is no summer melting, the summer section of each annual firn layer generally consisted of a thin, hard, fine-grained layer, while the winter section was softer, coarse-grained and more homogeneous than the summer section (Reference Koerner and CraryKoerner, 1971). However, snow-stratigraphy studies at other polar locations generally showed that summer layers are normally coarser-grained and have lower density and hardness values (e.g. Reference GowGow, 1961; Reference BensonBenson, 1962).
Using improved technology, a very detailed density profile was continuously measured in 3 mm depth intervals along a 181 m core (Reference Gerland, Oerter, Kipfstuhl, Wilhelms, Miller and MinersGerland and others, 1999). This firn/ice core was from the summit of Berkner Island (79°36051′′S, 45°4302800 W), Antarctica, which has an annual mean temperature of –27°C and insignificant summer melting. Such high-resolution measurement provides an excellent and important example for investigating the small-scale characteristics of density evolution during dry-firn densification, which previously has not been satisfactorily explained. In particular, Reference Gerland, Oerter, Kipfstuhl, Wilhelms, Miller and MinersGerland and others (1999) noted that the measured seasonal cycle, which shows higher densities of summer layers found below 25 m depth, was not consistent with observations of higher winter densities in some locations.
Meanwhile, recent analysis of satellite radar altimetry measurements of ice-sheet surface elevations revealed seasonal variations in dry-firn zones. The observed winter surface is generally higher than the summer surface, with the minimum elevation typically occurring before or near the minimum in summer temperature (Reference Zwally and JunZwally and Li, in press). This cycle had not been satisfactorily explained (e.g. Reference Yi, Bentley and StenoienYi and others, 1997) either on the basis of seasonal variations in the effective depth of the radar measurement or by seasonal variations in snow accumulation at the surface. Also, the temperature sensitivity of previous densification models was insufficient to produce a seasonal elevation cycle of sufficient amplitude
Our model of surface elevation changes (Reference Zwally and JunZwally and Li, in press) explained the seasonal surface elevation cycle observed by satellite radar altimeters and produced a significant seasonal variation in firn-density profiles. In this study, we apply our one-dimensional time-dependent numerical model to simulate detailed variations in firn density measured in the Antarctic core by Reference Gerland, Oerter, Kipfstuhl, Wilhelms, Miller and MinersGerland and others (1999). A principal feature of the model is the temperature-dependent formulation of firn densification that is based on laboratory measurements of grain growth. We use a steady-state surface temperature with seasonal amplitude estimated from a nearby automatic weather stations (AWS) and a constant accumulation rate to drive the model.
The Model
Essential to modeling of the density–depth profile is the rate equation for firn densification. The empirical relation given by Reference Herron and LangwayHerron and Langway (1980) is used in the model to calculate the densification rate:

where K is a rate constant that is solely dependent on firn temperature (T), A is the mean accumulation rate, and exponent α is a constant depending on the stage of densification. Equation (1) is based on the suggestion that in the densification of firn the proportional change in air space is linearly related to the change in stress due to the weight (p) of overlying snow (Reference RobinRobin, 1958). The weight change is represented by the accumulation rate (A) which is normally a function of time (t), i.e. dp/dt = A(t). Reference Herron and LangwayHerron and Langway (1980) empirically derived a value of α in Equation (1) of approximately 1 for the density below 550 kgm–3, and we use this value as an approximation for the entire density range.
The temperature dependence of K follows the Arrhenius-type relation shown by
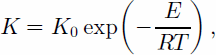
where R is the gas constant. Although K0 and the activation energy have often been used as constants independent of temperature, Reference Herron and LangwayHerron and Langway (1980) derived different values of K0 and E above and below densities of 0.55 from empirical fits to density–depth data. Furthermore, field and laboratory experiments for grain growth and ice creep indicate that the activation energies E for these processes are actually a function of temperature (Reference Jacka and JunJacka and Li, 1994). Reference Zwally and JunZwally and Li (in press) incorporated this feature into the model by using the values of E(T) obtained from a best-fit curve through the data of activation energy for grain growth. To obtain a K (T) temperature dependence that was consistent with the grain-growth measurements also required that K0 be significantly dependent on temperature (so K0 = K0(T)). To account for differences between the rate for densification and grain growth, an empirical normalization factor (β) was applied. A value of β = 8 was derived by matching modeled and measured density–depth curves. Equation (1) provides a constitutive relation that takes into account the effects of stress and temperature on the rate of densification, without attempting to describe the specific processes of deformation, compaction and mass transfer involved in the densification.
The link between the changes in depth and density is given by Equation (3). A firn layer is considered with initial thickness determined by the precipitated snow with surface density ρ0 in a time-span dt. Equation (1) is applied to each firn layer to calculate the densification rate during dt and thus the density. Assuming the density within each layer is reasonably uniform, for the layer at a depth i and time j the corresponding change (vij) of the layer thickness (hij) caused by the density change is given by

The burial depth (z) at any given layer can then be estimated by the sum of the remaining thicknesses of all firn layers at the depth above.
Variations of temperature with time in each firn layer are computed based on the standard heat-transfer equation (Reference PatersonPaterson, 1994)

where f is the thermal diffusivity depending on firn density. We have also used the analytical solution of Equation (4) assuming the surface air temperature varies in regular sine function of time with the amplitude Ta (Reference PatersonPaterson, 1994).The temperature and the density for a firn layer are calculated at the same time.
Results And Discussion
The model is driven by the surface air temperature with a regular seasonal cycle and by a constant accumulation rate. Time-steps are 30 days. AWS records from two nearby stations AGO-A84 (84.36°S, 23.86°W) and Limbert (75.42°S, 59.95°W), respectively located at higher and lower latitude than the drilling site, show the maximum variation of monthly mean surface temperature is approximately 31°C (Reference Keller, Weidner, Stearns, Whittaker and HolmesKeller and others, 1999, Reference Keller, Weidner, Stearns, Whittaker and Holmes2001). Therefore, we use 15.5°C as the approximate amplitude (Ta) of the surface temperature with annual mean –27°C to derive the firn temperature for the drilling site. We also use annual mean accumulation rate 174 kgm–2 a–1 from the drilling site with surface snow density 300 kgm–3 (Reference Gerland, Oerter, Kipfstuhl, Wilhelms, Miller and MinersGerland and others, 1999).
The modeled depth–density profile is compared to the field observation in Figure 1. The shaded area shows the envelope of modeled density variations with depth. Two dashed lines with markers in Figure 1 indicate the range of observed seasonal density variations derived from the mean density profile given by Reference Gerland, Oerter, Kipfstuhl, Wilhelms, Miller and MinersGerland and others (1999), and a modified-curve depth–density variation range for the site (see below). In their core analysis, Reference Gerland, Oerter, Kipfstuhl, Wilhelms, Miller and MinersGerland and others (1999) found a reverse change of the density variation at 25–50m along the general decreasing trend of the density variation with increasing depth (density), forming a second peak of the density variation around 50m depth. In this analysis, we consider that this second peak of density variation is abnormal, which is possibly due to the interannual changes of the surface weather conditions. Changes in physical properties of ideal dry firn during densification more likely follow a continuous trend. By following the general trend of Reference Gerland, Oerter, Kipfstuhl, Wilhelms, Miller and MinersGerland and others (1999, fig. 4), a modified curve showing the range of seasonal variation of measured density with depth for the site is given in Figure 2 as indicated.
Comparison of modeled and observed depth–density profiles for Summit of Berkner Island. Dark area shows the envelope of modeled density variation. Dashed lines with markers indicate the range of observed density variation modified from Reference Gerland, Oerter, Kipfstuhl, Wilhelms, Miller and MinersGerland and others (1999).

Modeled (solid line) and observed (dashed line) range of density variation vs depth for Summit of Berkner Island. Data shown by the dashed line are modified from Reference Gerland, Oerter, Kipfstuhl, Wilhelms, Miller and MinersGerland and others (1999).

As shown in Figure 1, our modeled density–depth profile follows the observation with a similar range of density variationthat declines with increasing density or depth. However, it is evident from Figure 2 that the modeled density variation does not match the observed curve perfectly. In particular, the modeled densification rate exceeds the observed rate before the density reaches approximately 500 kgm–3, although the modeled density appears to be within the range of observed density variations. Besides any imperfections in the model, it should be noted that the observed density variations may bias to its steady-state profile due to the possible interannual changes of surface weather conditions.
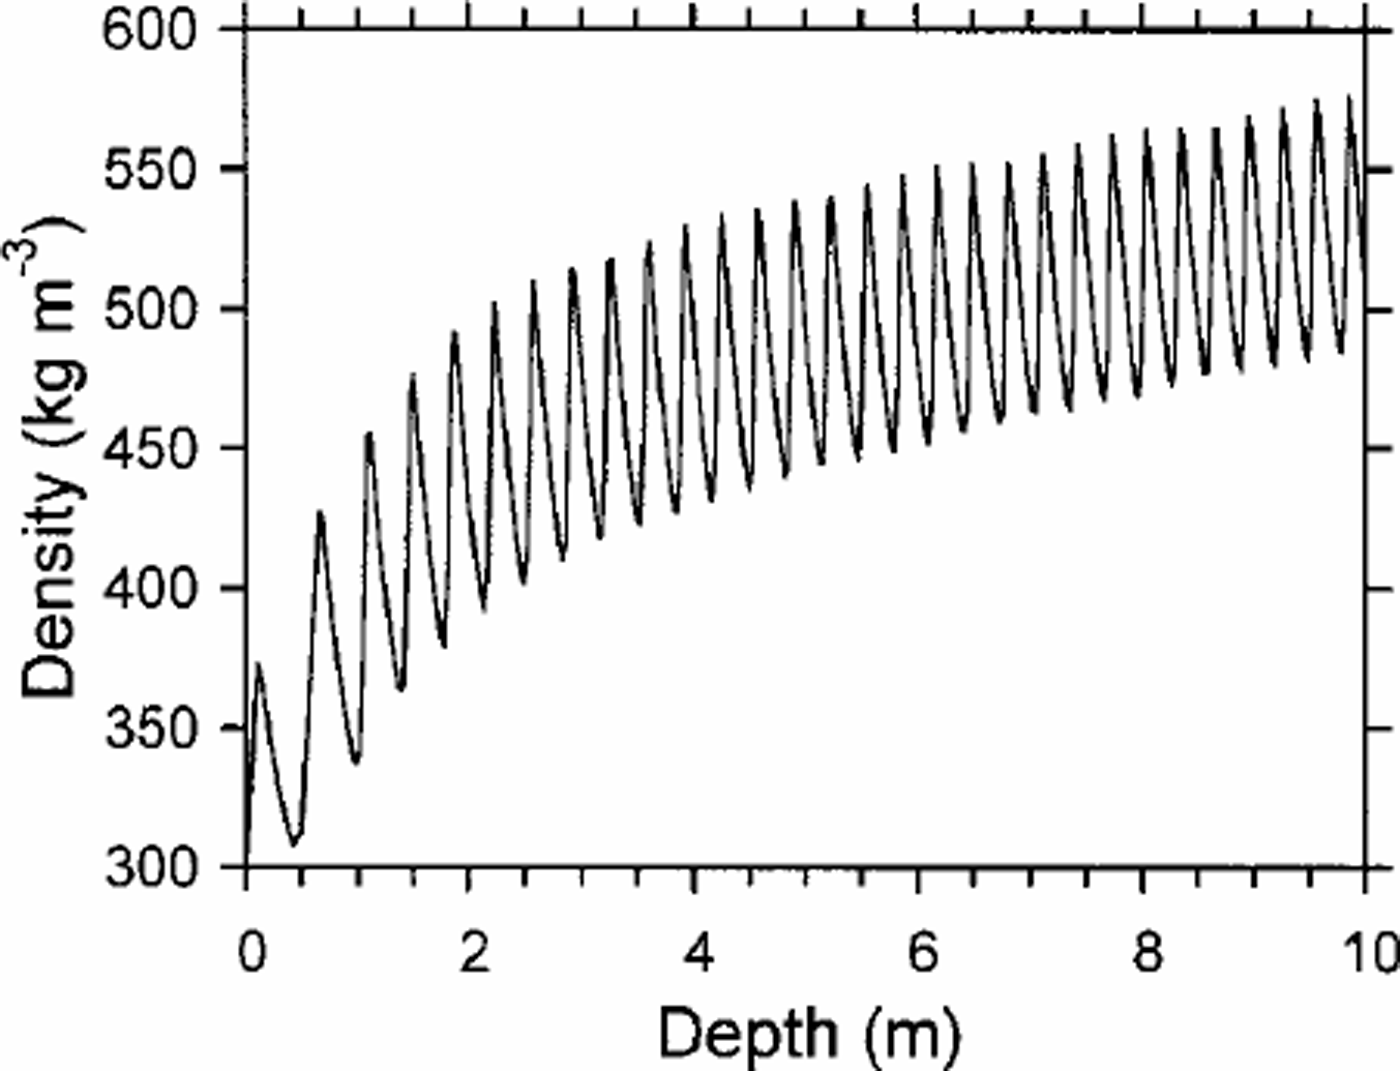
After detailed examination of the density data, Reference Gerland, Oerter, Kipfstuhl, Wilhelms, Miller and MinersGerland and others (1999) indicate that the variations in firn density shown in Figure 1 are actually seasonal. The magnitude of these seasonal variations decreases continuously with depth. This feature of seasonal variation in firn density has been well modeled in our results. Figure 3 presents in larger scale the modeled density variations for the first 10 m shown in Figure 1. The magnitude of the variation decreases with depth as indicated in Figures 1–3. This characteristic of the seasonal variation in firn density also agrees well with the field findings at Plateau station, Antarctica (Reference Koerner and CraryKoerner, 1971).
Seasonal variations in firn density shown by modeled depth–density profile for Summit of Berkner Island.
To examine the specific seasonality in the density variation, we follow the density evolution for each firn layer deposited at 30 day time intervals within a 1year surface temperature cycle, as shown in Figure 4. The densification history of three selected firn layers, together with the corresponding temperature history following deposition, is shown in Figure 5. As shown in Figure 4, firn layer zero (C0) is deposited in early spring approximately 3 months prior to the maximum summer temperature. This snow begins to densify at a higher rate as the temperature increases following deposition. Firn layer 5 (C5) is deposited in autumn about 2 months after the maximum summer temperature. Layer C5 densifies a little while the temperature is in mid-cycle after the deposition, as indicated by the small step of the density curve. However, with the fall in temperature toward winter, the densification is essentially quenched until the next warm season starts in spring. The second step in density of C5 is smaller than the first step for layer C0 deposited in the warm season, because C5 is partially insulated by the winter deposited snow. This autumn snow had the lowest density of any of the 30 day layers. Snow deposited in winter obtains a density between these two extremes, as shown by the plot for layer C11.
One-year surface air temperature (30 day mean) cycle in each 30 day time interval. The figure beside each marker indicates the number of the 30 day time interval from the beginning of the year corresponding to the time of deposition of the modeled layers.

Densification history of three selected firn layers together with the temperature history experienced by the corresponding firn layer (cf. numbers in Fig. 4). Late-winter layer C11 and early-spring layer C0 obtain higher densities than late-autumn layer C5 (lowest density).

The longer-period temperature histories for firn layers C0 and C5 in Figure 6 show that after subsequent seasons the temperature histories of the maximum- and minimum-density layers are not very different. Clearly, the temperature history of a layer during the first seasonal cycle is the primary determinant of the initial densification, which then remains correspondingly high or low as densification continues. The densification history for the 12 seasonal layers in Figure 7 shows that layers C0–C3, C11 and C12, which are deposited when surface temperature (Ts) is increasing (i.e. dTs/dt > 0), obtain higher densities than layers C4– C9 which are deposited when the temperature is decreasing (dTs/dt <0). Therefore, it is the spring through early summer layers that obtain the highest densities, and the autumn through early winter layers that obtain the lowest densities.
Modeled temperature profiles showing the decrease of amplitude of firn temperature experienced by layers C0 (dashed line) and C5 (solid line) while the firn layers travel downwards as implied by the changes with time. After the first year the temperature histories are similar.

Sequence of the density history for each snow layer indicated in Figure 4 showing the seasonal variations of the density in each seasonal firn layer.

Conclusion
The high-resolution density profile of the 181m core retrieved from the summit region of Berkner Island provides an excellent example of firn densification, especially the seasonal-scale density variations detailed to seasonal scale. We believe that the model presented here provides a good description of the densification process that leads to the observed seasonal cycle in firn. The surface temperature cycle is sufficient to generate the seasonal variations in density profile that are observed in dry polar firn. Themaximumdensities occur in the firn layers deposited during late spring to early summer, and minimum densities in those deposited in autumn to early winter.



