

Introduction
Biostatisticians are an increasingly vital and influential component of the clinical and translational research (CTR) workforce [Reference Zelen1–Reference Pomann, Truong and Boulos7]. However, there is a clear need for tailored training for biostatisticians in team science, interdisciplinary collaboration, and particularly in the areas of leadership and communication skills [Reference Oster, Devick and Thurston8–Reference Slade, Brearley and Coles10]. This need for training in leadership and communication is evidenced among biostatisticians working in both academic medical centers and federated research networks [Reference Vasilopoulos and Tumin11–Reference Mehta, Stedman, Rao and Podolsky12].
Networks created to facilitate the professional development of biostatisticians working across academic medical centers have recently been established within the Clinical and Translational Science Award (CTSA) Consortium, a set of 60+ research centers funded by the National Institutes of Health’s National Center for Advancing Clinical and Translational Science (NCATS) [Reference Khalatbari, Baladandayuthapani, Kaciroti, Samuels, Bugden and Spino13]. Additionally, novel training programs have been developed for biostatisticians at individual universities, including some within the CTSA Consortium [Reference Pomann, Truong and Boulos7,Reference Pomann, Boulware and Cayetano9,Reference Desai, Boulos and Pomann14–Reference Peskoe, Slade and Rende17].
This growing body of empirical literature demonstrates how academic medical centers in the CTSA Consortium play a key role in facilitating dissemination of professional development training for biostatisticians within and beyond the Consortium. Yet despite the recent growth of empirical research on the topic, there remains a largely unmet need for demonstrably effective professional development programs for biostatisticians working in American academic medical centers [Reference Huebner, Pierce, Dennhardt, Akaeze, Jess and Ma18,Reference Faupel-Badger, Vogel, Austin and Rutter19].
In sum, a key challenge inhibiting the professional development of the biostatistical workforce is the lack of broadly accessible and effective training opportunities tailored for biostatisticians, particularly training opportunities on leadership and communication. This paper addresses that gap by evaluating the development and dissemination of a training workshop for biostatisticians. Specifically, it focuses on leadership and communication training at one academic medical center and its dissemination to other universities within the CTSA Consortium and beyond. Our results further demonstrate how Clinical and Translational Science (CTS) can be used as a lens to explore how the biostatistical component of the CTR workforce can be professionalized more efficiently.
This study contributes to the growing body of CTS research demonstrating biostatisticians’ need for professional development and the impact of training programs tailored for this critical component of the CTR workforce [Reference Zelen1–Reference Faupel-Badger, Vogel, Austin and Rutter19]. Findings highlight the potential of developing and evaluating training that can be disseminated across multiple CTR networks and inform generalizable principles for Clinical and Translational Scientists [Reference Rahbar, Dickerson and Ahn20].
Background
The CTSA Consortium and NCATS have played a critical role in disseminating biostatistical support and training across American academic medical centers [Reference Enders, Golembiewski, Orellana, Silvano, Sloan and Balls-Berry21]. While some existing training programs for biostatisticians include leadership and communication topics, there is increasing recognition of the need to expand development in these areas to enable biostatisticians to effectively contribute to large-scale scientific collaborations [Reference Slade, Brearley and Coles10,Reference Griffith, Sharp, Bridges, Craig, Hanford and Stevens22,Reference Khalatbari, Jazdzyk, Capsouras, Downey, Samuels and Spino23].
The Michigan Institute for Clinical and Translational Research (MICHR), the CTSA at the University of Michigan (U-M), supports the biostatistical workforce and initially developed and disseminated the training program evaluated in this work. Although evidence-based models for supporting biostatisticians within a single academic medical center exist, they do not address the need for broader dissemination [Reference Pomann, Boulware and Cayetano9,Reference Desai, Boulos and Pomann14,Reference Hanlon, Lozano and Prakash15]. Rigorously designed multi-center evaluations are essential to identifying effective, scalable strategies for professional development of this vital component of the translational research workforce. To achieve this objective, MICHR designed the evaluations to facilitate dissemination of the training workshop across the CTSA Consortium.
Biostatistical experts at U-M are employed across multiple schools, colleges, and departments. For example, while some biostatisticians are clustered in a single academic department in the School of Public Health, the majority of U-M’s biostatical workforce is dispersed across other University departments and units, including throughout Michigan Medicine and the university’s health system. To enhance access to professional development throughout U-M, MICHR established the Applied Biostatistical Sciences (ABS) Network in 2018 to provide expanded support and training to biostatisticians university-wide [Reference Khalatbari, Baladandayuthapani, Kaciroti, Samuels, Bugden and Spino13,Reference Sasaki24].
MICHR routinely administered needs assessments of ABS Network members, following established best practices for program evaluation [Reference Youker25–Reference Pandey, Maina and Amoyaw29]. The results guided efforts to address members’ professional development needs [Reference Khalatbari, Baladandayuthapani, Kaciroti, Samuels, Bugden and Spino13]. Building on prior efforts to develop novel training for U-M biostatisticians in 2019, MICHR sought to develop new leadership and communication training opportunities in 2023.
Rationale
The rationale for developing and disseminating this novel training is two-fold. First, providing such training helps connect biostatisticians who are organizationally isolated both within and across academic medical centers [Reference Vasilopoulos and Tumin11,Reference Mehta, Stedman, Rao and Podolsky12]. Evaluating the development and broad dissemination of this training adds to the rapidly growing body of empirical literature on best practices in biostatistical training and support programs in U.S. academic medical centers [Reference Huebner, Pierce, Dennhardt, Akaeze, Jess and Ma18,Reference Faupel-Badger, Vogel, Austin and Rutter19].
Second, the leadership and communication training allows MICHR to evaluate whether its impact varies across biostatisticians within and between institutions, including those for whom English is a second language (ESL). While there is robust evidence suggesting that differences in language proficiency of health care providers pose a challenge to the operations of health care organizations [Reference Murphy, Harper and Jay30], there is growing evidence suggesting that the same challenge can impact the work of the clinical and translational research organizations as well [Reference Varma, Samuels and Piatt31–Reference Caproni34]. For this reason, this study evaluated how training impact differed for ESL versus non-ESL biostatisticians across academic medical centers.
The aim of this study is to evaluate the impact and dissemination of a workshop for biostatisticians designed to address the demonstrated need for training on leadership and communication skills. Given the national scope of the CTSA Consortium and the persistent challenges faced by biostatisticians, we evaluated biostatisticians’ self-confidence in leadership and communication skills and the associated differences between U-M biostatisticians and biostatisticians employed by different CTSA institutions. This research was funded by funded by NCATS, UM1TR004404.
Methods
Workshop development & delivery
To develop the workshop in leadership and communication MICHR recruited three subject matter experts from both within and outside U-M to collaboratively design the training. One expert provided input on leadership and communication skills, while the other two provided input on applying these skills to statistical collaborations and consulting activities for CTR study teams.
The U-M workshop was designed as a two-day, in-person workshop for full-time staff biostatisticians working in any U-M department or unit, including all ABS Network members. The workshop totaled 16 hours of instruction split evenly over two days and incorporated a blend of instructional materials, self-assessments, collaborative activities, simulated consulting scenarios, real examples, and role-playing exercises. Each day had distinct learning objectives and outcomes. [See learning objectives and content in supplementary materials: LCW Syllabus].
The first day of the workshop focused explicitly on leadership and communication skills and was facilitated by an expert with experience delivering similar training to highly qualified professionals, including executive administrators and researchers in higher education institutions [Reference Kirkpatrick and Kirkpatrick35]. This portion of the training was designed to enhance participants’ understanding and application of four essential professional and leadership styles:
-
1. Visionary: Inspires by communicating the big picture and purpose.
-
2. Strategist: Focuses on achieving crucial bottom-line results.
-
3. System Designer: Uses data and processes to align efforts toward impactful results.
-
4. Collaborator: Builds a network of mutually supportive relationships.
Workshop discussions centered on interpreting these styles and assessing one’s own leadership style. Participants then received instruction about how to craft and deliver “messages that stick,” how to build effective professional networks, and how to apply seven universal influence techniques in varied professional interactions.
The second day focused on applying leadership and communication skills to participants’ statistical collaboration and consulting activities. This portion of the workshop included lectures, facilitated discussions, and role-play activities all of which focused on how statisticians can set mutual expectations with collaborators, organize effective meetings, ask strategic questions, address early warning signs, and manage conflicts within and across CTR study teams.
The inaugural workshop was held in Fall 2023 in person at the U-M Ann Arbor campus. Participant recruitment was via monthly communication to ABS Network members and more broadly throughout U-M via monthly MICHR communications. For the remainder of this paper this participant cohort will be referred to as the ABS Cohort. A different approach was used to recruit biostatisticians across the CTSA Consortium for the second iteration of the workshop which was delivered in a virtual format. Modeled on the ABS Network, MICHR launched a national network, the Quantitative Staff Network (QSN), in early 2023, sponsored by MICHR; by the time the second workshop was offered in Fall 2024 the QSN included over 300 members from more than 40 CTSA institutions.
A second version of the inaugural workshop was offered in a virtual format to QSN members in Fall 2024. Evaluation results from the 2023 workshop informed the design and delivery of the training offered to biostatisticians in the QSN. Specifically, the second workshop was condensed to two 3-hour sessions across two days, retaining the core objectives while adapting content for virtual participation and shorter duration. The design of the workshop was changed in response to participant feedback, particularly the need to condense the overall training duration and concerns about accommodating members attending from different time zones. For the remainder of this paper this participant cohort will be referred to as the QSN Cohort. The relevant limitations of this approach are discussed in detail later.
Evaluation approach
A comprehensive evaluation plan was developed for both iterations of the workshop, including survey instruments to assess training program effectiveness and participants’ attainment of the intended outcomes. [See supplementary materials: LCWSurveys] The evaluation instruments used for the first iteration of the workshop were purposefully adapted for the virtual format and shorter duration of the second workshop by eliminating a long-term follow-up survey administered for the ABS Cohort training due to the high response burden on QSN Cohort. As with the design and delivery of the workshop itself, the relevant limitations of this evaluation approach are discussed in detail later.
Surveys were administered before both iterations of the workshop to measure participants’ need for the training. The needs assessment results obtained from the ABS Cohort were compared to the results obtained from the QSN Cohort to validate that similar needs for the training also existed at other academic medical centers beyond U-M. These pre-workshop surveys also included a self-assessment of participants’ confidence in specific skills rated on a 5-point Likert scale (0 = not confident, 5 = completely confident). Additional items measured professional experiences over the prior six months, including exposure to unprofessional behavior and feelings of workplace isolation. Demographic data, including whether English was the participant’s first language, were also collected.
Surveys were also administered after each day of training for both iterations of the workshop. The survey administered after the first day of the workshop gathered feedback on the quality of specific training activities and facilitation. The survey administered after the second day of the workshop assessed specific training activities and facilitation, the impact of the workshop considered overall, and the same self-confidence measures administered in the pre-workshop survey. A six-month follow-up survey measuring longer-term professional impact was conducted only with ABS Cohort to validate that the overall impact of the workshop measured after the second day would persist over time. It was predetermined that if the results of this six-month follow-up survey suggested that the impact of the training persisted, it was not necessary to validate that the impact of the second iteration of the workshop also persisted. The relevance of this approach to potential future directions for CTS studies are discussed in detail later.
Participants provided their names solely to link pre- and post-surveys; confidentiality was maintained by restricting name access to evaluation personnel. The pre-workshop survey was administered when participants registered for the workshop, and they were asked to complete it before Day 1. Day 1 and Day 2 surveys were administered during the workshop. Non-completers for any survey would have received up to 2 reminders. A consent form was included on the first page of the pre-workshop survey. Participation in the evaluation was voluntary and was not required for participation in the workshop.
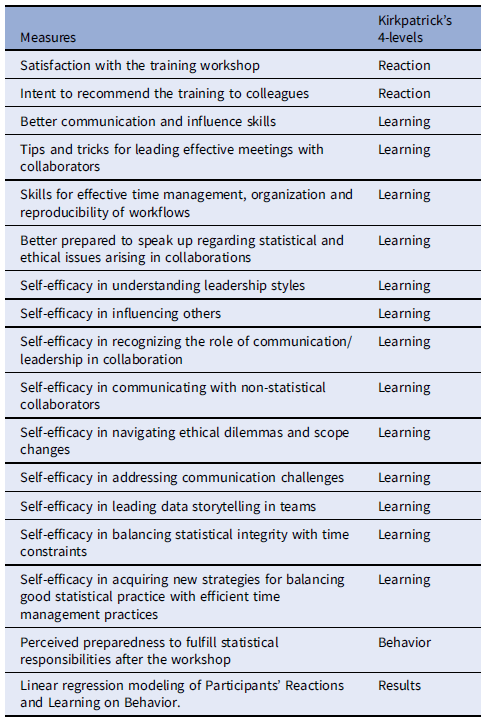
Kirkpatrick’s 4-level evaluation framework for adult training interventions was used to structure the questions included in the workshop surveys [Reference Smidt, Balandin, Sigafoos and Reed36,Reference McLaughlin, Jordan, Wholey, Hatry and Newcomer37]. Logic models were used iteratively with MICHR program administrators and stakeholders to identify key outcomes associated with the training and MICHR’s relevant support of the ABS Network and QSN [Reference Lee, Pusek and McCormack38]. This process enabled the identification of specific survey measures aligned with each of the four levels of the evaluation framework, which include 1) Reaction, 2) Learning, 3) Behavior, and 4) Results. The following paragraphs detail the measures used to evaluate each of these four levels, and a list of these measures is summarized in Table 1.
Survey measures associated with Kirkpatrick’s (2016) 4-level impact model

Table 1. Long description
A table with two columns and 18 rows. The first column is labeled ‘Measures’ and the second column is labeled ‘Kirkpatrick’s 4-levels’. Row 1: Satisfaction with the training workshop, Reaction. Row 2: Intent to recommend the training to colleagues, Reaction. Row 3: Better communication and influence skills, Learning. Row 4: Tips and tricks for leading effective meetings with collaborators, Learning. Row 5: Skills for effective time management, organization and reproducibility of workflows, Learning. Row 6: Better prepared to speak up regarding statistical and ethical issues arising in collaborations, Learning. Row 7: Self-efficacy in understanding leadership styles, Learning. Row 8: Self-efficacy in influencing others, Learning. Row 9: Self-efficacy in recognizing the role of communication/leadership in collaboration, Learning. Row 10: Self-efficacy in communicating with non-statistical collaborators, Learning. Row 11: Self-efficacy in navigating ethical dilemmas and scope changes, Learning. Row 12: Self-efficacy in addressing communication challenges, Learning. Row 13: Self-efficacy in leading data storytelling in teams, Learning. Row 14: Self-efficacy in balancing statistical integrity with time constraints, Learning. Row 15: Self-efficacy in acquiring new strategies for balancing good statistical practice with efficient time management practices, Learning. Row 16: Perceived preparedness to fulfill statistical responsibilities after the workshop, Behavior. Row 17: Linear regression modeling of Participants’ Reactions and Learning on Behavior, Results.
Measures of participants’ reaction to the training were associated with their satisfaction with the workshop and their intent to recommend it to colleagues, both of which are standard measures commonly used to evaluate participant experience [Reference Spaulding39,Reference Robinson, Switzer and Cohen40]. These associations were tested with independent-sample t-test, paired-sample t-tests, and linear regression models. Specifically, independent-sample t-tests were used to evaluate the statistically significant differences between survey responses of the ABS Cohort and the QSN Cohort. Paired sample t-tests were used to evaluate statistically significant differences within participants’ changes over time, with participants pooled across both cohorts. When relevant, paired t-tests were conducted also conducted to evaluate survey changes over time within a single cohort.
Measures of participants’ learning were associated with four key learning outcomes and self-efficacy measures. Participants’ self-efficacy was measured in pre- and post-training as evidence of their self-reported confidence in their communication and leadership skills. Similar measures of self-efficacy have been widely used in Clinical and Translational Science to assess the impact of CTR training programs [Reference Ianni, Samuels, Eakin, Perorazio and Ellingrod41–Reference Prochaska and Velicer43]. Specifically, participants’ self-reported confidence was measured in relation to nine leadership and communication skills identified by the subject matter experts who designed the training, which are listed as learning measures in Table 1.
Measures of participants’ behavior were collected in two ways. First, participant behaviors were measured in their perceived preparedness to fulfill statistical responsibilities after the workshop. This approach to conceptualizing behavior is in alignment with the transtheoretical change model, which asserts that behavioral change is staged across a spectrum of behavior modification and further that advancement along this spectrum represents evidence of whether individuals are ready to change behaviors [Reference Littell and Girvin44–Reference Mubayrik46].
Specifically, participants were asked to respond to the question prompt, “As a result of this workshop overall, I feel better prepared to fulfill my research responsibilities as a statistical subject matter expert” using a 5-point Likert agreement scale. Additional behavioral measures for the first iteration of the workshop were collected six months post-workshop to assess long-term impact.
Linear regression models were used to evaluate workshop results using a comprehensive conceptual framework. Specifically, four regression models examined predictors of the primary behavioral outcome: participant’s perceived preparedness to fulfill their statistical responsibilities. The control variables included in each model represented measures of the participants’ training experience and one of the four learning outcomes measured in this study. In effect, these regression models tested the validity of Kirkpatrick’s 4-level evaluation framework for adult training interventions. These regression models tested whether measures aligned with the first two levels of Kirkpatrick’s framework—1) Reaction and 2) Learning were associated with the third level of the framework, 3) Behavior. We argue that statistically significant results would support the validity of using Kirkpatrick’s framework to evaluate the training by demonstrating that participants’ reactions to and learning from the training were associated with behavioral outcomes that would logically contribute to the desired impact of the training on the ABS and QSN organizations. Such findings would constitute indirect evidence related to the final level of the framework, 4) Results.
Specifically, the dependent variable in all four models was the same measure used to evaluate behavior change, namely, participants’ self-reported preparedness to fulfill statistical responsibilities. This measure was collected immediately after the training period. Four separate regression models were conducted to assess the strategical association between this dependent variable and other measures associated with Kirkpatrick’s framework. Collectively, these models test the association between perceived preparedness and measures associated with the first two levels of Kirkpatrick’s framework, including one learning measure in each model and both measures of participants’ reactions, which were included in all four models. All reaction and learning measures were also collected immediately after the training period. These four separate models were used to test the association between the perceived preparedness and each of the four overarching learning outcomes associated with the training. The rationale for using four separate models instead of one omnibus model is explained in further detail later. Briefly, each model included one independent variable representing one of the four learning outcomes evaluated in this study; the models were estimated separately to reduce the risk of model overspecification given the limited sample size.
All four models also included one independent variable representing participants’ prior professional experience measured as the total years of biostatistics experience. Multiple comparison adjustments were not applied due to the formative design of the evaluation plan [Reference Mubayrik46]. The limitations of the use of regression modeling with this small sample size and with the potential collinearity of predictors are discussed later. However, the focused design of these regression models enabled participant data from both iterations of the training to be used. These models were run to test the hypothesis that participants’ behaviors (i.e., perceived preparedness) were significantly associated with their learning and reaction to the training, controlling for prior professional experience. In other words, the regression models represent a minimal test of the validity of using Kirkpatrick’s 4-level conceptual framework to evaluate the impact of the training (H1).
H1: Greater learning and more positive reactions to the training will be associated with higher levels of participants’ perceived preparedness, controlling for prior professional experience.
Finally, descriptive statistics were generated to summarize participant demographics, continuous data were summarized using means and standard deviations. Categorical data were summarized as counts and percentages. To evaluate within-subject changes in self-reported outcomes such as leadership confidence, communication skills, and perceived isolation, paired t-tests were conducted across pre- and post-workshop time points.
Paired t-tests were used to compare participant experience measures over time and two-sample independent t-tests were used to assess differences between the two iterations of the training: the U-M ABS Cohort and the QSN Cohort. Exploratory subgroup comparisons were conducted by ESL status (non-ESL vs. ESL) and, for the ABS Cohort, by change in outcomes from pre-workshop to the six-month follow-up. A significance level was set at a p < 0.05 for all statistical tests. Analyses were conducted using R 4.41. The University of Michigan Institutional Review Board determined this evaluation was not regulated human subjects research (HUM00247408).
Results
Workshop participants
In 2023, 39 individuals attended at least one day of the in-person workshop held at U-M; this group constitutes the ABS Cohort. The number of responses for the Pre-workshop, Day 1, Day 2/Overall, and six-month follow-up surveys were 38, 38, 39, and 32 respectively, yielding an average response rate of 92% across surveys. In 2024, 53 individuals attended at least one day of the virtually delivered workshop; this group constitutes the QSN Cohort. The pre-workshop survey was distributed to 69 individuals at the time of registration, with 40 participants completing it. A formal response rate was not calculated due to the inconsistent overlap between registration and attendance (i.e., some registrants completed the survey but did not attend, and some attendees did not complete the survey.
Day 1 of the virtual workshop had 52 attendees, with 25 participants completing the Day 1 survey (48% response rate). Day 2 had 47 attendees. An additional 7 individuals who attended Day 1 but not Day 2 were also invited to complete the final (overall) survey, bringing the total number of respondents invited to the final survey to 54. Of those, 22 completed the final survey (41% response rate). A total of 19 participants completed all three surveys (35%). The difference in response rates between the two iterations of the workshop was expected, as participants in 2024 had fewer formal business or research relationships with MICHR. The results of analyses of these survey data are reported below, with all mean values reported in context of their standard deviations (i.e., Mean ± Standard Deviation).
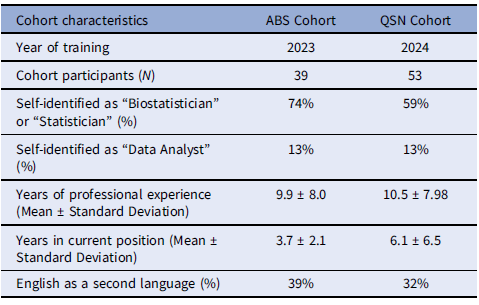
Participants’ job titles were self-reported as predominantly “Biostatistician” or “Statistician,” with 74% of the ABS Cohort and 59% of the QSN Cohort holding these titles. An additional 13% of participants across both cohorts identified as “Data Analyst,” and 21% reported various other related professional titles. The average length of professional experience was similar between the participants in the two cohorts. The ABS Cohort reported a mean of 9.9 ± 8.0 years of professional experience and 3.7 ± 2.12 years in their current position. The QSN Cohort averaged 10.5 ± 7.98 years of experience with 6.1 ± 6.5 years in their current position. A summary of these key characteristics of the ABS Cohort and the QSN Cohort are summarized in Table 2.
Key characteristics of the ABS and QSN Cohorts

Table 2. Long description
A table comparing characteristics of two cohorts, ABS and QSN. The table has 8 rows and 3 columns. Column headers are Cohort characteristics, ABS Cohort, and QSN Cohort. Row 1: Year of training, 2023, 2024. Row 2: Cohort participants (N), 39, 53. Row 3: Self-identified as Biostatistician or Statistician (%), 74, 59. Row 4: Self-identified as Data Analyst (%), 13, 13. Row 5: Years of professional experience (Mean ± Standard Deviation), 9.9 ± 8.0, 10.5 ± 7.98. Row 6: Years in current position (Mean ± Standard Deviation), 3.7 ± 2.1, 6.1 ± 6.5. Row 7: English as a second language (%), 39, 32.
Among those who responded to the English as a second language question, 39% (15 of 38) of the ABS Cohort and 32% (12 of 37) of the QSN Cohort reported speaking ESL. ESL participants reported a mean of 10.1 ± 8 years of experience and 4.3 ± 4.7 years in their current position, while the non-ESL participants had 10.0 ± 7.9 years of experience on average, with 5.2 ± 5.6 years in their current position.
Needs assessment
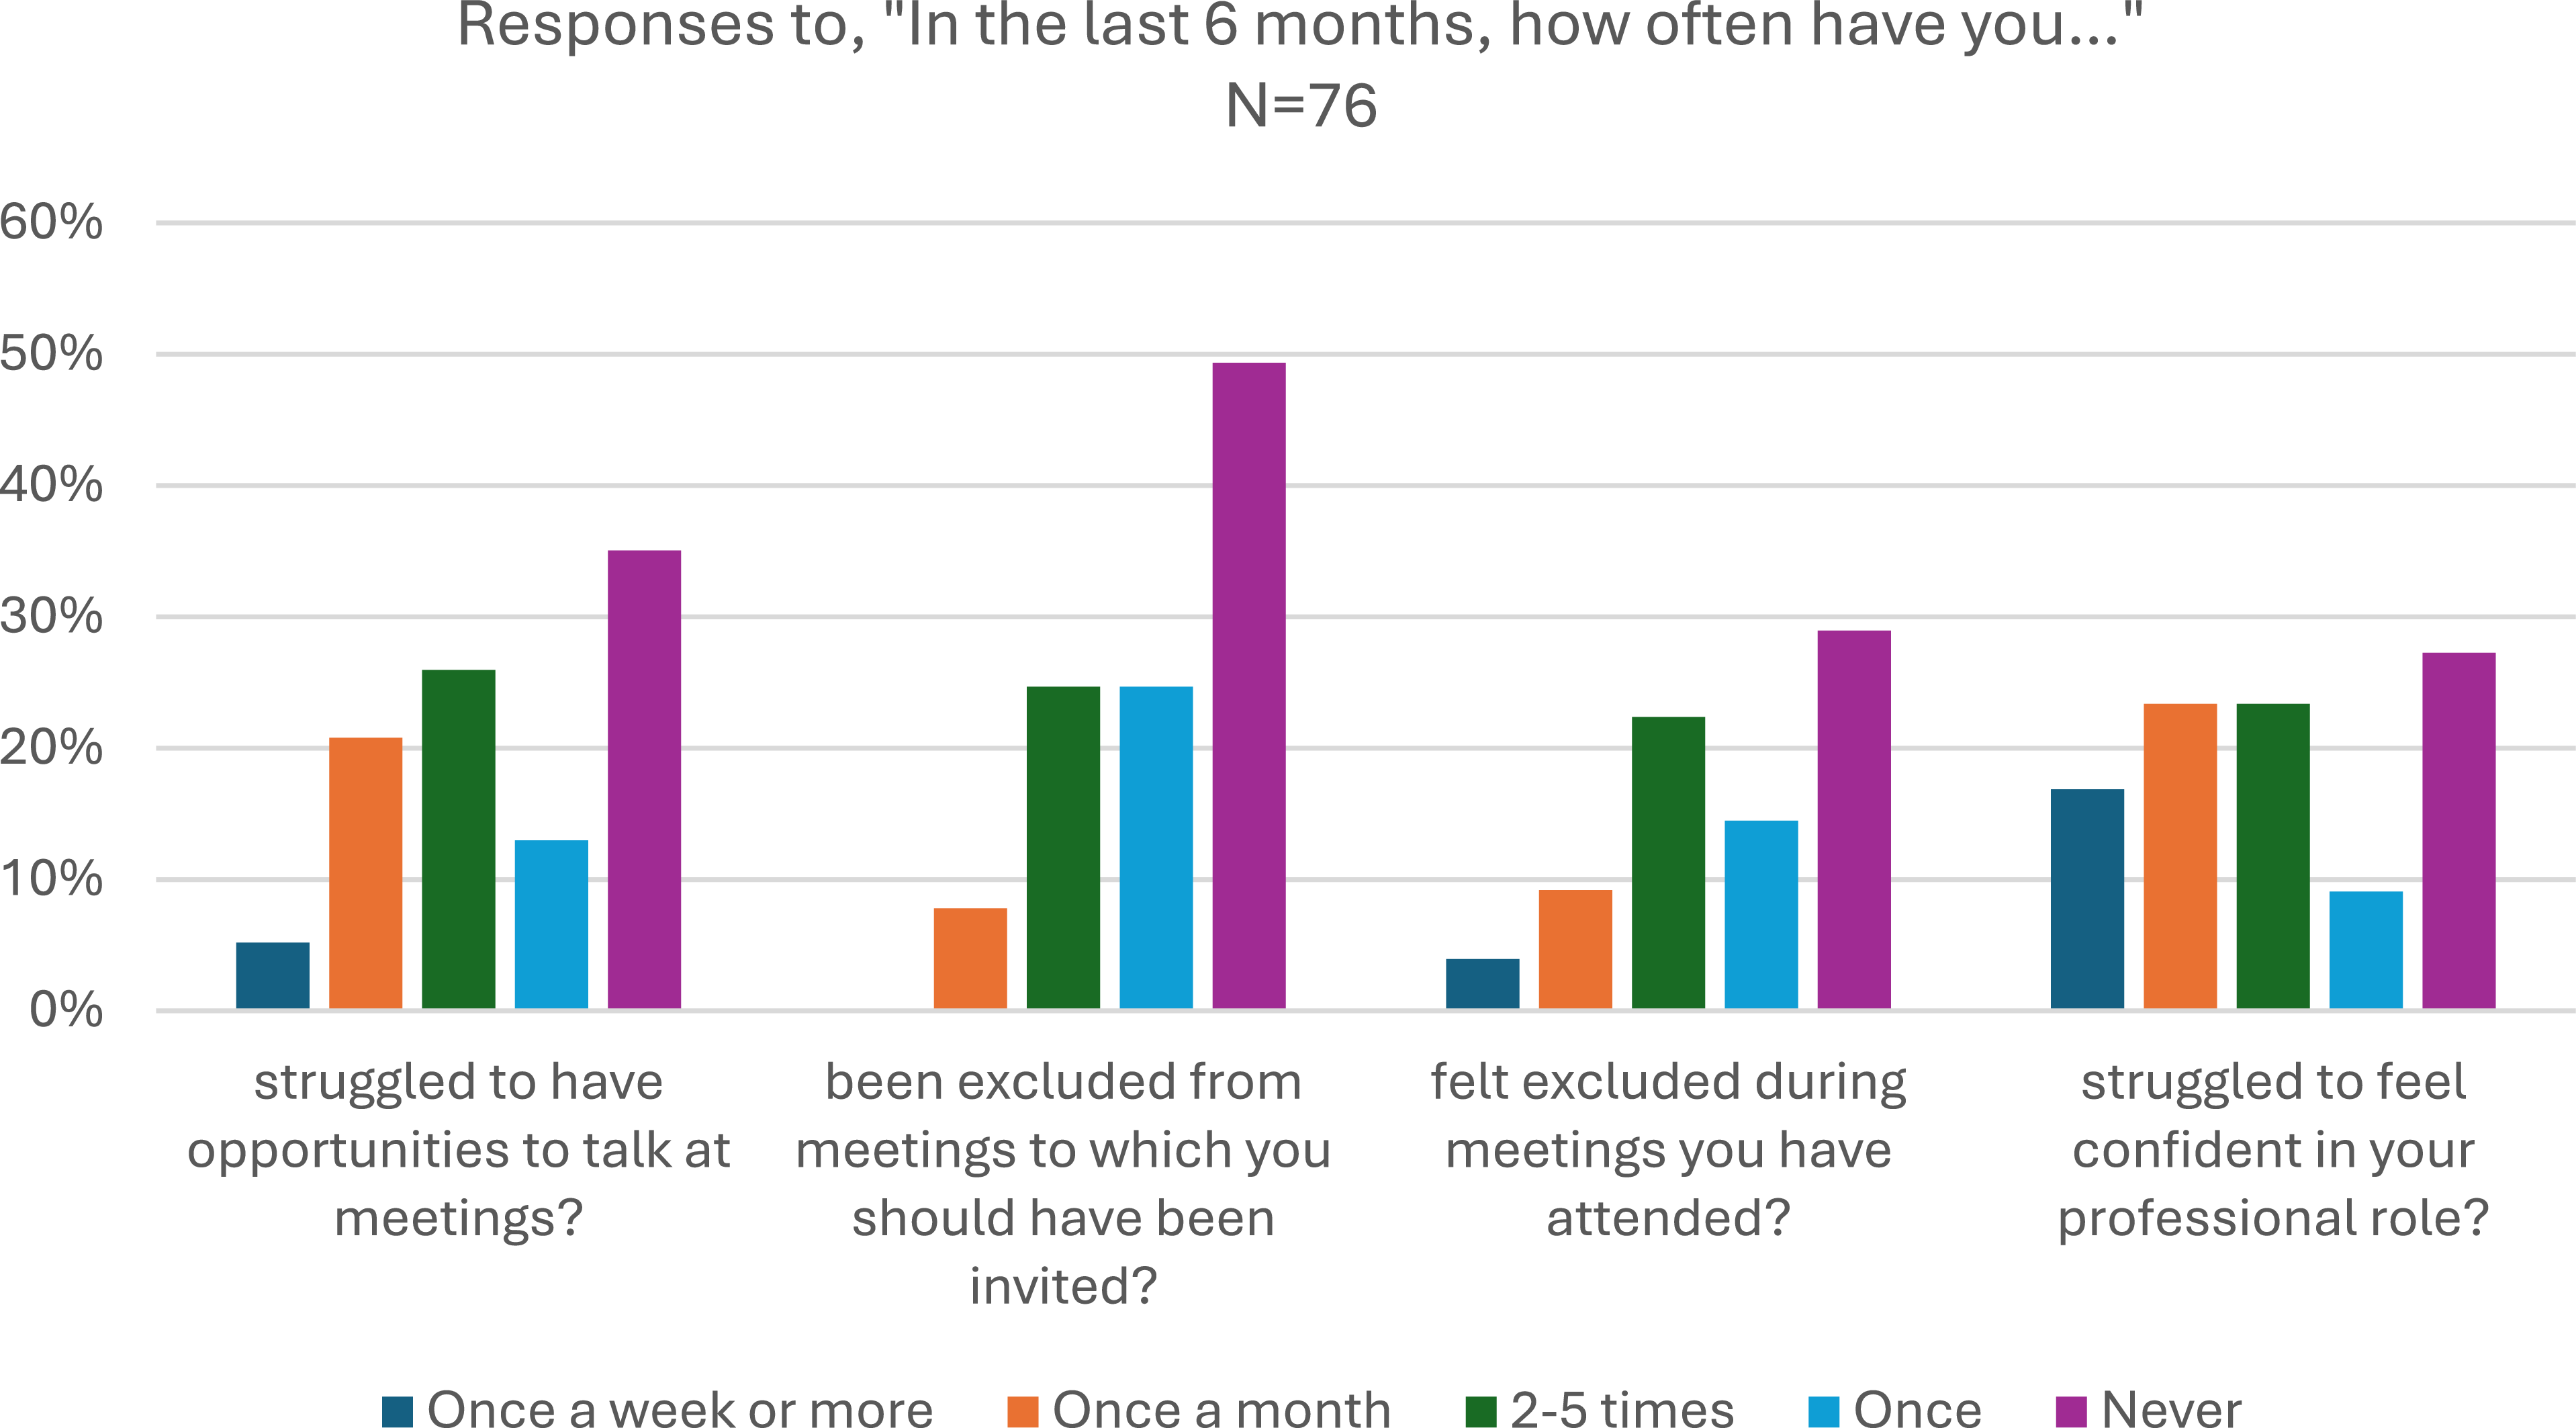
In the pre-workshop survey, participants were asked about various professional challenges experienced in the prior six months. The frequency of these challenges provides a general assessment of participants’ training needs. Figure 1 shows aggregated responses for participants in both iterations of the workshop, providing a snapshot of the challenges experienced by staff biostatisticians working at academic medical centers across the CTSA Consortium.
Tests for significant differences between the needs of the two cohorts showed generally similar patterns. However, QSN Cohort reported greater difficulty finding opportunities to speak during meetings compared to the ABS Cohort (2.79 ± 1.3 vs. 2.15 ± 1.2, p-value = 0.031). While needs were largely similar between the two cohorts, exploratory comparisons by language background revealed that ESL participants reported slightly fewer experiences of exclusion and confidence struggles. These trends provide additional context for understanding workforce variation as discussed later.
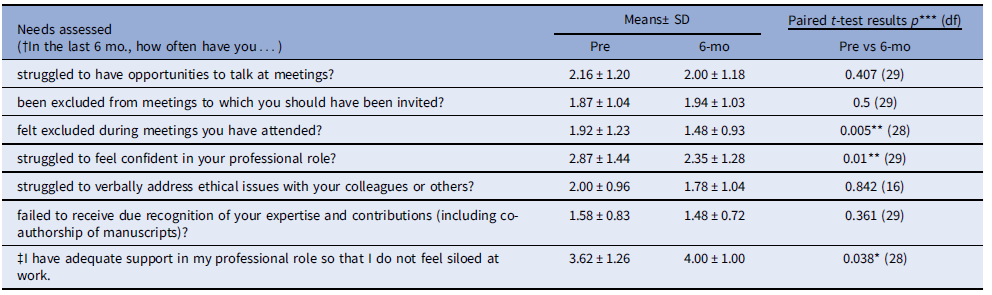
As shown in the paired t-tests presented in Table 3, the ABS Cohort at the initial 2023 workshop reported fewer incidents of disrespect or exclusion during meetings and fewer struggles with confidence in their professional roles over the six-month period following the program, compared to before the program. This table shows the significant differences in respondents’ survey responses collected at the start of the training and again 6 months after the training to demonstrate that the impact of the training had lasting effects on participants’ subsequent experience. Additionally, more participants agreed they had adequate support in their professional roles such that they did not feel siloed at work. These three indicators were the only ones that achieved statistical significance in assessing participants’ need for training.
ABS Cohort participants’ needs assessment responses (n = 30)

Table 3. Long description
A table with 8 rows and 4 columns comparing participants’ needs assessment responses before and after a training program. The columns are labeled ‘Needs assessed’, ‘Means± SD’, ‘Pre’, ‘6-mo’, and ‘Paired t-test results p*** (df)’. The rows list different needs assessed, such as ‘struggled to have opportunities to talk at meetings?’ and ‘felt excluded during meetings you have attended?’. Each row provides the mean and standard deviation for pre and 6-month post-training responses, along with the paired t-test results and p-values. Notable trends include significant improvements in feelings of exclusion during meetings and confidence in professional roles, with p-values of 0.005 and 0.01, respectively. Additionally, more participants agreed they had adequate support in their professional roles post-training, with a p-value of 0.038.
† Measured using a frequency scale (1 = Never, 2 = Once, 3 = 2-5 times, 4 = Once a month, 5 = Once a week or more).
‡ Measured using a 5-pt. Likert agreement scale (1 = Strongly disagree, 3 = Neither disagree nor agree, 5 = Strongly agree).
Participant confidence and training experience
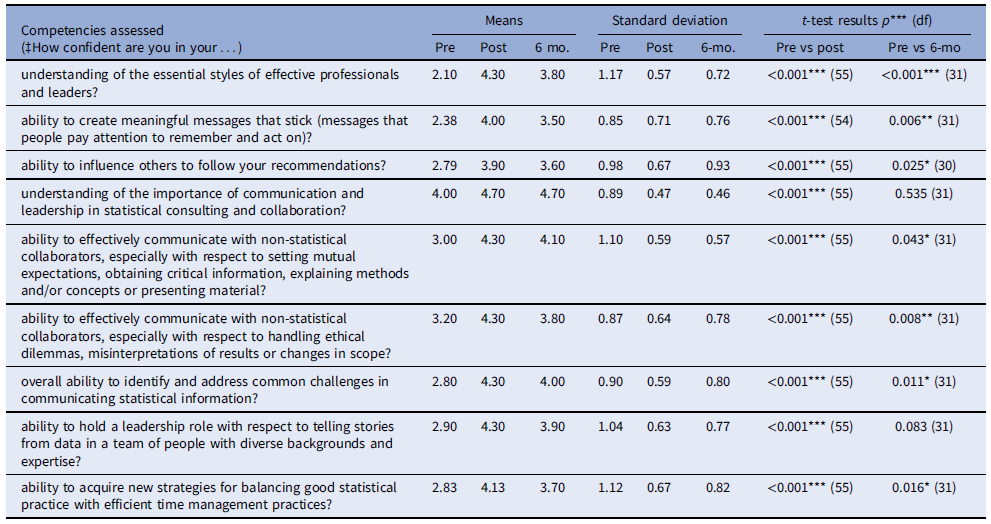
As shown in Table 4, participants reported significantly higher confidence in all eight skill areas post-workshop for both iterations. Participants were most confident in their ability to understand the importance of communication and leadership in statistical consulting and collaboration and least confident in their ability to influence others to follow their recommendations. The greatest gain in self-reported confidence in skill was associated with participants’ ability to understand the essential styles of effective professionals and leaders.
Participants’ change in self-confidence from both workshop cohorts †

Table 4. Long description
A table titled ‘Participants’ change in self-confidence from both workshop cohorts’ with eight rows and seven columns. The columns are labeled ‘Competencies assessed’, ‘Means’, ‘Standard deviation’, and ‘t-test results’. The ‘Means’ and ‘Standard deviation’ columns are further divided into ‘Pre’, ‘Post’, and ‘6 mo.’ sub-columns. The ‘t-test results’ column is divided into ‘Pre vs post’ and ‘Pre vs 6-mo.’ sub-columns. The table assesses eight different competencies, each with corresponding means, standard deviations, and t-test results. Each row lists a specific competency, followed by the mean values and standard deviations for pre-workshop, post-workshop, and six months post-workshop assessments. The t-test results show the statistical significance of the changes in self-confidence. Notable trends include significant increases in self-confidence post-workshop across all competencies, with varying levels of maintenance of confidence six months later.
† The 6-mo. Data were only collected from the ABS Cohort, and all 6-mo. metrics only reflect trends for this cohort.
‡ Measures used a self-confidence scale (0 = Not at all confident, 5 = Totally confident.).
However, as shown in Figure 2 comparing pre-, post-workshop, and six-month follow-up data for the ABS Cohort, modest declines in confidence were observed across all eight measures of self-confidence, with statistically significant drops in seven of them between the time the pre-program survey and the 6-month follow-up was administered, as is shown in Table 4. These findings suggest that although immediate gains were achieved, some effects attenuated over time. Taken together, these self-assessment results suggest that participation in the workshop can result in persistent gains in self-reported confidence in skill according to the participants, as is visualized in Figure 2.
No significant differences were found in pre-program self-assessment confidence level between the ABS Cohort and the QSN Cohort. However, the ABS Cohort reported significantly greater confidence in handling ethical dilemmas in the post-workshop survey compared to the QSN Cohort (4.20 ± 0.70 vs. 3.80 ± 0.68, p = 0.038). There were no significant differences between these two groups of participants in their satisfaction with the training, their intent to recommend the training to others, or learning outcomes. These results partially support the claim that the delivery format which differed across the two iterations of the workshop did not affect the positive impact of the workshop on the participants.
Importantly, participants’ satisfaction ratings with both iterations of the workshop experience were high: (ABS Cohort = 4.7 ± 0.68, n = 39; QSN Cohort = 4.5 ± 0.65, n = 21), as were their ratings to recommend the training to others (ABS Cohort = 4.8 ± 0.37, n = 37; QSN Cohort = 4.6 ± 0.80, n = 20), both of which were measured using a 5-point Likert scale. And when all participants were asked about their preference for workshop format (in-person vs virtual), using a Likert scale of 1–5, 5 being the strongest agreement, participants in both cohorts all either agreed or strongly agreed that they liked the format of their respective workshop.
In open-ended questions, participants also elaborated on their overall workshop experience. As one QSN Cohort participant stated, “I feel like I have a much better understanding of my own leadership style and how I communicate with others. I also learned a lot about how I can communicate better with collaborators and will be incorporating what we discussed into future projects.” This anecdotal evidence typifies the many open-ended responses from all participants about the impact of the workshop considered overall.
Workshop results
The overall results of the training are structured using Kirkpatrick’s framework, which conceptualizes the results of training as being manifested by the interacting contributions of participants’ training reactions, learnings, and behaviors. The results of the linear regressions analyses follow this structure, providing tests of the association between participants’ reactions, learnings, and their subsequent behavioral outcomes.
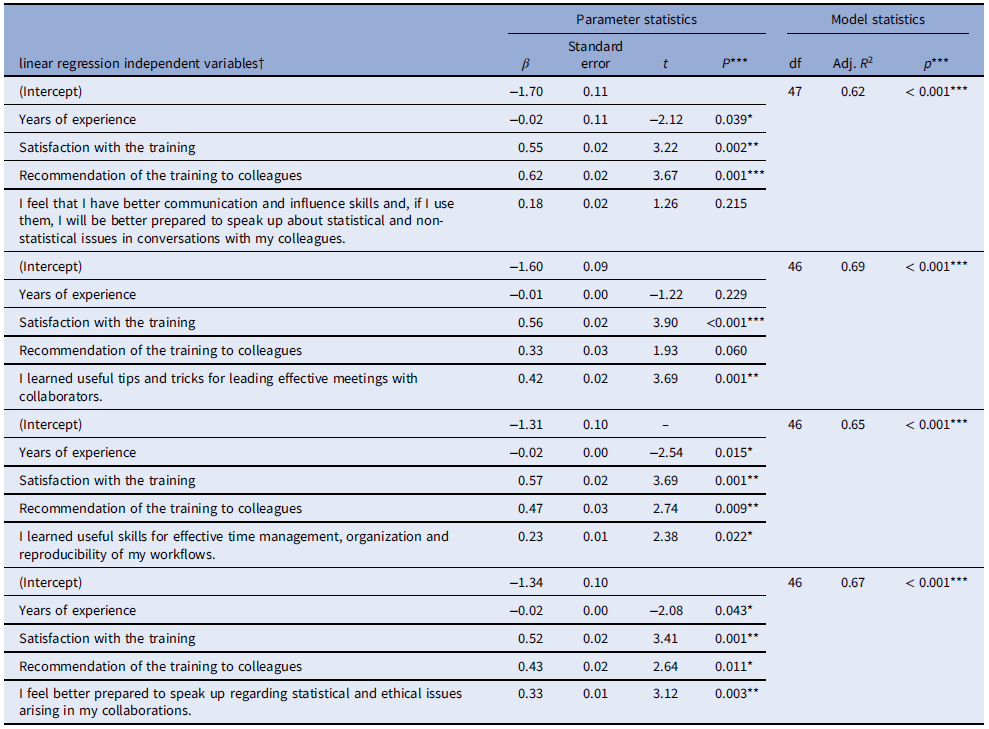
The overall significance of each model is assessed by the F-values, while the contribution of individual predictors is evaluated through their standard errors. As shown in Table 5, each model had significant F-values and adjusted R 2 ranging from 0.62 to 0.69, supporting the model’s general validity. Although it is possible to report on the magnitude and significance of specific predictors in these models, the purpose of the models was narrowly tailored to evaluate the validity of applying Kirkpatrick (2016) 4-Level impact framework to this training evaluation and to test the idea that the training would have an impact on the ABS and QSN organizations via the participant behaviors that were specifically targeted for improvement by the training [Reference Smidt, Balandin, Sigafoos and Reed36]. Specifically, the statistically significant regression results support the hypothesis that participants’ learning in and experience of the training is associated with their subsequent behaviors.
Linear regression models of the impact of the training on participants

Table 5. Long description
A table with linear regression models of the impact of the training on participants. The table has 4 rows and 10 columns. Column headers are linear regression independent variables, beta, standard error, t, P, df, Adj. R squared, and p. Row labels include (Intercept), Years of experience, Satisfaction with the training, Recommendation of the training to colleagues, and various statements about communication, meetings, time management, and speaking up. Each row provides values for beta, standard error, t, and P. Model statistics include df, Adj. R squared, and p values for each model. Notable trends include significant p values for satisfaction with the training and recommendation of the training to colleagues across different models.
† The dependent variable for the linear regression models was, Perceived preparedness to fulfill their statistical responsibilities, measured using a 5-point Likert agreement scale. Data used for these regression models included participants from both iterations of the training.
Notably, not all predictors were statistically significant across all models; in three of the four models, at least one predictor failed to significantly explain variation in the outcome or the programmatic impact of the workshop. Taken together with the other results presented here, the regression models provide further, through partial, support for the claim that participation in the workshop would improve perceived skills for all participants. We argue that these results suggest that this training provides a means by which leadership and communication skills can be enhanced throughout the ABS, QSN, and potentially beyond.
Differences between ESL and non-ESL biostatisticians
Finally, comparisons between ESL and non-ESL participants identified a few statistically significant differences in training needs and learning outcomes. While these trends were not the primary focus of the evaluation, they may reflect meaningful differences in the training needs and experience of key subgroups of the biostatistical workforce. Participating ESL biostatisticians reported experiencing fewer incidents of disrespect, or lack of consideration, over a six-month period compared to biostatisticians who speak English as their first language. This trend applies not only to the results of the pre-program assessment but also to the assessment administered to participants in the U-M training six months after the workshop.
In the pre-program assessments administered across both iterations of the training ESL biostatisticians reported that over the prior 6 months they had been excluded from meetings to which they should have been invited less frequently than those who speak English as their first language (1.59 ± 0.93 vs 2.13 ± 1.04, p-value = 0.026). Similarly, ESL biostatisticians reported they struggled less frequently to feel confident in their professional role compared to those who speak English as their first language (2.41 ± 1.34 vs 3.31 ± 1.40, p-value = 0.007).
The results of the assessment administered 6 months after the U-M training revealed a similar trend. ESL biostatisticians reported that over the prior 6 months they had struggled to have opportunities to talk at meetings less frequently than did those who speak English as their first language (1.50 ± 0.85 vs 2.30 ± 1.26, p-value = 0.050). Similarly, ESL biostatisticians reported that they felt excluded during meetings that they have attended less frequently than did those who speak English as their first language (1.10 ± 0.32 vs 1.70 ± 1.08, p-value = 0.030). In addition, ESL biostatisticians reported that they had struggled to feel confident in their professional role less frequently than did those who speak English as their first language (1.50 ± 0.85 vs 2.80 ± 1.28, p-value = 0.002).
Significant differences in two measures of confidence were found between the pre-program skill self-assessments of ESL and non-ESL biostatisticians. Biostatisticians who spoke English as a second language were more confident in their ability to understand the essential styles of effective professionals and leaders (2.85 ± 1.13 vs 1.94 ± 0.99, p-value <0.001). Likewise, ESL biostatisticians were more confident in their ability to hold a leadership role with respect to their overall ability to identify and address common challenges in communicating statistical information (3.00 ± 1.21 vs 2.45 ± 0.97, p-value = 0.048).
No significant differences were found between ESL and non-ESL biostatisticians’ post-program self-assessments overall. However, there was one significant difference between ESL and non-ESL biostatisticians collected through the 6-month follow-up survey, which collected data only from participants at the original U-M training. Biostatisticians who spoke English as a second language were more confident in their ability to acquire new strategies for balancing good statistical practice with efficient time management practices (4.00 ± 0.47 vs 3.33 ± 0.80, p-value = 0.007).
Significant differences were found between the training outcome measures of ESL and non-ESL biostatisticians, including learning and programmatic outcomes for the training considered overall. Biostatisticians who spoke English as a second language were more likely to report that the self-assessment administered before the program helped them to identify their leadership style and understand their current skills, strengths, and developmental opportunities (4.72 ± 0.46 vs 4.27 ±0.80, p-value = 0.007). In addition, ESL biostatisticians reported greater agreement that the training helped them feel better prepared to speak up regarding statistical and ethical issues arising in their collaborations (4.62 ± 0.59 vs 4.14 ± 0.93, p-value = 0.024).
Discussion
The effectiveness of the Leadership and Communication workshop is best demonstrated by the increasing self-efficacy of the participants, which showed a similarly positive trend across all confidence measures for both iterations of the workshop. The findings of this study suggest that the training was demonstrably beneficial for almost all biostatisticians who participated, even after the training was modified for broader dissemination across the CTSA Consortium. Although the analyses of differences between ESL and non-ESL biostatisticians suggested some differences in the perceived need for and impact of the training between these two groups, these results should be interpreted with caution and should remain a priority for future research.
The clear limitations of this study should be kept in mind. Specifically, the participants in this study are not representative of the biostatistical workforce, nor were the participating biostatisticians representing all the academic medical centers of the CTSA Consortium. The results may only be generalizable to those biostatisticians with similar professional and personal backgrounds. In addition, the long-term impact of the training disseminated across the CTSA Consortium was not evaluated due to the increased response burden it would place upon the participants.
The limitations associated with the results of the linear regression models of this study merit particular emphasis. The purpose of these models was narrowly tailored as a test of the validity of Kirkpatrick’s 4-Level (2016) conceptual framework which was used to evaluate the overall impact, or results, of the training [Reference Smidt, Balandin, Sigafoos and Reed36]. The power and precision of the regression results are critically limited by the small sample size available for analysis. In addition, the use of two similar measures of participants’ reactions to the training (i.e., measures of their satisfaction & intent to recommend the training to their colleagues) creates the potential collinearity of predictors, further limiting the interpretability of these results. In summary, the results of these regression models are best interpreted as narrowly supporting the only validity of the impact framework used to evaluate this training.
Future research is needed to understand the durability of the positive impacts of this training over time, across the different training modalities, and in terms of the impact of the training on mitigating feelings of professional isolation among some biostatisticians. While the results of this study suggest that this training is effective, the limits of this research require that further research be conducted to more definitively evaluate its long-term impact on participants. In addition, more rigorous research is needed into the ceiling effects of such training programs on participant outcomes and how these effects differ across participating biostatisticians based on their perceived ability to fulfill the responsibilities of their job measured pre-training.
This study makes three key contributions to the advancement of Clinical and Translational Science. First, this work contributes to the literature by demonstrating how biostatisticians’ need for professional development can be mitigated, specifically including through the dissemination of training designed to increase their leadership and communication skills [Reference Zelen1–Reference Pomann, Truong and Boulos7]. Our findings suggest the need for such training is likely to be present across academic medical centers, including those of the CTSA Consortium [Reference Oster, Devick and Thurston8–Reference Slade, Brearley and Coles10]. Further study can confirm the hypothesis that all participating biostatisticians can increase their confidence in their leadership and communication skills by completing a workshop like the one evaluated here.
Second, this study provides evidence that both in-person and virtual workshop formats can effectively improve participants’ confidence in leadership and communication skills, supporting the scalability of this model across diverse institutional contexts. This expanded reach may help reduce the professional isolation often experienced by biostatisticians working within and across academic medical centers [Reference Vasilopoulos and Tumin11–Reference Mehta, Stedman, Rao and Podolsky12]. Next steps for the ongoing development of this training include efforts to develop more modular versions of the training program which can be more easily disseminated to academic medical centers throughout the CTSA Consortium. The use of pre-recorded videos available through online modules in combination with training guides and resources for instructors, including for managing break-out groups and role-playing activities, could support even greater dissemination of the training without compromising local adaptation.
Third, this study offers a feasible, structured approach for evaluating professional development programs for biostatisticians, using a conceptual framework and mixed-method data to assess both immediate and longer-term outcomes. This work contributes to the growing body of empirical research identifying best practices to evaluate the impact of biostatistical training and support programs [Reference Oster, Devick and Thurston8,Reference Pomann, Boulware and Cayetano9,Reference Khalatbari, Baladandayuthapani, Kaciroti, Samuels, Bugden and Spino13–Reference Peskoe, Slade and Rende17,Reference Enders, Golembiewski, Orellana, Silvano, Sloan and Balls-Berry21]. This study also contributes to the field of Clinical and Translational Science by demonstrating how a novel training program for biostatisticians can be effectively disseminated to academic medical centers located across the United States [Reference Huebner, Pierce, Dennhardt, Akaeze, Jess and Ma18,Reference Faupel-Badger, Vogel, Austin and Rutter19].
Conclusion
The results of this study suggest that training programs designed to strengthen the leadership and communication skills of this country’s biostatistical workforce can positively impact their experience of isolation within and across academic medical centers. These findings also underscore the importance of designing programs that are inclusive and effective for a range of professional and linguistic experiences [Reference Varma, Samuels and Piatt31–Reference Caproni34]. Further research is needed to investigate how to tailor or adapt professional development to meet the needs of the entire biostatistical workforce supporting clinical and translational research within U.S. academic medical centers.
Needs assessment from both workshop iterations (ABS Cohort n = 39 & QSN Cohort, n = 37).

Competency assessments for the ABS Cohort over 3 time points (n = 28).

Supplementary material
The supplementary material for this article can be found at https://doi.org/10.1017/cts.2026.10818.
Author contributions
Elias Samuels: Conceptualization, Formal analysis, Methodology, Writing – original draft; Ellen Champagne: Data curation, Formal analysis, Writing – original draft, Writing – review & editing; Jane Bugden: Data curation, Project administration, Resources, Writing – review & editing; Shokoufeh Khalatbari: Conceptualization, Formal analysis, Methodology, Supervision, Writing – review & editing.
Funding statement
This research was funded through support by the National Center for Advancing Clinical & Translational Science, UM1TR004404.
Competing interests
The authors have no conflict of interest with the content or dissemination of this research.


 Open access

