Eating disorders (EDs) are complex, serious conditions with high chronicity, impairment, and societal costs (Klump, Bulik, Kaye, Treasure, & Tyson, Reference Klump, Bulik, Kaye, Treasure and Tyson2009). The transdiagnostic model of EDs posits that maladaptive cognitions (e.g. overvaluation of weight/shape) lead to extreme weight control behaviors (e.g. binge eating, purging), which mutually reinforce each other, maintaining ED pathology (Fairburn, Cooper, & Shafran, Reference Fairburn, Cooper and Shafran2003). Based on this model, cognitive symptoms are at the core of EDs, and both cognitive and behavioral symptoms maintain the disorder. This theory has driven the development of empirically supported, cognitive–behavioral treatments for EDs (CBT-E; Fairburn, Reference Fairburn2008; Murphy, Straebler, Cooper, & Fairburn, Reference Murphy, Straebler, Cooper and Fairburn2010). However, CBT-E treatments are only effective for about 50% of individuals with anorexia nervosa and bulimia nervosa, and among these individuals who do reach remission, about one-third to one-half will experience relapse (Carter, Blackmore, Sutandar-Pinnock, & Woodside, Reference Carter, Blackmore, Sutandar-Pinnock and Woodside2004; Eckert, Halmi, Marchi, Grove, & Crosby, Reference Eckert, Halmi, Marchi, Grove and Crosby1995; Herzog et al., Reference Herzog, Sacks, Keller, Lavori, Von Ranson and Gray1993; Keel & Brown, Reference Keel and Brown2010). Thus, there is a critical need for an improved conceptualization of EDs to adapt existing treatments and develop new empirically supported treatments. To improve the field's conceptualization of EDs, researchers need to identify the most important (i.e. core) symptoms and pathways among ED cognitions and behaviors using comprehensive measurements.
Two measures of ED symptoms are the Eating Disorder Examination Questionnaire (EDE-Q; Fairburn and Beglin, Reference Fairburn and Beglin1994) and the Eating Pathology Symptoms Inventory (EPSI; Forbush et al., Reference Forbush, Wildes, Pollack, Dunbar, Luo, Patterson and Bright2013). These measures both have strong psychometric properties (Berg, Peterson, Frazier, & Crow, Reference Berg, Peterson, Frazier and Crow2012; Forbush et al., Reference Forbush, Wildes, Pollack, Dunbar, Luo, Patterson and Bright2013; Forbush, Wildes, & Hunt, Reference Forbush, Wildes and Hunt2014) and are widely used in the ED field. However, these measures differ in notable ways. While both the EDE-Q and EPSI assess cognitive and behavioral dimensions of EDs, these measures differ in that the EDE-Q focuses on cognitive ED symptoms (e.g. overvaluation of weight/shape), whereas the EPSI focuses on and more precisely measures behavioral ED symptoms (e.g. restriction, purging, and excessive exercise; Fairburn & Beglin, Reference Fairburn and Beglin1994; Forbush et al., Reference Forbush, Wildes, Pollack, Dunbar, Luo, Patterson and Bright2013). A model that includes a balance of cognitive and behavioral symptoms from both measures may allow for a more comprehensive and accurate identification of ED core symptoms and maintaining relationships.
One statistical technique that can be used to identify core symptoms and pathways among symptoms is network analysis (NA). NA allows for a large number of variables to be included in one model, so researchers can test more fine-grained and complex models of psychopathology as compared to traditional models (Borsboom & Cramer, Reference Borsboom and Cramer2013; Cramer, Waldorp, Van Der Maas, & Borsboom, Reference Cramer, Waldorp, Van Der Maas and Borsboom2010). In the context of psychopathology, NA conceptualizes a mental disorder as a network of symptoms that interact with one another to maintain the disorder. Therefore, NA allows researchers to identify unique relationships, or pathways, between symptoms, as well as the most central symptoms of a disorder. Central symptoms, determined by strength centrality (i.e. the sum of the absolute value of all of the edges connected to a symptom), are theorized to be important maintaining symptoms for psychopathology and have been shown to predict important clinical outcomes in EDs and other related disorders (Elliott, Jones, & Schmidt, Reference Elliott, Jones and Schmidt2019; McNally, Reference McNally2016; Olatunji, Levinson, & Calebs, Reference Olatunji, Levinson and Calebs2018; Rodebaugh et al., Reference Rodebaugh, Tonge, Piccirillo, Fried, Horenstein, Morrison and Blanco2018). Additionally, the structure of the network can provide important information about the density of interconnectedness and the complex nature of symptom connections. By identifying the most central symptoms and pathways maintaining EDs using comprehensive measurement, future intervention research can focus on these important symptoms, potentially increasing the effectiveness of treatment.
There is a burgeoning literature in the ED field using NA to conceptualize ED pathology. Generally, researchers only include symptoms (i.e. items) from one ED measure in a network. Most NA research in the ED field has been conducted with the EDE or EDE-Q and has found fear of weight gain and symptoms related to overvaluation of weight/shape to be most central (Christian et al., Reference Christian, Perko, Vanzhula, Tregarthen, Forbush and Levinson2019; Elliott et al., Reference Elliott, Jones and Schmidt2019; Forrest, Jones, Ortiz, & Smith, Reference Forrest, Jones, Ortiz and Smith2018; Levinson et al., Reference Levinson, Zerwas, Calebs, Forbush, Kordy, Watson and Runfola2017; Smith et al., Reference Smith, Crosby, Wonderlich, Forbush, Mason and Moessner2018; Vanzhula et al., Reference Vanzhula, Christian, Brosof, Jones, Levinson, Forbush and Tregarthenunder review). A limitation of using the EDE-Q in NA is the behaviorally focused symptoms are in an open-response format, which is not suitable for inclusion in NA. As such, these items have been excluded from many past NA that have used EDE-Q item level or scaled scores (e.g. Elliott et al., Reference Elliott, Jones and Schmidt2019; Vanzhula et al., Reference Vanzhula, Calebs, Fewell and Levinson2019), leading to a disproportionate balance of cognitive and behavioral symptoms in models of ED pathology.
Indeed, within the ED network literature, several different symptoms have been found to be central. For example, NA investigations utilizing the EPSI have identified body checking (Forbush, Siew, & Vitevitch, Reference Forbush, Siew and Vitevitch2016), overeating (Christian et al., Reference Christian, Perko, Vanzhula, Tregarthen, Forbush and Levinson2019; Perko, Forbush, Siew, & Tregarthen, Reference Perko, Forbush, Siew and Tregarthen2019; Vanzhula et al., Reference Vanzhula, Christian, Brosof, Jones, Levinson, Forbush and Tregarthenunder review), dietary restriction (e.g. food avoidance, fasting; Christian et al., Reference Christian, Perko, Vanzhula, Tregarthen, Forbush and Levinson2019; Vanzhula et al., Reference Vanzhula, Christian, Brosof, Jones, Levinson, Forbush and Tregarthenunder review), and body dissatisfaction (Vanzhula et al., Reference Vanzhula, Christian, Brosof, Jones, Levinson, Forbush and Tregarthenunder review) as the most central symptoms, whereas most research using the EDE-Q finds overvaluation of weight/shape to be central. One study by DuBois, Rodgers, Franko, Eddy, and Thomas (Reference DuBois, Rodgers, Franko, Eddy and Thomas2017) created networks first using the EPSI subscales, finding restraint and body dissatisfaction to be most central, then recreated networks adding an item assessing overvaluation of weight/shape from the EDE-Q, and found overvaluation of weight/shape to be central. Overall, networks with symptoms from the EDE-Q and EPSI yield different results, highlighting how item and measure selection can impact network results and interpretation. Thus, to accurately identify the central symptoms of EDs, researchers need to create and test comprehensive network models with the inclusion of both cognitive and behavioral symptoms. Including a combination of symptoms from both the EPSI and EDE-Q in one network model may lead to more accurate and generalizable results, aiding in the identification of intervention targets that address diverse aspects of EDs.
In addition to the creation of a comprehensive cognitive–behavioral network, NA allows researchers to test if there are differences in central symptoms and pathways across groups. In EDs, one of the strongest predictors of treatment outcomes is the duration of illness (DOI), such that those with longer DOI typically experience worse outcomes (Berkman, Lohr, & Bulik, Reference Berkman, Lohr and Bulik2007; Norring & Sohlberg, Reference Norring and Sohlberg1993; Zipfel, Löwe, Reas, Deter, & Herzog, Reference Zipfel, Löwe, Reas, Deter and Herzog2000). Therefore, it seems likely that a comprehensive cognitive–behavioral network model of ED symptoms might vary based on DOI, helping to pinpoint why CBT-E might perform worse in those with longer DOIs. Habit formation theory of EDs posits that when maladaptive eating behaviors (e.g. restriction) are repeatedly paired with a reward (e.g. anxiety relief), these behaviors begin to develop into habitual patterns of disordered eating behaviors over time, even after the reward is diminished (Walsh, Reference Walsh2013). This pattern of habit formation has been applied to a variety of ED presentations, including binge eating and purging symptoms (Pearson, Wonderlich, & Smith, Reference Pearson, Wonderlich and Smith2015). Thus, longer DOI may lead to more deeply ingrained symptoms, which are more resistant to treatment (Treasure, Cardi, Leppanen, & Turton, Reference Treasure, Cardi, Leppanen and Turton2015; Walsh, Reference Walsh2013) and may need specific treatment optimizations. Consistent with this theory, habitual behaviors may become more central in later stages of ED and connections between symptoms may be stronger. However, despite poorer treatment outcomes, high societal costs, and higher mortality rates in individuals with longer DOI compared to individuals with shorter DOI (Robinson, Reference Robinson2009, Reference Robinson2014), no research has examined differences in core symptoms and pathways across DOI, which would provide insight into what may be contributing to these poor outcomes.
Therefore, the current study had two primary aims: (a) to extend prior literature by testing a comprehensive cognitive–behavioral network model of ED psychopathology consisting of symptoms from the EDE-Q and EPSI, and (b) to test whether networks differ (in network structure, strength, and central symptoms) based on DOI. Consistent with transdiagnostic theory and past network investigations of ED symptoms (DuBois et al., Reference DuBois, Rodgers, Franko, Eddy and Thomas2017; Elliott et al., Reference Elliott, Jones and Schmidt2019; Forrest et al., Reference Forrest, Jones, Ortiz and Smith2018; Goldschmidt et al., Reference Goldschmidt, Crosby, Cao, Moessner, Forbush, Accurso and Le Grange2018; Levinson et al., Reference Levinson, Zerwas, Calebs, Forbush, Kordy, Watson and Runfola2017; Wang, Jones, Dreier, Elliott, & Grilo, Reference Wang, Jones, Dreier, Elliott and Grilo2018), we hypothesized that cognitive symptoms of EDs, specifically those related to fear of weight gain and overvaluation of weight/shape, would be most central. We also hypothesized that networks would vary based on the DOI, such that behavioral symptoms (rather than cognitive symptoms) would be more central in individuals with longer DOI, consistent with habit formation theory. Finally, we hypothesized that networks would be denser (i.e. symptoms will be more strongly interconnected) with longer DOI, as connections between symptoms may strengthen with ED progression over time (Pe et al., Reference Pe, Kircanski, Thompson, Bringmann, Tuerlinckx, Mestdagh and Kuppens2015; van Borkulo et al., Reference van Borkulo, Boschloo, Borsboom, Penninx, Waldorp and Schoevers2015). We did not make predictions as to how specific connections between symptoms in the networks may change across DOI given the complexity of symptom relationships in these models and that this research is a first step in establishing a comprehensive network of ED symptoms.
Methods
Participants
Participants (N = 6850) were users of a HIPAA-compliant smartphone application enabling individuals with an ED to log daily food intake and monitor disordered-eating behaviors (Tregarthen, Lock, & Darcy, Reference Tregarthen, Lock and Darcy2015). Participants were prompted to complete both the EDE-Q and the EPSI at baseline as a part of application usage. Data collected from this ED recovery smartphone application has also been used in past studies using NA to answer different research questions. Christian et al. (Reference Christian, Perko, Vanzhula, Tregarthen, Forbush and Levinson2019) used the data to examine the differences in symptom associations across developmental stages, Vanzhula et al. (Reference Vanzhula, Christian, Brosof, Jones, Levinson, Forbush and Tregarthenunder review) used the data as one of five samples to examine the generalizability of NA for EDs, and Perko et al. (Reference Perko, Forbush, Siew and Tregarthen2019) used the data to examine sex differences in EDs.
Measures
EDE-Q
The EDE-Q version 6.0 is a 28-item, self-report measure designed based on the transdiagnostic theory of EDs (Fairburn & Beglin, Reference Fairburn and Beglin1994), adapted from Eating Disorder Examination Interview (Cooper & Fairburn, Reference Cooper and Fairburn1987). The EDE-Q assesses ED symptom severity over the past 28 days using a seven-point Likert scale and the frequency of ED behaviors using an open-response format. This version of the EDE-Q has four scales: Eating Concern (i.e. interfering thoughts about food, eating, or calories), Shape Concern (i.e. interfering thoughts about shape), Weight Concern (i.e. interfering thoughts about weight), and Restraint (i.e. attempts to reduce food intake; e.g. skipping meals, following food rules). The EDE-Q has high test–retest reliability, internal consistency, and excellent criterion validity (Aardoom, Dingemans, Op't Landt, & Van Furth, Reference Aardoom, Dingemans, Op't Landt and Van Furth2012; Berg et al., Reference Berg, Peterson, Frazier and Crow2012; Luce & Crowther, Reference Luce and Crowther1999). Internal consistency for the EDE-Q subscales ranged from acceptable to excellent (αs = 0.73–86).
EPSI
The EPSI is a 45-item, multidimensional measure designed to assess eight unique facets of eating pathology: Body Dissatisfaction (i.e. satisfaction with body shape and individual body parts; e.g. hips, thighs), Binge Eating (i.e. tendency to overeat or eat mindlessly), Cognitive Restraint (i.e. attempting to restrict eating, whether successful or not), Excessive Exercise (i.e. exercising in a way that is intense or compulsive), Restricting (i.e. efforts to avoid or reduce eating), Purging (i.e. self-induced vomiting and use of laxatives/diuretics), Muscle Building [i.e. cognitions and behaviors (supplement use) related to increasing muscularity], and Negative Attitudes Toward Obesity (i.e. negative judgment of individuals who are overweight or obese). Negative Attitudes Toward Obesity and Muscle Building were not included in the mobile ED recovery app; thus, items from these scales were not included in the network. Respondents were asked to rate items based on how frequently they engaged in each given thought or behavior on a scale from 0 (never) to 4 (often). The EPSI has excellent convergent and discriminant validity, as well as excellent test–retest reliability (Forbush et al., Reference Forbush, Wildes, Pollack, Dunbar, Luo, Patterson and Bright2013). Internal consistency for the EPSI subscales ranged from acceptable to good (αs = 0.76–0.87).
Data analytic procedure
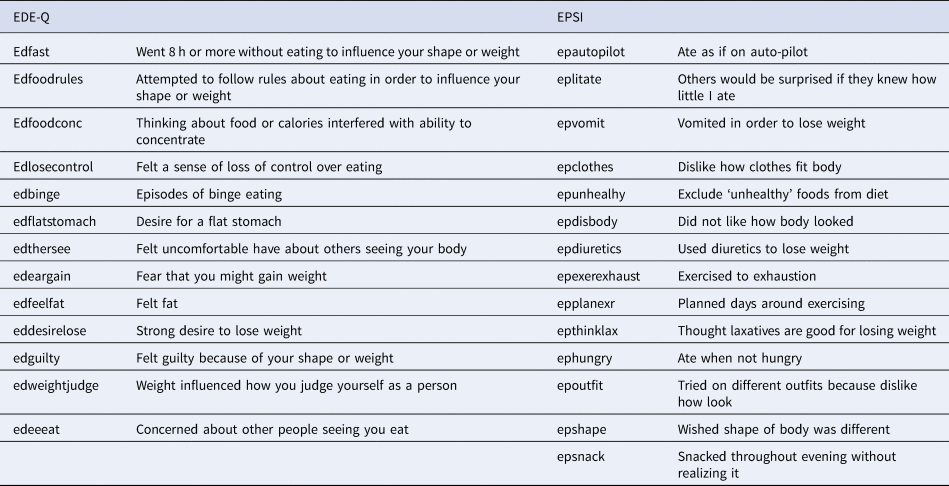
Items selected for inclusion in the networks were based on a two-step approach, using a theoretical [a team of trained ED clinicians selecting items with little topological (content) overlap; i.e. items that represent theoretically distinct symptoms] and an empirical (goldbricker in R package networktools; Jones, Reference Jones2017) method of item reduction. The goldbricker function identifies overlapping correlations to empirically test if two items capture distinct, non-overlapping symptoms. For the EPSI, seven items were removed via clinician consensus and 16 were removed via goldbricker function, leaving 16 items. For the EDE-Q, six items were removed via the theoretical approach and four items were removed via goldbricker, leaving 13 items. See Levinson et al. (Reference Levinson, Brosof, Vanzhula, Christian, Jones, Rodebaugh and Menatti2018) for a detailed description of item selection procedures. The reduced EDE-Q and EPSI items retained in the networks were shown to represent discrete and important ED symptoms, and the EDE-Q reduced item network exhibited improved replicability over the full scale (Vanzhula et al., Reference Vanzhula, Christian, Brosof, Jones, Levinson, Forbush and Tregarthenunder review). Two additional symptoms (EPSI overeating and EPSI fasting) were removed due to high inter-correlations between the EDE-Q and EPSI items of the same symptoms that led to artificially inflated centrality. We removed the duplicated EPSI items, as opposed to the EDE-Q, to have a similar number of symptoms included from each measure. Including more symptoms from one measure may artificially inflate centrality of those items, as items from the same measure are expected to be more strongly correlated. See Table 1 for an overview of the items included in the network.
List of items retained in networks

To test for differences in network structure, we characterized participants by DOI. The long DOI group (n = 1476) includes users of the ED recovery smartphone application who reported having an ED for 10 or more years. The medium DOI group (n = 1590) included users of the ED recovery smartphone application who reported having an ED for 3–10 years, and the short DOI group (n = 1053) included users of the ED recovery smartphone application who reported having an ED for <3 years. These cut-offs were selected as the literature supports these DOI represent distinct stages of EDs (Hay & Touyz, Reference Hay and Touyz2015; Strober, Freeman, & Morrell, Reference Strober, Freeman and Morrell1997).
Four Glasso networks (overall, long DOI, medium DOI, and short DOI) including EDE-Q (13) and EPSI (14) symptoms were estimated using the estimateNetwork function in the bootnet package in R (Epskamp, Maris, Waldorp, & Borsboom, Reference Epskamp, Maris, Waldorp, Borsboom, Irwing, Hughes and Booth2016). The Glasso function estimates partial correlations between nodes, meaning each correlation represents a unique relationship between items accounting for all other symptoms in the network, while minimizing small or spurious relationships. We estimated the networks using Spearman correlations. Stability estimates were calculated using the bootnet package in R (Epskamp et al., Reference Epskamp, Maris, Waldorp, Borsboom, Irwing, Hughes and Booth2016). We calculated strength centrality using the centralityplot function in the qgraph package in R (Epskamp, Cramer, Waldorp, Schmittmann, & Borsboom, Reference Epskamp, Cramer, Waldorp, Schmittmann and Borsboom2012).
Centrality difference tests were conducted using the bootnet package in R (Epskamp et al., Reference Epskamp, Maris, Waldorp, Borsboom, Irwing, Hughes and Booth2016) to determine if central symptoms were significantly more central than other symptoms. We used the three to five most central items identified in each network for interpretation of our results. The number of central symptoms included in each network is based on sharp, observable decreases in centrality differences among top symptoms that were used as cut-offs for inclusion. We did not use a standard cut-off value across networks due to inter-network variability.
Differences between networks across DOI were identified using the network comparison test using the NetworkComparisonTest package in R (van Borkulo et al., Reference van Borkulo, Boschloo, Borsboom, Penninx, Waldorp and Schoevers2015). Two metrics were utilized to analyze network differences: network invariance test (M; i.e. significant differences in the maximum edge strength in the networks), and global strength invariance test [GSI; i.e. significant differences in the sum of the edge strengths (van Borkulo et al., Reference van Borkulo, Boschloo, Borsboom, Penninx, Waldorp and Schoevers2015)].
Results
Demographics
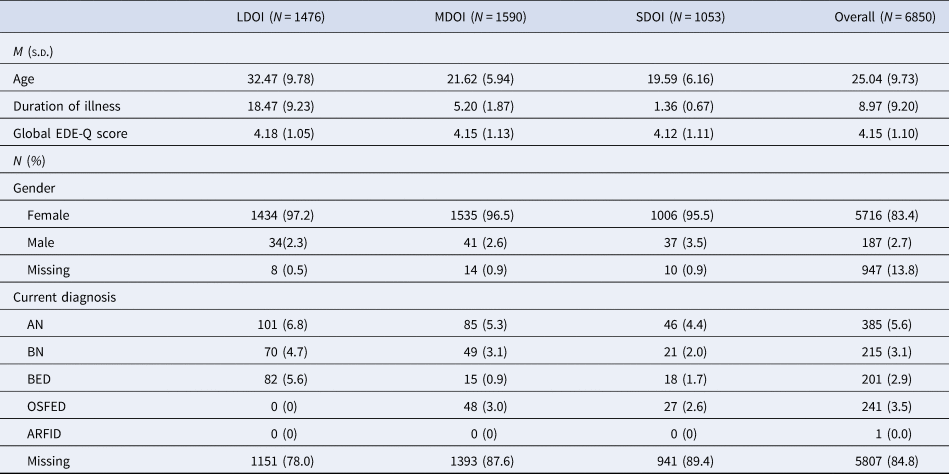
The average age of the overall sample was 25.04 years (s.d. = 9.73 years, range = 13–79). Most participants identified as female (n = 5716; 83.4%). The majority of participants (n = 5807; 84.8%) using the ED recovery smartphone application were not linked with a clinician in the application and therefore did not have a clinician-informed ED diagnosis. Of those individuals with a diagnosis, the most common ED was anorexia nervosa (n = 385; 36.9%), followed by other specified feeding and eating disorder (n = 242; 23.2%), bulimia nervosa (n = 215; 20.6%), and binge eating disorder (n = 201; 19.3%). Despite the lack of formal diagnoses, the mean global EDE-Q score was 4.08 (s.d. = 1.14; range = 0–6.0), and 60.1% and 91.5% of participants met the recommended criteria for an ED diagnosis using two commonly-used clinical cut-off scores (global EDE-Q score > 4.0 and > 2.3, respectively; Carter, Stewart, & Fairburn, Reference Carter, Stewart and Fairburn2001; Mond, Hay, Rodgers, Owen, & Beumont, Reference Mond, Hay, Rodgers, Owen and Beumont2004). On average, participants reported having an ED for 8.97 years (s.d. = 9.20; range = 0–60 years). The average DOI is 1.36 (s.d. = 0.67) for the short DOI group, 5.20 (s.d. = 1.87) for the medium DOI group, and 18.47 (s.d. = 9.23) for the long DOI group. Severity of global ED symptoms was not significantly different across DOI, F (2, 4114) = 0.76, p = 0.467. See Table 2 for additional demographic information.
Demographic information across subpopulations

LDOI, long duration of illness; MDOI, medium duration of illness; SDOI, short duration of illness; EDE-Q, Eating Disorder Examination Questionnaire; AN, anorexia nervosa; BN, bulimia nervosa; BED, binge eating disorder; ARFID, avoidant/restrictive food intake disorder; OSFED, other specified feeding or eating disorder; ED, eating disorder.
Networks and stability
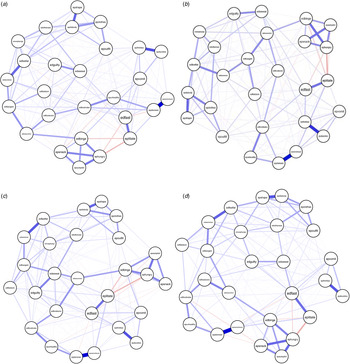
Strength centrality and edge stability coefficients were excellent for all networks [Strength (S) = 0.75, Edge = 0.75]. Networks are shown in Fig. 1.
Network graphs for the (a) overall, (b) long duration of illness, (c) medium duration of illness, and (d) short duration of illness samples. Blue lines represent positive partial correlations between symptoms, red lines represent negative partial correlations, and the thickness of the line represents the strength of the partial correlation. See Table 1 for the item corresponding to each node abbreviation.

Central symptoms
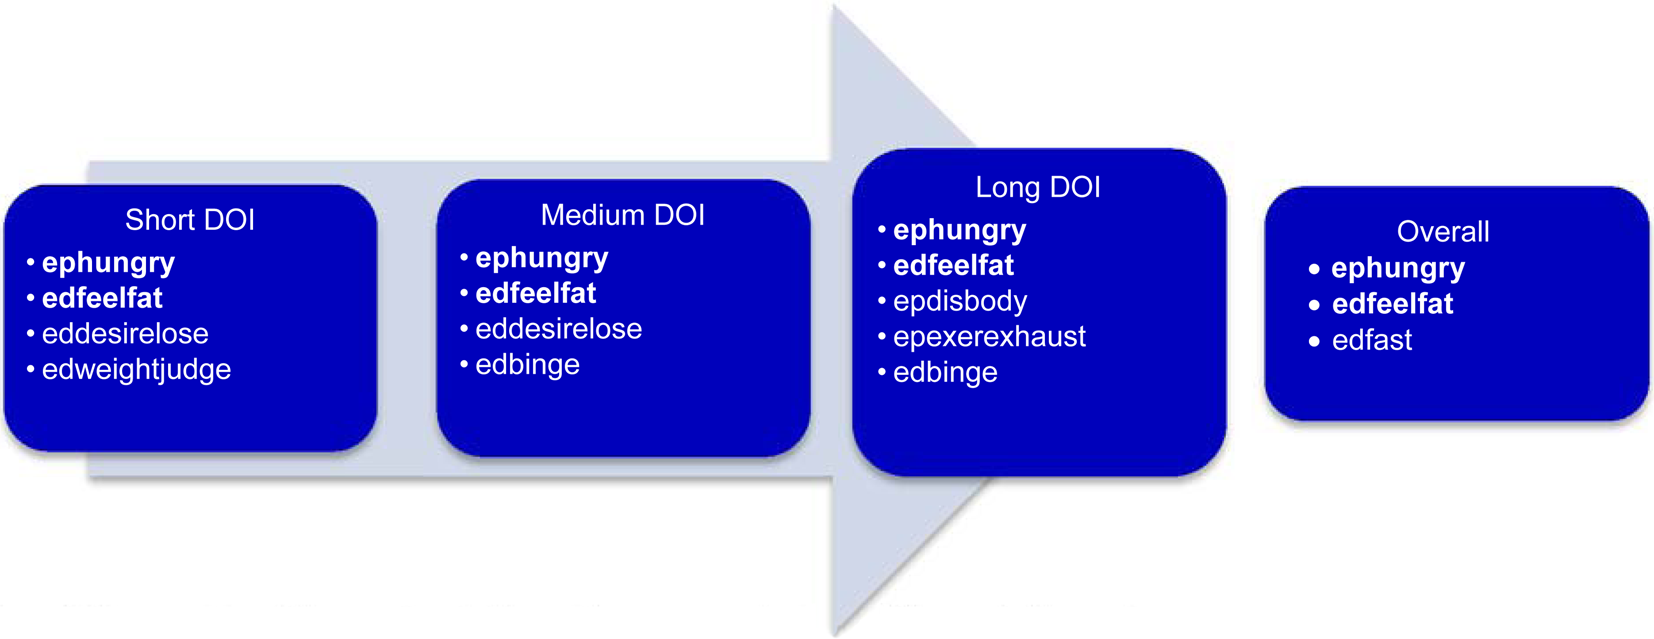
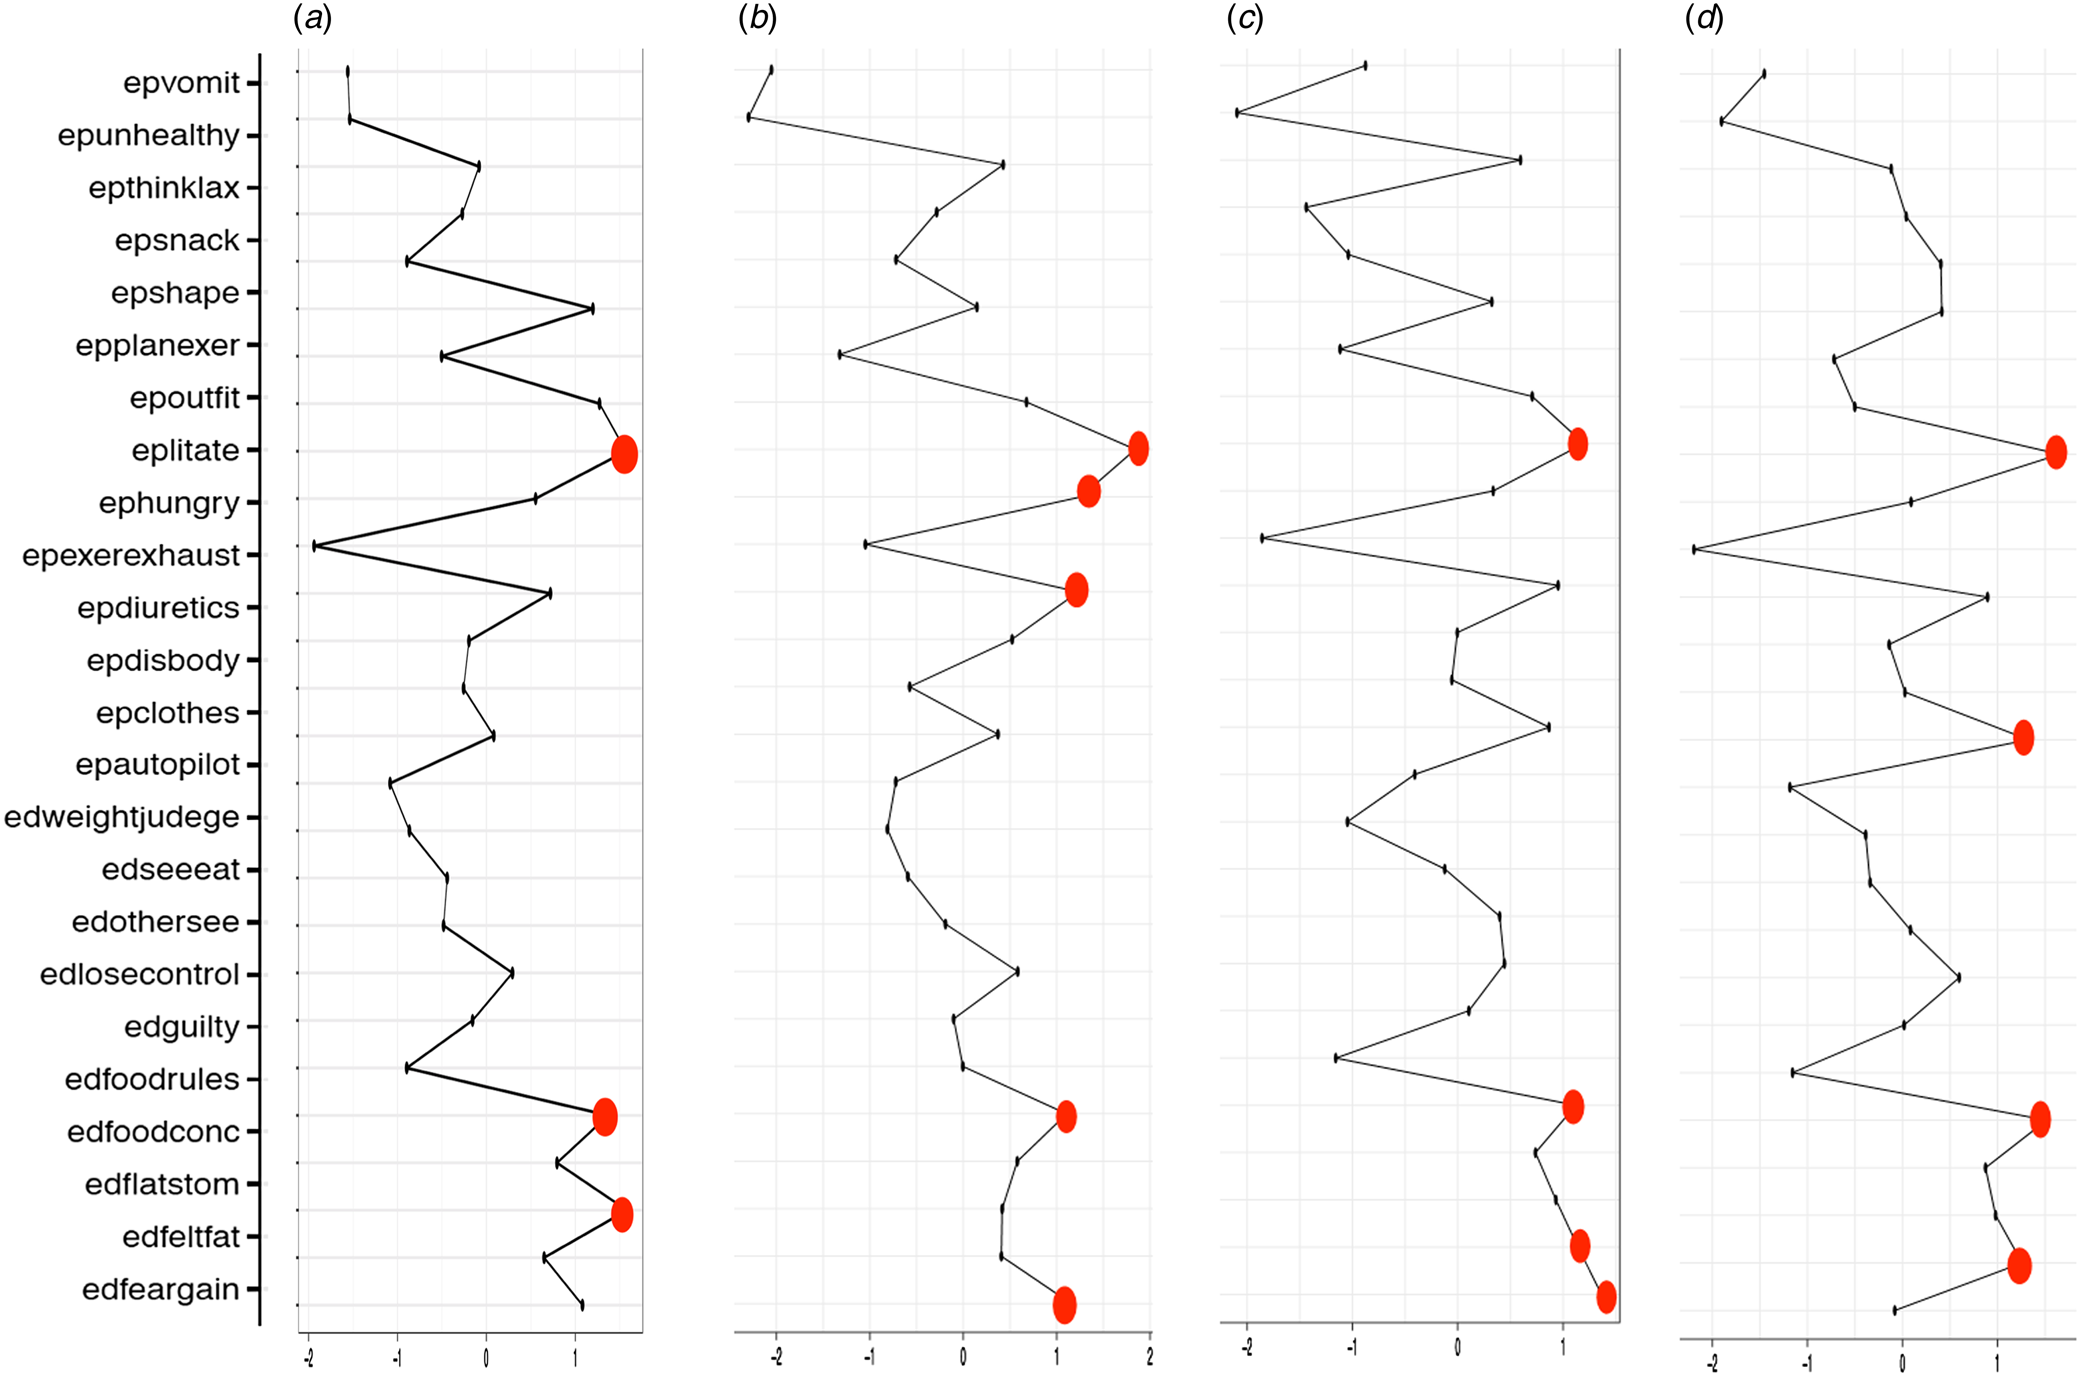
See Fig. 2 for a summary of the most central symptoms and Fig. 3 for strength centrality estimates for all network items. In the overall dataset, fasting (EDE-Q; S = 1.58), eating when not hungry (EPSI; S = 1.57), and feeling fat (EDE-Q; S = 1.37) emerged as most central. These symptoms were significantly more central than over 70% of other symptoms in the network.
Progression of the most central symptoms across the duration of illness. Bold symptoms denote symptoms that did not change across the duration of illness. DOI = duration of illness. Long DOI = ED >10 years; Medium DOI = ED 3–10 years; Short DOI = ED <3 years; ephungry = eating when not hungry; edfeelfat = feeling fat; edfast = fasting; epdisbody = body dissatisfaction; eperexhaust = exercising to exhaustion; edbinge = binge eating; eddesirelose = desire to lose weight; edweightjudge = judgment of self based on weight.

Centrality of all symptoms for the (a) overall, (b) long duration of illness, (c) medium duration of illness, and (d) short duration of illness networks. Red dots denote the most central symptoms. All central symptoms were significantly more central than 50% or more other symptoms in the network. See Table 1 for the item corresponding to each node abbreviation.

In the long DOI sample (ED for 10 or more years), eating when not hungry (EPSI; S = 1.84), body dissatisfaction (EPSI; S = 1.23), exercising to exhaustion (EPSI; S = 1.26), binge eating (EDE-Q; S = 1.16), and feeling fat (EDE-Q; S = 1.11) emerged as most central. These symptoms were significantly more central than 50% or more of the other symptoms in the network.
In the medium DOI sample (ED for 3–10 years), binge eating (EDE-Q; S = 1.37), eating when not hungry (EPSI; S = 1.20), feeling fat (EDE-Q; S = 1.12), and desire to lose weight (EDE-Q; S = 1.14) emerged as most central. These symptoms were significantly more central than over 50% of other symptoms in the network.
In the short DOI sample (ED for <3 years), eating when not hungry (EPSI; S = 1.65), feeling fat (EDE-Q; S = 1.52), judgment of self, based on one's weight (EDE-Q; S = 1.33), and desire to lose weight (EDE-Q; S = 1.26) emerged as most central. These symptoms were significantly more central than over 60% of other symptoms in the network.
Network comparison test across DOI
The results of the Network Invariance test indicated that there were no significant differences in network invariance or global strength invariance across the short, medium, and long DOI networks, p > 0.05.
Discussion
The current study examined a comprehensive cognitive–behavioral network model of ED pathology, including items from two widely used measures, the EDE-Q and EPSI. We identified the most important (central) ED symptoms across four different networks (overall, long DOI, medium DOI, and short DOI) and compared the structure and density of symptoms across these networks. Overall, we found that eating when not hungry and feeling fat were among the most central symptoms across all networks. As hypothesized, cognitions related to overvaluation of weight/shape (e.g. feeling fat, body dissatisfaction, and desire to lose weight) were also highly central across networks. Contrary to our hypotheses, there were no significant differences in network structure or global strength across DOI, meaning the strength of the connections between symptoms remained relatively consistent across DOI groups. However, there were variations in central symptoms, such that cognitive symptoms related to overvaluation of weight/shape were central in individuals with shorter DOI, with a progression toward behavioral central symptoms in the medium and long DOI groups.
Central symptoms
Feeling fat was a central symptom across all networks, which is consistent with past NA investigations (Elliott et al., Reference Elliott, Jones and Schmidt2019; Goldschmidt et al., Reference Goldschmidt, Crosby, Cao, Moessner, Forbush, Accurso and Le Grange2018). Indeed, research supports that emotions contributing to feeling fat (e.g. anxiety, negative affect; Major, Reference Major2016; Simlett, Reference Simlett2004) may be maintaining symptoms of EDs (Pallister & Waller, Reference Pallister and Waller2008; Stice & Shaw, Reference Stice and Shaw2002). However, research also supports that feeling fat is a distinct factor in EDs that is related to eating concerns and restraint even when controlling for depression or overvaluation of weight/shape (Linardon et al., Reference Linardon, Phillipou, Castle, Newton, Harrison, Cistullo and Brennan2018). Thus, research is needed to better understand the unique role of feeling fat in the maintenance of EDs.
Although most studies have identified ED behaviors toward the periphery of the network (Goldschmidt et al., Reference Goldschmidt, Crosby, Cao, Moessner, Forbush, Accurso and Le Grange2018; Levinson et al., Reference Levinson, Zerwas, Calebs, Forbush, Kordy, Watson and Runfola2017; Wang et al., Reference Wang, Jones, Dreier, Elliott and Grilo2018), this study identified eating when not hungry as another central symptom across networks. One past network investigation using the EPSI also found this symptom to be among the most central symptoms (Forbush et al., Reference Forbush, Siew and Vitevitch2016). Eating when not hungry has only been included as a node in a few network models, but our results suggest it may represent an important symptom for inclusion in future investigations. Additionally, research should continue to test whether disordered eating behaviors, such as eating when not hungry, are the most important targets for intervention.
Two symptoms, eating when not hungry and feeling fat were shared across the long, medium, and short DOI networks, suggesting these symptoms may be important targets across DOI. However, more behavioral symptoms emerged as central in the long DOI network (e.g. binge eating, exercising to exhaustion) when compared to the short DOI network, which had more cognitive central symptoms (e.g. judgment on weight, desire to lose weight), supporting our hypothesis. The medium DOI network was a balance of cognitive–behavioral symptoms, with two cognitive and two behavioral central symptoms. This finding may support Walsh's (Reference Walsh2013) habit formation theory and demonstrate the temporal progression of EDs, such that the cognitions and emotions are more central in early stages of EDs, but with longer DOI, behaviors may evolve into deeply ingrained habits, thus becoming more central to pathology. Pending replication in prospective models, these results may have implications for understanding the nature of ED progression and treating individuals across stages of ED development.
Network comparison test
Contrary to our hypotheses and habit formation theory of EDs (Walsh, Reference Walsh2013), there were no significant differences in network structure or global strength across the long, medium, and short DOI networks, suggesting the strength of symptom relationships are relatively consistent across DOI. This result was surprising; however, it may suggest that individuals with highly variable DOI may have similar symptom pathways. Thus, the poor treatment outcomes, high societal costs, and high mortality rates associated with longer DOI (Robinson, Reference Robinson2009, Reference Robinson2014) may be attributed to features of the disorder not related to symptom interconnectedness. For example, differences in central symptoms may represent key variations accounting for differences in the maintenance and treatment of EDs across DOI, rather than tighter connections among symptoms. Future research should investigate if interventions optimized to focus on the unique central symptoms identified for individuals with longer DOI lead to better treatment outcomes for this population.
Limitations
Several limitations of this study should be noted. First, the data were self-reported and are limited by attention, self-report biases, and willingness to report maladaptive behaviors. Two subscales of the EPSI, Muscle Building and Negative Attitudes toward Obesity, were not measured in the mobile ED recovery application, so it is unknown how these symptoms may serve to maintain ED pathology or how they differ across DOI. Additionally, ethnicity, race, and socioeconomic status were not collected in the ED recovery application, so the diversity of our sample is unknown. Many individuals in the sample were also not linked with a clinician, and did not have a diagnosis recorded in the application. Further, despite significantly different mean age across DOI subpopulations, we did not have adequate power to control for age. Future research should replicate these findings in diverse ethnic samples, ED diagnostic subpopulations, and age-matched groups. Additionally, we used a cross-sectional sample and no causal or directional interpretations can be gleaned from our study.
We would also like to add a few notes of caution regarding our interpretation of the NA. First, we focus much of our interpretation on central symptoms, as these symptoms are theorized to be important maintaining symptoms and predict important clinical outcomes (Elliott et al., Reference Elliott, Jones and Schmidt2019; McNally, Reference McNally2016; Olatunji et al., Reference Olatunji, Levinson and Calebs2018; Rodebaugh et al., Reference Rodebaugh, Tonge, Piccirillo, Fried, Horenstein, Morrison and Blanco2018). However, there is some debate as to whether centrality indices used to determine central symptoms are a clinically meaningful test statistic (Bringmann & Eronen, Reference Bringmann and Eronen2018; Hallquist, Wright, & Molenaar, Reference Hallquist, Wright and Molenaar2019). For example, the application of betweenness and closeness centrality to psychological networks has been criticized as measures of node importance (see Bringmann et al., Reference Bringmann, Elmer, Epskamp, Krause, Schoch, Wichers and Snippe2019). As such, we chose not to include these indices in the current study. Analyses were conducted on the group-level and reflect trends across our samples. Thus, these findings might not be reflective of the most important central symptoms, pathways, or treatment targets for an individual, especially given the heterogeneous nature of our sample. Finally, our interpretation of results is based on our hypothesis that more habitual symptoms may be more interconnected; however, no research to date has established how symptom interconnectedness may be influenced by habit formation. It is possible that more habitual symptoms may be less interconnected with other symptoms because these symptoms are increasingly likely to occur, even in the absence of precipitating states. Further testing of this hypothesis is an important area for future research.
Implications and future directions
This research represents an important first step for developing a comprehensive cognitive–behavioral network model of ED symptoms. Our findings have important implications for the conceptualization and treatment of EDs, as well as implications for future NA investigations. First, our investigation highlights the importance of item selection in NA. Future research should attempt to replicate our findings, as well as adapt or develop new measures for NA including the most comprehensive, important symptoms for a given condition. Having strong, empirically designed measures for NA will allow for greater replicability and more accurate identification of important treatment targets. Future research should investigate if targets identified using this comprehensive cognitive–behavioral network model are predictive of clinical outcomes.
Second, as central symptoms are hypothesized to be important targets for intervention (McNally, Reference McNally2016; Rodebaugh et al., Reference Rodebaugh, Tonge, Piccirillo, Fried, Horenstein, Morrison and Blanco2018), feeling fat and eating when not hungry may be especially important intervention targets for individuals with EDs regardless of the stage of illness. CBT interventions (e.g. exposure therapy, behavior chaining, thought challenging) may be optimized by focusing on these central symptoms. For example, interoceptive exposure therapy, a predominant treatment for panic disorder, might be adapted to EDs to target interoceptive sensations contributing to feelings of fatness (Boswell, Anderson, & Anderson, Reference Boswell, Anderson and Anderson2015). Additionally, mindfulness-based interventions that focus on intuitive eating strategies could be utilized to target eating when not hungry by helping individuals with EDs reduce emotional and non-homeostatic eating (Kristeller, Wolever, & Sheets, Reference Kristeller, Wolever and Sheets2014).
Further, central symptoms unique to the early or late stages of EDs may be helpful targets for designing or selecting interventions across DOI. For example, interventions for weight-based self-judgment may be more effective when implemented in early treatment, compared to in treatment with individuals with long DOI. To better understand the increased difficulty in treating individuals with chronic EDs, research should continue to investigate how central symptoms and symptom pathways may differ across DOI, as well as how potentially different central symptoms may be important targets for intervention in treatment.
Financial support
This research received no specific grant from any funding agency, commercial or not-for-profit sectors.
Conflict of interest
Ms Tregarthen is a co-founder and shareholder of Recovery Record, Inc. Ms Tregarthen made a substantial contribution as part of data collection and curation and approved the final manuscript, but she did not participate in the analysis, interpretation, or drafting the manuscript. Dr Forbush received an industry-sponsored grant from Recovery Record. No other authors have conflicts of interest to disclose.