





1. Introduction
At low inertia but high elasticity, polymer solutions develop a chaotic regime called elastic turbulence (Groisman & Steinberg Reference Groisman and Steinberg2000). As the name suggests, in this regime the velocity field is chaotic and fluctuates in space and time with power-law spectra. Unlike Newtonian turbulence, though, the instabilities that trigger the chaotic motions and the mechanisms that sustain them are solely elastic, and fluid inertia plays no role. Consequently, elastic turbulence offers an effective means of enhancing mixing under circumstances of weak or vanishing inertia, such as in micro-fluidics (Groisman & Steinberg Reference Groisman and Steinberg2001). The discovery of this phenomenon raised new questions, most of which remain unanswered, including the role of flow geometry and perturbations in triggering and sustaining turbulence, and the significance of wave-like fluctuations in the spatio-temporal dynamics (Datta et al. Reference Datta2022). Therefore, over the past two decades, elastic turbulence has been the subject of extensive experimental investigation (Steinberg Reference Steinberg2021, Reference Steinberg2022). Numerical simulations, however, have lagged behind, and to date only a few studies have considered realistic three-dimensional flows (Liu & Khomami Reference Liu and Khomami2013; van Buel & Stark Reference van Buel and Stark2022; Song et al. Reference Song, Liu, Lu and Khomami2022, Reference Song, Lin, Zhu, Wan, Liu, Lu and Khomami2023; Lellep, Linkmann & Morozov Reference Lellep, Linkmann and Morozov2024). Indeed, simulating elastic turbulence presents a distinct set of difficulties and in some ways is more challenging than simulating its Newtonian counterpart (Alves, Oliveira & Pinho Reference Alves, Oliveira and Pinho2021).
The common approach to the simulation of viscoelastic flows couples the Navier–Stokes equations (or, in the limit of vanishing inertia, the Stokes equations) with a constitutive equation governing the evolution of the polymeric stress. The best known models of viscoelastic flows are the Oldroyd-B model and the FENE-P model, where the acronym stands for ‘finitely extensible nonlinear elastic with the Peterlin approximation’. Both models express the polymeric stress in terms of the conformation tensor  $\boldsymbol{\mathsf{C}}(\boldsymbol {x},t)$, defined as the tensor product of the polymer's end-to-end separation vector
 $\boldsymbol {R}$ by itself, averaged over all polymers contained in a volume element located at position
 $\boldsymbol {x}$ at time
 $t$, i.e.
 ${\mathsf {C}}_{ij} \equiv \langle {R}_i {R}_j \rangle$. Clearly, the conformation tensor is defined to be positive-definite. In principle, the evolution equations preserve this property, though in practice, numerical errors can lead to its loss, which in turn produces unphysical stresses and numerical instabilities.
Simulations of elastic turbulence are particularly susceptible to numerical instabilities because the tensor field of  $\boldsymbol{\mathsf{C}}$ develops very large gradients as the polymers are stretched out by the chaotic flow (the trace
 $\operatorname {tr}\boldsymbol{\mathsf{C}}$ is the squared extension of polymers). A range of special numerical schemes has been developed, therefore, to resolve these steep variations of
 $\boldsymbol{\mathsf{C}}$ and to guarantee its positive-definiteness (Alves et al. Reference Alves, Oliveira and Pinho2021). As discussed below, these methods involve a combination of non-trivial transformations or decompositions of
 $\boldsymbol{\mathsf{C}}$, advanced advection schemes, and artificial diffusion. We thus have a variety of distinct methods that are capable of keeping
 $\boldsymbol{\mathsf{C}}$ positive-definite and producing stable numerical solutions. But do they capture the underlying physics? One would hope, given sufficient numerical resolution and converged results, to find agreement among these methods on key dynamical features of the flow. This is not the case. Rather, we show in this work that different methods yield predictions with qualitative differences in the large-scale dynamics, sufficiently significant not only to appear in averaged statistics (e.g. kinetic energy fluctuations) but also to change the rate of scalar mixing.
The distortion of large-scale flow structures by numerical errors is disquieting, especially in the context of elastic turbulence, whose chaotic dynamics is governed by coherent structures and their interactions. For example, in channel flow, it has been shown that an elastic centre-mode instability (Khalid, Shankar & Subramanian Reference Khalid, Shankar and Subramanian2021; Kerswell & Page Reference Kerswell and Page2024) can undergo a subcritical bifurcation (Buza et al. Reference Buza, Beneitez, Page and Kerswell2022; Morozov Reference Morozov2022) and give rise to a state of elastic turbulence that is dominated by coherent ‘arrowhead’ or ‘narwhal’ flow structures (Lellep et al. Reference Lellep, Linkmann and Morozov2024), which merge and split as they propagate along the channel. Faithful simulations of elastic turbulence, therefore, demand that the dynamics of large-scale flow structures be captured accurately.
But when different numerical methods predict qualitatively distinct large-scale dynamics, how is the correct one to be identified? This question is particularly difficult to answer in the context of elastic turbulence because it does not enjoy the same degree of universality as Newtonian turbulence – its statistical properties vary with the polymer concentration, the forcing, and the boundary conditions. In the absence of universal laws, any numerical solution that fluctuates chaotically without diverging appears plausible. Here, we settle this question using a mathematical result for the Oldroyd-B model which states that the determinant of the polymer conformation tensor must stay greater than unity (Hu & Lelièvre Reference Hu and Lelièvre2007). This lower bound, which has not received due attention in the literature, allows us to identify erroneous solutions decisively by monitoring the minimum value of the determinant of  $\boldsymbol{\mathsf{C}}$.
Before focusing on specific numerical procedures, it is helpful to survey the three classes of approaches that have been developed to stabilize simulations of the Oldroyd-B and FENE-P models.
The first approach involves artificial diffusion. The true centre-of-mass diffusion of polymers is very weak, and the corresponding diffusive length and time scales are orders of magnitude smaller than the large scales of the flow. Ideally, simulations should include and resolve this diffusion, because it is consistent with polymer physics and results in a parabolic equation for  $\boldsymbol{\mathsf{C}}$, which in turn allows for the use of standard numerical methods. In elastic turbulence, where the large scales of the flow are relatively small (as compared to elasto-inertial or inertia-dominated turbulence), it has recently become possible to follow this approach (Morozov Reference Morozov2022; Lellep et al. Reference Lellep, Linkmann and Morozov2024). However, even within the regime of elastic turbulence, the possible range of scales can vary by orders of magnitude, so for many experimental scenarios the cost of resolving polymer diffusion is prohibitive. Thus the diffusive term is typically omitted from the evolution equation for
 $\boldsymbol{\mathsf{C}}$, rendering it hyperbolic. When elasticity is dominant (measured by large values of the non-dimensional Weissenberg number
 $\textit {Wi}$), the lack of a diffusive dissipation mechanism results in the formation of extremely sharp gradients in the field of
 $\boldsymbol{\mathsf{C}}$, which if not treated carefully can cause a loss of positive-definiteness and numerical instability (e.g. Vaithianathan & Collins Reference Vaithianathan and Collins2003; Dubief et al. Reference Dubief, Terrapon, White, Shaqfeh, Moin and Lele2005; Fattal & Kupferman Reference Fattal and Kupferman2005). A plausible remedy to this high-
 $\textit {Wi}$ number problem (Alves et al. Reference Alves, Oliveira and Pinho2021) is to reintroduce diffusion but with an artificial enhancement.
Sureshkumar & Beris (Reference Sureshkumar and Beris1995) added a Laplacian term  $\kappa \,\Delta \boldsymbol{\mathsf{C}}$ with a constant diffusivity
 $\kappa$ that was artificially increased by several orders of magnitude (whence the name ‘global artificial diffusivity’) to stabilize viscoelastic simulations at high Reynolds numbers. The early simulations of elastic turbulence did the same (e.g. Berti et al. Reference Berti, Bistagnino, Boffetta, Celani and Musacchio2008; Thomases & Shelley Reference Thomases and Shelley2009; Liu & Khomami Reference Liu and Khomami2013). Unfortunately, this enhanced diffusion was found to impact the large-scale structures and dynamics of the flow, by smearing out the conformation tensor in the regions of high stretching (Min, Yoo & Choi Reference Min, Yoo and Choi2001; Yu & Kawaguchi Reference Yu and Kawaguchi2004; Dubief et al. Reference Dubief, Terrapon, White, Shaqfeh, Moin and Lele2005; Vaithianathan et al. Reference Vaithianathan, Robert, Brasseur and Collins2006; Sid, Terrapon & Dubief Reference Sid, Terrapon and Dubief2018). These artefacts are particularly prominent in elastic turbulence wherein velocity fluctuations are entirely dictated by elastic forces: excessive diffusion causes polymer stress to leak into and destabilize regions of low straining that otherwise would have remained unaffected by polymer feedback (Gupta & Vincenzi Reference Gupta and Vincenzi2019). To attenuate these spurious effects of enhanced diffusion, one may attempt to confine its action to regions of the flow where large polymer stretching and associated numerical errors are expected. This can be achieved by switching on diffusion only at those locations where
 $\boldsymbol{\mathsf{C}}$ loses positive-definiteness (Min et al. Reference Min, Yoo and Choi2001), or by making
 $\kappa$ a function of either the local strain rate (Gillissen Reference Gillissen2019) or the gradients of
 $\boldsymbol{\mathsf{C}}$ (Dzanic, From & Sauret Reference Dzanic, From and Sauret2022b). Another alternative is to use ‘hyperdiffusivity’, i.e. a higher power of the Laplacian of
 $\boldsymbol{\mathsf{C}}$, possibly in combination with a space–time-dependent hyperdiffusivity coefficient (Gillissen Reference Gillissen2019). In spectral space, the action of localized diffusion is to selectively damp the energy of high-wavenumber modes. In fact, pseudo-spectral simulations have used spectral filters to directly suppress high-wavenumber modes and thereby curb the growth of steep gradients (Hou & Li Reference Hou and Li2007; Balci et al. Reference Balci, Thomases, Renardy and Doering2011).
The second set of strategies preserves the positive-definiteness of  $\boldsymbol{\mathsf{C}}$ by simulating suitable reformulations of the constitutive equations. Vaithianathan & Collins (Reference Vaithianathan and Collins2003) applied the Cholesky decomposition to
 $\boldsymbol{\mathsf{C}}$ and evolved its Cholesky factor. Furthermore, in order to ensure the positiveness of the diagonal elements of the Cholesky factor (necessary for the uniqueness of the decomposition), they evolved equations for the logarithm of these elements. This two-step reformulation, which will henceforth be referred to as the Cholesky-log decomposition, has been used in several recent simulations (e.g. Gupta & Pandit Reference Gupta and Pandit2017; Plan et al. Reference Plan, Gupta, Vincenzi and Gibbon2017; Garg et al. Reference Garg, Calzavarini, Mompean and Berti2018; Gupta & Vincenzi Reference Gupta and Vincenzi2019; Garg, Calzavarini & Berti Reference Garg, Calzavarini and Berti2021; Dzanic et al. Reference Dzanic, From and Sauret2022b; Song et al. Reference Song, Liu, Lu and Khomami2022, Reference Song, Lin, Zhu, Wan, Liu, Lu and Khomami2023).
A logarithmic transformation, by itself, is also the basis of the log-conformation representation of Fattal & Kupferman (Reference Fattal and Kupferman2004, Reference Fattal and Kupferman2005), which evolves the matrix logarithm of the conformation tensor. The polymer stress can grow exponentially as one nears zones of high strain rate, such as stagnation points. In such situations, polynomial approximations to  $\boldsymbol{\mathsf{C}}$ fail, but the matrix logarithm of
 $\boldsymbol{\mathsf{C}}$, whose profile is simply linear, is easily resolved. Moreover, the positive-definiteness of
 $\boldsymbol{\mathsf{C}}$ – calculated by an exponentiation – is guaranteed. The log-conformation representation has been used in simulations of elastic turbulence (Singh et al. Reference Singh, Perlekar, Mitra and Rosti2024) and has been implemented in the rheoTool solver of the open-source program OpenFOAM
 $^\unicode{x00AE}$ (Pimenta & Alves Reference Pimenta and Alves2017); the latter has facilitated the simulation of elastic turbulence in wall-bounded flows, such as the cross-slot flow (Canossi, Mompean & Berti Reference Canossi, Mompean and Berti2020), the Taylor–Couette flow (van Buel, Schaaf & Stark Reference van Buel, Schaaf and Stark2018; van Buel & Stark Reference van Buel and Stark2020), and the swirling von Kármán flow (van Buel & Stark Reference van Buel and Stark2022).
Yet another reformulation strategy is based on the symmetric square root decomposition (SSR) of  $\boldsymbol{\mathsf{C}}$ (Balci et al. Reference Balci, Thomases, Renardy and Doering2011; see also Gutierrez-Castillo, Kagel & Thomases Reference Gutierrez-Castillo, Kagel and Thomases2020). This decomposition ensures positive-definiteness just like the Cholesky decomposition, but has the advantage of simpler evolution equations (even when compared to the log-transformation method) which makes it easier to code. A further benefit, particularly for mathematical analysis, is that unlike
 $\boldsymbol{\mathsf{C}}$, the symmetric square root of
 $\boldsymbol{\mathsf{C}}$ is an element of a vector space.
The third set of approaches focuses on the numerical methods used for spatial discretization of the evolution equations, and as such, complements the first two strategies. If artificial diffusion or spectral filtering is used to maintain a smooth field of  $\boldsymbol{\mathsf{C}}$, then pseudo-spectral methods are an ideal choice, especially for simple domains (Berti et al. Reference Berti, Bistagnino, Boffetta, Celani and Musacchio2008; Thomases & Shelley Reference Thomases and Shelley2009; Balci et al. Reference Balci, Thomases, Renardy and Doering2011; Liu & Khomami Reference Liu and Khomami2013; Garg et al. Reference Garg, Calzavarini, Mompean and Berti2018, Reference Garg, Calzavarini and Berti2021; Gutierrez-Castillo et al. Reference Gutierrez-Castillo, Kagel and Thomases2020). If artificial diffusion is avoided, then one must use numerical techniques developed for hyperbolic equations. Typically, finite-difference- or finite-volume-based spatial discretizations are used (Vaithianathan et al. Reference Vaithianathan, Robert, Brasseur and Collins2006; Gupta & Pandit Reference Gupta and Pandit2017; Plan et al. Reference Plan, Gupta, Vincenzi and Gibbon2017; Gupta & Vincenzi Reference Gupta and Vincenzi2019; Alves et al. Reference Alves, Oliveira and Pinho2021; Lin et al. Reference Lin, Wan, Zhu, Liu, Lu and Khomami2022), along with shock-capturing advection schemes designed to resolve the steep gradients of
 $\boldsymbol{\mathsf{C}}$ (e.g. the advection scheme of Kurganov & Tadmor (Reference Kurganov and Tadmor2000), which was adapted for polymer solutions by Vaithianathan et al. Reference Vaithianathan, Robert, Brasseur and Collins2006). Since viscosity keeps the velocity field smooth, some studies adopt a hybrid approach, in which a finite-difference-based shock-capturing scheme is used for evolving
 $\boldsymbol{\mathsf{C}}$ in combination with a lattice Boltzmann method (Dzanic et al. Reference Dzanic, From and Sauret2022b, Reference Dzanic, From, Gupta, Xie and Sauret2023; Dzanic, From & Sauret Reference Dzanic, From and Sauret2022c) or a pseudo-spectral method (Zhu & Xi Reference Zhu and Xi2020; Lin et al. Reference Lin, Wan, Zhu, Liu, Lu and Khomami2022; Song et al. Reference Song, Liu, Lu and Khomami2022, Reference Song, Lin, Zhu, Wan, Liu, Lu and Khomami2023) for the flow.
In this work, we compare three different reformulations of the conformation tensor, and also investigate the effect of including local polymer-stress diffusion. Calculations without artificial diffusion are facilitated by the use of the Kurganov–Tadmor advection scheme. Such a scheme resolves sharp gradients up to the grid scale, so the fine structures of the solution depend on spatial resolution; this dependence is also examined. Comparisons of different reformulations have been performed previously, for laminar flows, by Afonso, Pinho & Alves (Reference Afonso, Pinho and Alves2012), Chen et al. (Reference Chen, Marschall, Schäfer and Bothe2013), Palhares et al. (Reference Palhares, Oishi, Afonso, Alves and Pinho2016) and Hulsen, Spanjaards & Anderson (Reference Hulsen, Spanjaards and Anderson2021). The current study addresses this issue in the context of elastic turbulence.
We begin, in § 2, by presenting the Oldroyd-B and FENE-P models along with their main properties. In particular, we recall a mathematical result for the Oldroyd-B model that establishes a lower bound on the determinant of the polymer conformation tensor. While most studies in the past have focused on ensuring that the determinant of  $\boldsymbol{\mathsf{C}}$ stays greater than or equal to zero (to preserve positive-definiteness), the determinant must in fact obey a more stringent bound, for the Oldroyd-B model, and remain greater than unity (Hu & Lelièvre Reference Hu and Lelièvre2007). This additional constraint will be invaluable for assessing the accuracy of our numerical simulations.
Our study is carried out in the simplified setting of a two-dimensional periodic square with cellular forcing, a configuration that develops elastic turbulence for sufficiently high elasticity (Gupta & Pandit Reference Gupta and Pandit2017; Plan et al. Reference Plan, Gupta, Vincenzi and Gibbon2017). Cellular forcing is particularly useful for testing and comparing simulation methods because it generates highly localized straining regions, and hence sharp gradients in the polymer extension, which can be the source of numerical inaccuracies. Another forcing that has similar features and which has also been used in simulations of elastic turbulence is the four-roll mill forcing (Thomases & Shelley Reference Thomases and Shelley2009). Further details of our simulations are provided in § 2.
In § 3, we compare different reformulations of the conformation tensor, in particular the Cholesky-log and SSR decompositions. The latter is the simplest reformulation, and thus the easiest to implement in code, while the former has been widely used in recent simulations of elastic turbulence. Moreover, for the purposes of our analysis, the Cholesky-log decomposition has an advantage over the log-conformation reformulation. While the two approaches share a logarithmic transformation, it is not essential in the case of the Cholesky-log decomposition – the positive-definiteness of  $\boldsymbol{\mathsf{C}}$ is guaranteed by the Cholesky decomposition itself. So by comparing results with and without the log transformation, we will be able to determine its influence on the accuracy of predictions. As we will see, the conclusions of our study are sufficiently general so as to hold for the log-conformation representation as well.
Section 4 investigates the effect of adding local polymer-stress diffusion to the constitutive equation. While it is now clear that global artificial diffusion has a strong impact on the numerical solution and can cause spurious large-scale dynamics, the effect of localized diffusion is not yet entirely understood. On the one hand, the intervention of local diffusion is confined to a small region of the flow. On the other hand, by acting where polymer stretching is most intense, the diffusive spreading selectively modifies the transport of the largest polymeric stresses, which exert the strongest feedback on the flow. Here, we consider a form of local diffusion that has been applied recently to simulations of elastic turbulence (Dzanic et al. Reference Dzanic, From and Sauret2022b).
The principal applications of elastic turbulence arise from its ability to generate chaotic mixing at low Reynolds numbers. From this perspective, it is important that numerical simulations accurately predict the mixing of a scalar. Although solving the scalar transport equation is straightforward, errors in computing the flow, especially its large-scale structures, will contaminate the predictions of mixing properties. We demonstrate this in § 5, by studying the dispersal of a scalar blob, and show that different numerical treatments of the constitutive equation produce markedly different mixing behaviours.
In the absence of diffusion, the smallest length scale over which the conformation tensor may vary is determined by the spatial resolution. So do the large-scale dynamics converge even as the gradients of  $\boldsymbol{\mathsf{C}}$ get ever sharper with increasing resolution? We address this question in § 6, by examining the effects of a decreasing grid size on the flow structures and the energy spectrum.
Finally, in § 7, we summarize the findings of our study and discuss their implications for simulations of elastic turbulence.
2. Evolution equations and numerical simulations
Consider the flow of a dilute polymer solution whose kinematic viscosity has contributions of  $\nu$ from the solvent and
 $\nu _p$ from the polymer. The latter is proportional to the concentration of the polymer, which is characterized by its relaxation time to equilibrium,
 $\tau _p$, and the squared ratio of its contour length to the equilibrium length, i.e. the extensibility parameter
 $b$. The dynamics of the solution is then described in terms of the velocity field
 $\boldsymbol {u}(\boldsymbol {x},t)$ and the polymer conformation tensor
 $\boldsymbol{\mathsf{C}}(\boldsymbol {x},t)$, here scaled by the mean squared extension at equilibrium. Adopting either the Oldroyd-B or the FENE-P model, and considering the limit of negligible fluid inertia, we obtain the following coupled equations for
 $\boldsymbol{\mathsf{C}}(\boldsymbol {x},t)$ and
 $\boldsymbol {u}(\boldsymbol {x},t)$:
 $$\begin{gather} \partial_t \boldsymbol{\mathsf{C}} + \boldsymbol{u}\boldsymbol{\cdot}\boldsymbol{\nabla}\boldsymbol{\mathsf{C}} = \boldsymbol{\mathsf{C}}\boldsymbol{\cdot}\boldsymbol{\nabla}\boldsymbol{u} + (\boldsymbol{\nabla}\boldsymbol{u})^{\rm T} \boldsymbol{\cdot}\boldsymbol{\mathsf{C}} -\boldsymbol{\mathsf{T}}_p, \end{gather}$$
 $$\begin{gather}\boldsymbol{\nabla} p = \nu\,\Delta\boldsymbol{u} + \nu_p\,\boldsymbol{\nabla}\boldsymbol{\cdot} \boldsymbol{\mathsf{T}}_p + \boldsymbol{F}, \end{gather}$$
 $$\begin{gather}\boldsymbol{\nabla}\boldsymbol{\cdot}\boldsymbol{u}=0, \end{gather}$$
where  $p$ is the ratio of pressure to the constant density of the solution,
 $(\boldsymbol {\nabla }\boldsymbol {u})_{ij}=\partial _i u_j$, and
 $\boldsymbol {F}$ is a body forcing. The polymer contribution to the stress tensor,
 $\boldsymbol{\mathsf{T}}_p$, takes the form
 \begin{equation} \boldsymbol{\mathsf{T}}_p=\frac{1}{\tau_p}\,[\,f(r)\,\boldsymbol{\mathsf{C}}-\boldsymbol{\mathsf{I}}], \end{equation}
where  $f(r)=1$ for the Oldroyd-B model, and
 $f(r)=(b-d)/(b-r^2)$ for the FENE-P model. Here,
 $d$ is the space dimension,
 $r=\sqrt {\operatorname {tr}\boldsymbol{\mathsf{C}}}$, and
 $\boldsymbol{\mathsf{I}}$ is the identity matrix.
We have considered the Stokes limit for ease of computation, since we are interested in flows at low Reynolds number ( $Re$) for which the chaotic dynamics is driven solely by elastic instabilities. The same approach was taken, for instance, in Thomases & Shelley (Reference Thomases and Shelley2009), Balci et al. (Reference Balci, Thomases, Renardy and Doering2011) and Gutierrez-Castillo et al. (Reference Gutierrez-Castillo, Kagel and Thomases2020). In any case, the difficulties encountered in numerical simulations arise from the advection of the polymer conformation tensor and would be the same if the Navier–Stokes equations (with
 $Re \lesssim 1$) were used to evolve the flow. In fact, we have repeated some of our key calculations with the Navier–Stokes equations and found that our conclusions remain unchanged (see the supplementary material available at https://doi.org/10.1017/jfm.2024.858).
2.1. Lower bound on the determinant of  $\boldsymbol{\mathsf{C}}$

The polymer conformation tensor is positive-definite by construction, hence its determinant must be positive. This property is preserved by (2.1) (Constantin & Kliegl Reference Constantin and Kliegl2012). However, for the Oldroyd-B model, (2.1a) and (2.1c) have stronger implications on the determinant of  $\boldsymbol{\mathsf{C}}$: Hu & Lelièvre (Reference Hu and Lelièvre2007) proved that at long times, the determinant of
 $\boldsymbol{\mathsf{C}}$ must satisfy the bound
 \begin{equation} \det\boldsymbol{\mathsf{C}}\geq 1 \end{equation}
everywhere in the domain. More precisely, let us denote the value of the conformation tensor along a given Lagrangian trajectory  $\boldsymbol {x}_p(t)$ as
 $\boldsymbol{\mathsf{C}}(t)=\boldsymbol{\mathsf{C}}(\boldsymbol {x}_p(t),t)$. If there exists a time
 $t_\star$ such that
 $\det \boldsymbol{\mathsf{C}}(t_\star )\geq 1$, then
 $\det \boldsymbol{\mathsf{C}}(t)\geq 1$ for all
 $t > t_\star$. If in contrast
 $\det \boldsymbol{\mathsf{C}}(t_\star )< 1$, then
 $\det \boldsymbol{\mathsf{C}}(t)$ keeps growing as long as
 $\det \boldsymbol{\mathsf{C}}(t)< 1$. When applied to all trajectories, this result implies that, asymptotically in time, (2.3) must hold everywhere in space. Obviously, if at time
 $t=0$ the determinant of
 $\boldsymbol{\mathsf{C}}$ is greater than or equal to unity, as is the case in most simulations and certainly in all those presented here, then it must remain so throughout the subsequent evolution.
It is important to note that (2.3) has been proved only for the Oldroyd-B model (Hu & Lelièvre Reference Hu and Lelièvre2007), and a similar result that is local in space and time and uniform in  $\boldsymbol {\nabla }\boldsymbol {u}$ is not available, to our knowledge, for the FENE-P model. A bound analogous to (2.3) has been derived, though, for the Giesekus model (Masmoudi Reference Masmoudi2011).
When (2.3) is combined with the inequality  $\operatorname {tr}\boldsymbol{\mathsf{C}}\geq d(\det \boldsymbol{\mathsf{C}})^{1/d}$, which holds for any symmetric positive-definite
 $d\times d$ matrix, we obtain
 \begin{equation} \operatorname{tr}\boldsymbol{\mathsf{C}}\geq d. \end{equation}
This bound on the trace of  $\boldsymbol{\mathsf{C}}$, which was also derived by Musacchio (Reference Musacchio2002) using dynamical systems theory, has a natural physical interpretation. Recall that
 $\operatorname {tr}\boldsymbol{\mathsf{C}}$ is the squared extension of the polymer, ensemble-averaged over thermal noise, and that
 $\operatorname {tr}\boldsymbol{\mathsf{C}} = d$ when the polymer solution is at equilibrium (for which
 $\boldsymbol{\mathsf{C}}=\boldsymbol{\mathsf{I}}$ since
 $\boldsymbol{\mathsf{C}}$ has been scaled by the mean square polymer extension at equilibrium). Hence (2.4) implies that an incompressible flow cannot squeeze a polymer below its mean equilibrium extension.
We will show below that (2.3) is a useful criterion for testing the accuracy of numerical simulations.
2.2. Matrix decompositions
In the following sections, we will use two decompositions of the polymer conformation tensor, both of which preserve positive-definiteness.
Vaithianathan & Collins (Reference Vaithianathan and Collins2003) considered the tensor  $\boldsymbol{\mathsf{J}}=f(r)\,\boldsymbol{\mathsf{C}}$ and its Cholesky decomposition
 $\boldsymbol{\mathsf{J}}=\boldsymbol{\mathsf{L}}\boldsymbol{\mathsf{L}}^{\rm T}$, where
 $\boldsymbol{\mathsf{L}}$ is a lower triangular matrix with positive diagonal entries. The evolution equations for
 $\boldsymbol{\mathsf{L}}$ in two dimensions are given in Appendix A. To preserve the uniqueness of the decomposition, the diagonal elements of
 $\boldsymbol{\mathsf{L}}$ must remain positive during the time evolution. This is achieved by evolving
 $\tilde {L}_{ii}=\ln L_{ii}$ (
 $i=1,\dots,d$) and then exponentiating it at every time step to obtain
 ${L_{ii}}$. The off-diagonal elements are evolved directly. This decomposition method is termed the Cholesky-log decomposition. For reasons that will become clear later (in § 3), we also consider just the Cholesky decomposition without the logarithmic transformation.
The formulation proposed by Balci et al. (Reference Balci, Thomases, Renardy and Doering2011) considers the SSR decomposition  $\boldsymbol{\mathsf{C}}=\boldsymbol{\mathsf{B}}\boldsymbol{\mathsf{B}}^{\rm T} = \boldsymbol{\mathsf{B}}^2$, where
 $\boldsymbol{\mathsf{B}}=\boldsymbol{\mathsf{B}}^{\rm T}$ is symmetric. The evolution equations for
 $\boldsymbol{\mathsf{B}}$ are formulated so as to preserve its symmetry and hence the uniqueness of the decomposition (see Appendix A for the two-dimensional equations).
2.3. Numerical simulations
We perform simulations in a two-dimensional ( $d=2$) periodic square
 $V=[0,2{\rm \pi} ]^2$ and use a cellular forcing
 $\boldsymbol {F}(x,y)=f_0(-\sin Ky, \sin K x)$ to drive the flow. The wavenumber
 $K$ and magnitude
 $f_0$ of the forcing set the large length and velocity scales of the flow,
 $\ell = 1/K$ and
 $U=f_0/\nu K^2$, which in turn yield a large turnover time scale
 $T=\ell /U=\nu K/f_0$. For a Newtonian fluid (
 $\nu _p=0$), the velocity field
 $\boldsymbol {u}=-\boldsymbol {F}/\nu K^2$ is a solution of (2.1b). If polymers are added to the flow (
 $\nu _p\neq 0)$ and the Weissenberg number
 $\textit {Wi}=\tau _p/T$ is sufficiently large, then the flow becomes chaotic and exhibits elastic turbulence (Gupta & Pandit Reference Gupta and Pandit2017; Plan et al. Reference Plan, Gupta, Vincenzi and Gibbon2017). In our simulations, we take
 $\nu =0.05$,
 $f_0=0.02$,
 $K=2$ and
 $\tau _p=50$, which yield
 $\textit {Wi}=10$. In addition,
 $\nu _p=10^{-2}$ and
 $b=10^4$ (this value of
 $b$ has been used previously in simulations of elastic turbulence, see e.g. Song et al. Reference Song, Lin, Zhu, Wan, Liu, Lu and Khomami2023). The initial condition for the polymer conformation tensor is
 $\boldsymbol{\mathsf{C}}=\boldsymbol{\mathsf{I}}$. While we illustrate the results for this set of parameters, simulations for other parameter values – different polymer contour lengths (Yerasi Reference Yerasi2023) and forcing length scales (see the supplementary material) – show that our conclusions remain unaltered.
To integrate the flow equation, we use the vorticity–velocity formulation, i.e. we evolve the vorticity  $\omega =(\boldsymbol {\nabla }\times \boldsymbol {u})\boldsymbol {\cdot }\hat {\boldsymbol {z}}$ and calculate the velocity from the stream function
 $\psi =\varDelta ^{-1}\omega$ as
 $\boldsymbol {u}=(-\partial _y\psi,\partial _x\psi )$. Regarding the polymeric component, we solve either the equations for the symmetric square root
 $\boldsymbol{\mathsf{B}}$ or those for the Cholesky factor
 $\boldsymbol{\mathsf{L}}$ (see Appendix A). Fourth-order central differences are used to discretize the equations for the flow and the polymer, except for the advection of the latter. For the inversion of the Laplacian operator, required to calculate
 $\psi$ from
 $\omega$, we take advantage of the periodic boundary conditions and use the Fourier pseudo-spectral method. The velocity field is then obtained from
 $\psi$ via finite differences. The spatial resolution is
 $256^2$ in all simulations, except in § 6, where it is increased to
 $512^2$,
 $1024^2$ and
 $2048^2$. The time integration uses a second-order Runge–Kutta scheme with a time step
 $\delta t=2\times 10^{-3}$ for the lowest spatial resolution, and
 $\delta t=1\times 10^{-3}$ for the higher resolutions.
The advection term in the equations for  $\boldsymbol{\mathsf{B}}$ or
 $\boldsymbol{\mathsf{L}}$ is treated according to the scheme of Kurganov & Tadmor (Reference Kurganov and Tadmor2000). This scheme requires the calculation of the velocities at the faces of grid cells, i.e. midway between points on a uniform grid. To preserve incompressibility, we first obtain the stream function at the faces, via linear interpolation from the grid points, and then use finite differences to calculate the face velocities. Following Perlekar, Mitra & Pandit (Reference Perlekar, Mitra and Pandit2006) and Gupta, Perlekar & Pandit (Reference Gupta, Perlekar and Pandit2015), we apply the Kurganov–Tadmor scheme to the advection of the factor matrix
 $\boldsymbol{\mathsf{B}}$ or
 $\boldsymbol{\mathsf{L}}$. Hence the slope-limiting procedure that was used by Vaithianathan et al. (Reference Vaithianathan, Robert, Brasseur and Collins2006) to ensure positive-definiteness is not required, and its omission yields two important benefits. First, the simulation time is significantly reduced because the eigenvalues of
 $\boldsymbol{\mathsf{C}}$ need not be calculated. Second, the advection scheme remains second-order accurate throughout the computation, unlike the scheme with the slope limiter which, to maintain positive-definiteness, may locally reduce the accuracy to first-order at a significant fraction of the grid points (Vaithianathan et al. Reference Vaithianathan, Robert, Brasseur and Collins2006; Lin et al. Reference Lin, Wan, Zhu, Liu, Lu and Khomami2022).
In §§ 4 and 5, we also present simulations where we implement the local polymer-stress diffusion proposed by Dzanic et al. (Reference Dzanic, From and Sauret2022b). We therefore add to (2.1a) a diffusion term of the form  $\kappa (\boldsymbol {\nabla }\boldsymbol{\mathsf{C}})\,\Delta \boldsymbol{\mathsf{C}}$, where the variable diffusivity is
 $\kappa (\boldsymbol {\nabla }\boldsymbol{\mathsf{C}})=\bar {\kappa }\, Q(\boldsymbol {x},t)/Q_{max}(t)$ with
 $Q(\boldsymbol {x},t)=\sum _{i,j=1}^2\{\sum _{q=1}^2[\boldsymbol {\nabla }_q{\mathsf {C}}_{ij}(\boldsymbol {x},t)]^2\}^{1/2}$ and
 $Q_{max}=\max _{\boldsymbol {x}\in V} Q(\boldsymbol {x},t)$. Thus the artificial diffusivity varies locally between zero and
 $\bar {\kappa }$ according to the magnitude of the derivatives of the conformation tensor. As motivated in Dzanic et al. (Reference Dzanic, From and Sauret2022b), this local artificial diffusion will act in regions where the gradients of the conformation tensor are strong and limit their growth, thereby stabilizing the simulation; at the same time, it was envisioned that the reduction of the diffusivity away from such regions would limit the spurious effects of artificial diffusion. Following Dzanic et al. (Reference Dzanic, From and Sauret2022b), we take
 $\bar {\kappa }=5\times 10^{-5}$, which yields a Péclet number
 $Pe=U \ell /\bar {\kappa }=10^3$. (As discussed further in § 4, this value of
 $Pe$, which is the ratio of convective to diffusive transport, is two to seven orders of magnitude smaller than that encountered in experiments of elastic turbulence.) In these simulations, we use the Cholesky-log reformulation of the constitutive equation; the evolution equation for the Cholesky factor
 $\boldsymbol{\mathsf{L}}$ in the presence of stress diffusion can be found in Dzanic et al. (Reference Dzanic, From and Sauret2022c).
3. Matrix decompositions and erroneous large-scale dynamics
We begin by comparing the results obtained using different decompositions of  $\boldsymbol{\mathsf{C}}$. The simulations in this section are devoid of polymer-stress diffusion, i.e.
 $Pe=\infty$, and use the Oldroyd-B model, which makes the bound (2.3) available for testing the accuracy of the results.
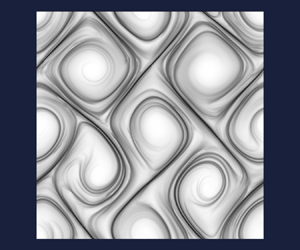
Figures 1(a) and 1(b) compare two representative snapshots of  $\operatorname {tr}\boldsymbol{\mathsf{C}}$ (the squared extension of the polymer) for the Cholesky-log and the SSR decompositions (corresponding animations are available in supplementary movie 1). The cellular forcing produces several large vortical cells, wherein the polymer is coiled and
 $\operatorname {tr}\boldsymbol{\mathsf{C}}$ is small, separated by straining zones that give rise to thin filamentary regions, wherein the polymer is strongly stretched and
 $\operatorname {tr}\boldsymbol{\mathsf{C}}$ is large. While the vortical cells are perturbed by the chaotic flow, in both simulations, it is clear that the symmetry of the forcing structure is much more closely preserved in the case of the Cholesky-log simulation, as compared to the SSR simulation. The former exhibits a well-ordered lattice of vortical cells, all of which maintain nearly the same orientation and shape throughout the simulation (figure 1a). In contrast, the vortical cells of the SSR simulation constantly change their orientation, shape and size, as from time to time some cells expand while others shrink (figure 1b).
Representative snapshots (instantaneous) of the logarithm of  $\operatorname {tr}\boldsymbol{\mathsf{C}}$ for (a) the Cholesky-log decomposition and (b) the SSR decomposition. For the corresponding animations, see supplementary movie 1. Both simulations use the Oldroyd-B model.

These differences in the large-scale structures of the field of  $\operatorname {tr}\boldsymbol{\mathsf{C}}$ are not merely momentary but persist over time, as evidenced by the time-averaged fields presented in figure 2. The plots for the two decompositions are strikingly dissimilar. The time-averaged field for the Cholesky-log simulation closely resembles the corresponding instantaneous field (compare figures 2(a) and 1(a)). The straining zones experience small chaotic oscillations and so are slightly smeared out in the time-averaged plot. In the SSR simulation, the time-averaged field looks very different from its instantaneous snapshot (figures 2(b) and 1(b)); the jostling of the vortical cells produces a time-averaged picture of smeared cells with a high degree of symmetry unseen at any instant of time. Note that this contrast between the large scales of the two simulations also appears in their vorticity fields (as illustrated in the supplementary material), since the variations of vorticity are well correlated with those of
 $\operatorname {tr}\boldsymbol{\mathsf{C}}$.
Time-averaged fields of the logarithm of  $\operatorname {tr}\boldsymbol{\mathsf{C}}$ for (a) the Cholesky-log decomposition and (b) the SSR decomposition. Both simulations use the Oldroyd-B model.

As a simple measure of the extent to which the cellular structure is perturbed during the evolution, we introduce the diagnostic
 \begin{equation} \varDelta(t)=\left\lvert\dfrac{\ln[\operatorname{tr}\boldsymbol{\mathsf{C}}((0,0),t)]-\ln[\operatorname{tr}\boldsymbol{\mathsf{C}}(({\rm \pi},0),t)]}{\ln[\operatorname{tr}\boldsymbol{\mathsf{C}}((0,0),t)]+\ln[\operatorname{tr}\boldsymbol{\mathsf{C}}(({\rm \pi},0),t)]}\right\rvert. \end{equation}
This quantity will be zero if the  $\operatorname {tr}\boldsymbol{\mathsf{C}}$ field perfectly preserves the cellular structure of the periodic forcing, which has wavenumber
 $K = 2$. Therefore,
 $\varDelta$ is indicative of the extent of distortion of the cellular structure, albeit at a single point. The time series of
 $\varDelta (t)$ is plotted in figure 3(a). Clearly, the fluctuations of
 $\varDelta (t)$ are significantly stronger for the SSR decomposition than for the Cholesky-log decomposition.
(a) Time series of  $\varDelta$ (defined in (3.1)). (b) Time series of the space averages of
 $\operatorname {tr}\boldsymbol{\mathsf{C}}$ (main graph) and the kinetic energy
 $e(t)$ scaled by its Newtonian value
 $e_0=\frac {1}{2}U^2$ (inset). All plots refer to simulations of the Oldroyd-B model.

The space-averaged statistics of the two simulations are presented in figure 3(b). The main graph compares the mean polymer stretching, given by the spatial average of the trace of the conformation tensor  $\langle \operatorname {tr}\boldsymbol{\mathsf{C}} \rangle _{V} = (2{\rm \pi} )^{-2}\int _V \operatorname {tr}\boldsymbol{\mathsf{C}} \, \mathrm {d}\kern0.06em \boldsymbol {x}$, and shows that it is higher for the SSR simulation. This is consistent with the the SSR simulation having a lower mean kinetic energy
 $e(t)=\frac {1}{2}\langle \boldsymbol {u}\boldsymbol {\cdot }\boldsymbol {u}\rangle _{V}$, as shown in the inset, because higher stretching in the straining zones endows the solution with a higher extensional viscosity (Larson Reference Larson1999). The differences in these mean statistics are rather small in comparison with the differences in the structure and dynamics of the vortical cells, evident from the full fields (figures 1 and 2).
It is important to note that the differences in the predictions of the two decompositions are independent of resolution. We have found that increasing the resolution from  $256^2$ to
 $1024^2$ produces sharper stretching zones in both simulations but no qualitative change in the large-scale dynamics; all the differences discussed above persist.
So which of the two simulations is correct? This question is difficult to address in the present context because, as discussed in the Introduction, elastic turbulence depends on the specific setting and hence lacks universal laws against which numerical predictions may be tested. In the case of the Oldroyd-B model, though, the lower bound  $\det \boldsymbol{\mathsf{C}} \geq 1$ presented in § 2.1 comes to our aid. The time series of the minimum of
 $\det \boldsymbol{\mathsf{C}}$ over the domain is presented in figure 4. We see that the lower bound is respected throughout the Cholesky-log simulation (figure 4a), whereas it is frequently violated in the SSR simulation (figure 4b). While such violations are found to occur over a small fraction of the domain (approximately 0.1 %), they are very frequent in time and very strong – we see many instances where
 $\det \boldsymbol{\mathsf{C}}$ approaches zero. This leads us to conclude that the SSR simulation is erroneous, and its distinguishing features, including the distortion of the cellular structure, are a consequence of inaccuracies in evolving the polymer stresses.
Time series of the minimum of  $\det \boldsymbol{\mathsf{C}}$ over the domain for (a) the Cholesky-log decomposition, and (b) the SSR decomposition. The bound
 $\det \boldsymbol{\mathsf{C}} \geq 1$ (see (2.3)) is satisfied by the former simulation but is repeatedly and strongly violated by the latter. The insets show the corresponding time series of
 $\operatorname {tr}\boldsymbol{\mathsf{C}}$, which as a consequence of (2.3) must remain greater than 2. All plots refer to simulations of the Oldroyd-B model.

In § 2.1, we recalled that the lower bound on  $\det \boldsymbol{\mathsf{C}}$ implies a lower bound on the squared extension,
 $\operatorname {tr}\boldsymbol{\mathsf{C}} \geq 2$. Thus a simulation that respects the bound on
 $\det \boldsymbol{\mathsf{C}}$ must necessarily respect the bound on
 $\operatorname {tr}\boldsymbol{\mathsf{C}}$ as well. This is seen in the inset of figure 4(a), which presents the time series of the minimum of
 $\operatorname {tr}\boldsymbol{\mathsf{C}}$ for the Cholesky-log simulation. In contrast, the SSR simulation violates both bounds (figure 4b), though the instances of
 $\operatorname {tr}\boldsymbol{\mathsf{C}}$ falling below 2 are much fewer than those of
 $\det \boldsymbol{\mathsf{C}}$ falling below 1. So while
 $\operatorname {tr}\boldsymbol{\mathsf{C}}$ has a simple physical interpretation and is easier to compute than
 $\det \boldsymbol{\mathsf{C}}$, we must verify the bound on the latter when ascertaining the accuracy of a simulation.
The next question is: Why does the SSR simulation suffer from inaccuracies and produce predictions that are different from the accurate Cholesky-log simulation? While the two matrix decompositions are similar in spirit, they do differ on one important point – the use of a logarithmic transformation. Recall that evolving  $\ln {\mathsf {L}}_{ii}$ and recovering
 ${\mathsf {L}}_{ii}$ through exponentiation is a strategy to enforce the positivity of the diagonal elements of
 $\boldsymbol{\mathsf{L}}$, in order to ensure the uniqueness of the Cholesky decomposition. From a mathematical point of view, however, this step is not needed if the diagonal elements stay positive under direct evolution. To assess the role of the logarithmic transformation, we have thus performed simulations of the Cholesky decomposition without the logarithmic transformation, i.e. we have evolved (A1) directly. Figure 5(a) shows that the diagonal elements of
 $\boldsymbol{\mathsf{L}}$ stay positive, nevertheless, hence the decomposition remains unique throughout the simulation. So we can now compare the results of the Cholesky decomposition with and without the logarithmic transformation.
Results for the Cholesky decomposition without the logarithmic transformation. (a) Time series of the minima of  ${\mathsf {L}}_{11}$ and
 ${\mathsf {L}}_{22}$ (inset) over the domain. (b) Representative snapshot (instantaneous) of the logarithm of
 $\operatorname {tr}\boldsymbol{\mathsf{C}}$ (the corresponding animation is in supplementary movie 2). (c) Time-averaged field of the logarithm of
 $\operatorname {tr}\boldsymbol{\mathsf{C}}$. (d) Time series of
 $\varDelta$. (e) Time series of the space averages of
 $\operatorname {tr}\boldsymbol{\mathsf{C}}$ (main graph) and the kinetic energy scaled by its Newtonian value
 $e(t)/e_0$ (inset). (f) Time series of the minimum of
 $\det \boldsymbol{\mathsf{C}}$ over the domain, with the corresponding time series of
 $\operatorname {tr}\boldsymbol{\mathsf{C}}$ in the inset. In (d,e), data for the Cholesky-log and SSR decompositions are reproduced from figure 3 for ease of comparison. All plots refer to simulations of the Oldroyd-B model.

Remarkably, we find that when the logarithmic transformation is not used, the results of the Cholesky simulation are analogous to those obtained with the SSR decomposition. This is apparent for all the observables that we have examined in this section, i.e. the instantaneous and time-averaged snapshots of the logarithm of  $\operatorname {tr}\boldsymbol{\mathsf{C}}$ (figures 5(b) and 5(c), respectively) as well as the time series of
 $\varDelta$,
 $\operatorname {tr}\boldsymbol{\mathsf{C}}$ and the kinetic energy (figures 5d,e). Moreover, if the logarithmic transformation is removed, then
 $\det \boldsymbol{\mathsf{C}}$ frequently drops well below unity in the Cholesky simulations as well (figure 5f). Clearly, the higher accuracy of the Cholesky-log decomposition compared to the SSR decomposition is due to the fact that the former evolves the logarithm of the diagonal elements of the Cholesky factor. This analysis therefore supports the use of a logarithmic transformation of the polymer conformation tensor for high-
 $\textit {Wi}$ simulations of elastic turbulence, which are characterized by large polymer-stress gradients. This conclusion is consistent with a previous comparative study on laminar flows, by Afonso et al. (Reference Afonso, Pinho and Alves2012), which found that simulations using the log-conformation approach remained stable up to higher values of
 $\textit {Wi}$ compared to the SSR decomposition.
Strictly speaking, the diagnosis carried out in this section applies only to the Oldroyd-B model, because it is based on the bound (2.3). Nonetheless, the reason for the greater accuracy of the Cholesky-log decomposition, namely its superior ability to resolve large gradients in the fields of polymer extension and stress, is sufficiently general to expect our conclusions to hold for other models, including FENE-P. Indeed, numerical simulations of the FENE-P model with the SSR and Cholesky-log decompositions exhibit the same differences as the simulations of the Oldroyd-B model (see Appendix B).
4. Artefacts of local diffusion of polymer stress
The centres of mass of dissolved polymers undergo Brownian motion, which produces a diffusion of polymeric stress (El-Kareh & Leal Reference El-Kareh and Leal1989). However, this diffusion is much weaker than advection and hence becomes significant only at extremely small scales – often well below the resolution of practical simulations. For a flow characterized by a large-scale velocity  $U$ and length
 $\ell$, the computational grid size
 $\delta _x$ must be small enough for diffusion to balance advection at the grid scale:
 $\kappa /\delta _x^2 \sim U/\delta _x$. Thus the number of grid points along any dimension, required to accurately resolve true polymer diffusion, scales with the Péclet number, i.e.
 $\ell /\delta _x \sim U \ell /\kappa = Pe$. Note that the Péclet number is the product of the Reynolds number (
 $Re = U \ell /\nu$) and Schmidt number (
 $\textit {Sc} = \nu /\kappa$):
 $Pe = Re\,\textit {Sc}$.
Using order of magnitude estimates for a high Reynolds number flow ( $Re \sim 10^3$) of a dilute aqueous polymer solution (dynamic viscosity
 $\mu \sim 10^{-3}$, density
 $\rho \sim 10{^3}$, and diffusivity
 $\kappa \sim 10^{-12}$, all in SI units), one obtains
 $\textit {Sc} \sim 10^6$ and hence
 $Pe \sim 10^9$ (El-Kareh & Leal Reference El-Kareh and Leal1989). This is much too large for a realistic simulation; indeed, numerical studies of high-
 $Re$ viscoelastic turbulence that have included diffusion typically take
 $\textit {Sc} \sim 1$ and thus
 $Pe \sim 10^3$ (Sureshkumar & Beris Reference Sureshkumar and Beris1995; Sureshkumar, Beris & Handler Reference Sureshkumar, Beris and Handler1997; Dubief et al. Reference Dubief, Terrapon, White, Shaqfeh, Moin and Lele2005), or at most
 $\textit {Sc} \sim 10^2$ (Sid et al. Reference Sid, Terrapon and Dubief2018).
Now consider elastic turbulence, which has been observed experimentally in small channels and with high-viscosity solvents. While these conditions suppress inertia, as intended, and yield small values of the Reynolds number,  $10^{-4} \lesssim Re \lesssim 1$, they also produce very large values of the Schmidt number,
 $10^9 \lesssim \textit {Sc} \lesssim 10^{10}$ (recall that the diffusivity varies inversely with the solvent viscosity). Thus, once again, we obtain very large values of the Péclet number,
 $10^{5} \lesssim Pe \lesssim 10^{10}$. Three representative examples, from the extensive experiments of Steinberg and coworkers, are given in table 1. The upper range of these
 $Pe$ values is too large for simulations, though the lowest value,
 $Pe = 10^5$, has recently been attained (Morozov Reference Morozov2022; Lellep et al. Reference Lellep, Linkmann and Morozov2024). Most simulations of elastic turbulence that include polymer stress diffusion have, however, been limited to
 $Pe$ not exceeding
 $10^3$, thereby artificially enhancing diffusion by several orders of magnitude (Thomases & Shelley Reference Thomases and Shelley2009; Liu & Khomami Reference Liu and Khomami2013). Recently, a linear stability analysis by Beneitez, Page & Kerswell (Reference Beneitez, Page and Kerswell2023) has considered
 $Pe$ as large as
 $10^6$ and shown that polymer-stress diffusion induces a novel instability, which appears to persist in the limit
 $Pe \to \infty$. Their nonlinear simulations, which show the transition to elastic turbulence, were limited to
 $Pe = 10^3$.
Order of magnitude of the Péclet number and other key parameters in some experiments of elastic turbulence. These experiments share a geometric length scale  $\ell \sim 10^{-3}\ {\rm m}$, and use a similar water–sucrose solvent with density
 $\rho \sim 10^{3}\ {\rm kg}\ {\rm m}^{-3}$ and dynamic viscosity
 $\mu \sim 10^{-1}\ {\rm Pa}\ {\rm s}$ (a hundred times more viscous than water). The third row refers to the rotating plate geometry in Groisman & Steinberg (Reference Groisman and Steinberg2004).

Artificially enhancing polymer diffusivity, as a means of numerical stabilization, is now well known to produce excessive smearing of the polymeric stress (Sid et al. Reference Sid, Terrapon and Dubief2018) and to qualitatively modify the large-scale dynamics in elastic turbulence (Gupta & Vincenzi Reference Gupta and Vincenzi2019). We now examine whether these artefacts are ameliorated by localizing diffusion to regions where the gradients of  $\boldsymbol{\mathsf{C}}$ are large. The motivation for trying to retain some form of diffusion is that one can then potentially avoid complex advection schemes, and instead use pseudo-spectral methods that are the workhorse of Newtonian turbulence simulations. Moreover, diffusion also aids in keeping
 $\boldsymbol{\mathsf{C}}$ positive-definite (Vaithianathan et al. Reference Vaithianathan, Robert, Brasseur and Collins2006), possibly allowing higher values of
 $\textit {Wi}$ to be attained with moderate spatial resolution. However, these potential benefits are immaterial if localized diffusion ends up modifying the dynamics of elastic turbulence.
We test the effects of local polymer-stress diffusion using the variable diffusivity proposed by Dzanic et al. (Reference Dzanic, From and Sauret2022b) (see § 2.3), which smooths the  $\boldsymbol{\mathsf{C}}$ field only at locations where its derivatives are large. In particular, we examine whether local diffusion modifies the large-scale structure of the polymer conformation field, by comparing simulations of the Cholesky-log decomposition with and without local polymer-stress diffusion. We have ensured that the only difference between the two simulations is the addition of a local diffusion term to (2.1a), so that any discrepancy in the dynamics must be due to local diffusion. To facilitate a comparison with the results of Dzanic et al. (Reference Dzanic, From and Sauret2022b), we use the same viscoelastic model (FENE-P) and the same peak diffusivity, which corresponds to
 $Pe=10^3$.
Figure 6 compares snapshots of  $\operatorname {tr}\boldsymbol{\mathsf{C}}$ that, along with the associated animations in supplementary movie 3, show that local diffusion produces misshapen vortical cells and a strong deviation from the forcing pattern. This observation is corroborated by the temporal evolution of
 $\varDelta (t)$ (see (3.1)) in the stationary state, depicted by figure 7(a); we see significantly larger fluctuations for
 $Pe=10^3$ than for
 $Pe=\infty$. This spurious behaviour of the vortical cells in the presence of local stress diffusion is similar to that found by Dzanic et al. (Reference Dzanic, From and Sauret2022b).
Representative snapshots of the logarithm of  $\operatorname {tr}\boldsymbol{\mathsf{C}}$ for the Cholesky-log reformulation of the FENE-P model with (a)
 $Pe=\infty$ and (b)
 $Pe=10^3$. For the corresponding animations, see supplementary movie 3.

(a) Time series of  $\varDelta (t)$. (b) Time series of the space averages of
 $\operatorname {tr}\boldsymbol{\mathsf{C}}$ (main graph) and kinetic energy scaled by its Newtonian value
 $e(t)/e_0$ (inset). (c) Power spectra of the kinetic energy fluctuations (the inset shows a semi-log plot of the normalized spectra). Each plot compares the results for the Cholesky-log reformulation of the FENE-P model with
 $Pe=\infty$ and
 $Pe=10^3$.

Noticeable differences are also found in the space-averaged dynamics of polymer stretching, presented in figure 7(b). For  $Pe=\infty$, the chaotic regime begins soon after the polymers are stretched out. In contrast, for
 $Pe=10^3$, the average extension of polymers is higher, and chaotic fluctuations develop only after a long interval of time during which the solution is in a quiescent state. Moreover, once the stationary state is eventually attained, the fluctuations are larger and slower for
 $Pe=10^3$. These differences are naturally reflected in the dynamics of the flow (inset of figure 7b), which for
 $Pe=10^3$ has a lower average kinetic energy (due to stronger polymer stretching and feedback) that fluctuates with larger and slower oscillations. This contrast in temporal fluctuations is evidenced by the power spectra of the space-averaged kinetic energy, presented in figure 7(c). Local diffusion causes the temporal dynamics to be dominated by a few low-frequency modes, while a much wider set of modes is active in the absence of diffusion (compare the normalized spectra in the inset of figure 7c).
We note that the spurious initial transient seen in figure 7(b) for  $Pe = 10^3$ is not the same as the transient observed in the simulations of Dzanic et al. (Reference Dzanic, From and Sauret2022b) (also with
 $Pe = 10^3$). Rather, their supplemental movie, for the case of cellular forcing, shows that the stationary chaotic regime is preceded by an initial period of about
 $250T$, during which the cellular structure ‘shakes’ without significant distortion. These differences in initial transients are not unexpected given that some parameter values in our simulations differ from those in Dzanic et al. (Reference Dzanic, From and Sauret2022b). The relevant observation is that local diffusion introduces a prolonged spurious transient in addition to producing significant differences in the stationary dynamics.
In the supplementary material, we show that these artefacts of local diffusion persist even when the size of the periodic computational domain is increased, relative to the large scales of the flow. In the context of global artificial diffusion and a four-roll mill flow, Dzanic, From & Sauret (Reference Dzanic, From and Sauret2022a) showed that the associated artefacts can be reduced by increasing the size of the periodic domain (which is equivalent to increasing the wavenumber of the forcing while keeping the domain size fixed, as is done in our supplementary material). In their study, the most egregious spurious feature – the dominance of the flow by a single vortex – was eliminated by increasing the domain size. Such an ameliorating influence is not obtained in the case of local artificial diffusion, as demonstrated in the supplementary material. This is reasonable since the effects of localized artificial diffusion cannot extend across the large scales of the flow (thereby introducing a spurious coupling between vortices via the periodic boundary conditions) in the way the effects of global artificial diffusion can.
Thanks to this localization, the spurious effects of local artificial diffusion were found to be relatively mild compared with global diffusion (Dzanic et al. Reference Dzanic, From and Sauret2022b). However, the above comparison with a non-diffusive simulation shows that local diffusion still distorts the dynamics significantly. Indeed, the differences between  $Pe=\infty$ and
 $Pe=10^3$, described above, parallel those that have been observed for global diffusion (Gupta & Vincenzi Reference Gupta and Vincenzi2019). This qualitative similarity may be understood by recognizing that the two forms of diffusion – local and global – act similarly in regions of the flow where the polymer stress is large and localized, regions that in fact are subject to strong polymer feedback and therefore drive elastic instabilities and dominate the chaotic dynamics.
In conclusion, artificially enhanced polymer-stress diffusion introduces spurious effects in the large-scale dynamics of elastic turbulence, even when the diffusion is local. Of course, the extent of spurious effects could be reduced, presumably, by decreasing the value of the diffusion coefficient (increasing  $Pe$). However, this would demand an increase in the spatial resolution, which defeats the purpose of using local artificial stress diffusion as a means of stabilizing moderate-resolution simulations of the hyperbolic constitutive equations. Hence we have restricted our study to
 $Pe = 10^3$, which is the value used by Dzanic et al. (Reference Dzanic, From and Sauret2022b) to obtain numerically stable simulations of elastic turbulence at a relatively low resolution of
 $256^2$. At this same resolution, the non-diffusive Kurganov–Tadmor-based simulation preserves the large-scale structures and does not exhibit the qualitative errors and artefacts of the diffusive simulation. If we were to increase
 $Pe$ in order to reduce diffusive artefacts, then we would have to use a higher spatial resolution for the artificial diffusion simulation than that used for the Kurganov–Tadmor simulation; there would then be no benefit from using local artificial diffusion.
The preceding assessment is, of course, specific to the cellular flow problem under consideration and to the form of localized diffusion proposed by Dzanic et al. (Reference Dzanic, From and Sauret2022b). It is possible that a different functional dependence of the localized diffusion coefficient on the gradients of  $\boldsymbol{\mathsf{C}}$ could result in smaller artefacts. However, given the non-universal nature of elastic turbulence, we do not expect the optimal form of diffusion, which has been tuned to minimize artefacts for a particular flow problem, to extend to other flows. The same is true of the threshold value of
 $Pe$ above which artefacts are deemed satisfactorily small. So each new problem would require a fresh comparison between the local diffusion simulation and a non-diffusive one. It is therefore preferable, in our opinion, to avoid using artificial diffusion of any form and instead achieve numerical stability by a specialized and accurate treatment (such as Kurganov–Tadmor) of the advection term in the hyperbolic constitutive equation. If, however, one must use artificial diffusion, then it is necessary to carefully compare with a non-diffusive simulation (of the specific flow of interest) in order to determine the threshold value of
 $Pe$ for which spurious artefacts are sufficiently small.
The discussion above assumes that the true physical value of  $Pe$ is too large to be resolved. If, however, the flow of interest (assuming typical polymer properties for which
 $\textit {Sc} \sim 10^{10}$) has an extremely small
 $Re$, such that the corresponding
 $Pe =Re\,\textit {Sc}$ is small enough to be resolved, then the best option is to include the true physical (global) diffusion of the conformation tensor. The first entry in table 1 corresponds to an experiment with
 $Pe \sim 10^5$, and a comparable value has been used in the recent spectral simulations of Morozov (Reference Morozov2022) and Lellep et al. (Reference Lellep, Linkmann and Morozov2024), which use global diffusion. As computational power continues to increase, experimental scenarios with relatively small
 $Pe$ should be simulated by including and resolving true physical stress diffusion; such an approach will be consistent with polymer physics while allowing for the use of standard numerical methods for parabolic equations. However, other situations with much larger
 $Pe$, up to
 $10^{10}$, are common (for example, entries two and three of table 1); here, when it is not possible to resolve true diffusion, our results suggest that one should refrain from artificially enhancing diffusion as a means of stabilizing the simulation or reducing the computational cost.
5. Implications for predicting mixing
Most applications of elastic turbulence are based on its enhanced mixing. We now show that this important property is substantially modified by the erroneous large-scale dynamics that results from using matrix decompositions without a logarithmic transformation (§ 3) or as a consequence of local polymer-stress diffusion (§ 4).
Consider the transport of a scalar blob that is passively dispersed by the flow. The scalar concentration  $\theta (\boldsymbol {x},t)$ satisfies the advection–diffusion equation
 \begin{equation} \partial_t \theta +\boldsymbol{u}\boldsymbol{\cdot}\boldsymbol{\nabla}\theta = \kappa_\theta \Delta\theta, \end{equation}
where the scalar diffusivity  $\kappa _\theta =10^{-5}$ is associated with a scalar Péclet number
 $Pe_\theta = 5\times 10^3$. Equation (5.1) is solved using the same finite-difference scheme as that used for the constitutive equation; thanks to its diffusion, though, no special treatment is needed to keep
 $\theta$ positive. In what follows, we begin the evolution of the scalar field only after the flow has attained stationarity.
A distinguishing feature of the accurate large-scale dynamics is that the cellular structure of the forcing is well preserved, unlike the erroneous simulations that have distorted vortical cells that constantly change their shape and size (see figure 1). Now, if a scalar blob is placed within one of the vortical cells, then its dispersion is bound to be impacted by the robustness of the cellular structure or the lack thereof. We therefore choose an initial configuration in which the scalar is concentrated over a disc of centre  $({\rm \pi},{\rm \pi} )$ and radius
 $r=0.4$, i.e. a blob is initially placed inside the central vortical cell.
Snapshots of the scalar field, after it has evolved for  $100T$, are presented in figure 8, for simulations of the FENE-P model using (a) the Cholesky-log decomposition and (b) the SSR decomposition, both without stress diffusion (i.e. with
 $Pe=\infty$), as well as (c) the Cholesky-log decomposition with local artificial diffusion (
 $Pe=10^3$). The associated animations are available in supplementary movie 4. Clearly, the initially circular blob of the scalar is dispersed more rapidly in case of the SSR decomposition than the Cholesky-log decomposition (compare figures 8a,b). The use of local polymer-stress diffusion (figure 8c) does not produce as big a difference in the scalar dispersion, but supplementary movie 4 does show that the long-time dispersion of the scalar is faster with artificial diffusion than without.
Snapshots of the logarithm of the scalar concentration  $\theta (\boldsymbol {x},t)$ at time
 $t=100T$ for (a) the Cholesky-log decomposition with
 $Pe=\infty$, (b) the SSR decomposition with
 $Pe=\infty$, and (c) the Cholesky-log decomposition with
 $Pe=10^3$. For the corresponding animations, see supplementary movie 4. The snapshots have been zoomed over the region
 $[{\rm \pi} /4,7{\rm \pi} /4]^2$ to emphasize the central cell; the movie shows the entire domain
 $V$. (d) The mixing diagnostic
 $\beta (t)$. (e) The variance of the scalar
 $\sigma (t)$ for the three simulations. All simulations are based on the FENE-P model.

To quantify the dispersion of the scalar blob, we consider the quantity  $\beta (t)=\langle \theta (t)\rangle _D - \langle \theta (0)\rangle _V$, where
 $\langle \,\cdot\, \rangle _V=(2{\rm \pi} )^{-2}\int _V \cdot \,\mathrm {d}\kern0.06em \boldsymbol {x}$ is the average over the entire domain, and
 $\langle \,\cdot\, \rangle _D=(4{\rm \pi} r^2)^{-1}\int _D \cdot \,\mathrm {d}\kern0.06em \boldsymbol {x}$ is the average over a disc
 $D=\{(x,y) \in V: (x-{\rm \pi} )^2+(y-{\rm \pi} )^2 \leq 2r\}$, which has twice the radius of the initial blob. When the scalar is completely mixed, the average over the disc
 $D$ will equal the average over the entire domain, which – being preserved by (5.1) – will remain at its initial value of
 $\langle \theta (0)\rangle _V$. Thus
 $\beta (t)$ will ultimately tend to zero as the scalar field becomes uniform at long times. Of course,
 $\beta (t)$ need not decrease monotonically because the scalar can be transported in and out of the disc
 $D$. In fact, we have chosen such a diagnostic in order to reveal differences in the way the scalar leaks out of the initial blob. We also use a second diagnostic, the variance across the entire domain
 $\sigma (t) = \langle (\theta -\langle \theta \rangle _V)^2\rangle _V$, which will decay monotonically as the scalar is mixed.
Figures 8(d) and 8(e) compare the time traces of  $\beta (t)$ and
 $\sigma (t)$, respectively, for the three simulations, and confirm that the scalar takes the longest time to mix in the case of the Cholesky-log decomposition without local stress diffusion. The time traces of
 $\beta$ (figure 8d) are characterized by sudden drops, which correspond to instances when a significant fraction of the scalar leaks out of the central cell. Such instances are few and far between in the Cholesky-log simulation (
 $Pe = \infty$), wherein the cells are just mildly perturbed, but more frequent in the other two simulations. These differences are due to the spurious distortion of the vortical cells that arises because of either numerical inaccuracies in the SSR simulation or artificial spreading of polymeric stress in the presence of local stress diffusion.
When the scalar leaves the central vortical cell, it is transported along the narrow straining regions in the form of thin, rapidly diffusing filaments (see supplementary movie 4). Thus more frequent leakage from the central cell translates to more rapid overall mixing; this is particularly clear in the case of the SSR simulation, for which a couple of leakage events at  $t\approx 50T$ and
 $t\approx 100T$ (see
 $\beta (t)$ for SSR in figure 8d) lead to a dramatic decrease of the variance during this time interval (figure 8e). The second leakage event, at
 $t\approx 100T$, is captured by the snapshot in figure 8(b).
These results demonstrate that even though the different solution methods all give rise to a chaotic flow, the discrepancies in their detailed dynamics, uncovered in this study, have a significant impact on the mixing properties of the flow.
6. Effect of spatial resolution
We have seen in § 3 that the  $\boldsymbol{\mathsf{C}}$ field develops extremely large gradients and contains thin filamentary zones of large polymer stretching (see figure 1a). Under these high-
 $\textit {Wi}$ conditions, shock-capturing advection schemes, such as the Kurganov–Tadmor method used here, are essential for maintaining numerical stability because they prevent the gradients from steepening indefinitely. The width of the shock-like large stretching zones is cut off at the grid scale and not allowed to decrease further. Importantly, the Kurganov–Tadmor method advects the stretching zones accurately, and unlike artificial diffusion, limits the large gradients without spreading the polymeric stress.
While the width of the stretching zones will keep decreasing with increasing spatial resolution, the key dynamical features of the flow should converge. We check if this is true by comparing Cholesky-log simulations of the FENE-P model at spatial resolutions  $256^2$,
 $512^2$,
 $1024^2$ and
 $2048^2$. Snapshots of
 $\operatorname {tr}\boldsymbol{\mathsf{C}}$ from
 $512^2$ and
 $2048^2$ simulations are presented in figures 9(a) and 9(b), respectively (the
 $256^2$ version is shown in figure 6a). We see that the large-scale cellular structures are very similar at all resolutions, though the stretching zones in the
 $2048^2$ simulation are much thinner and more refined.
Representative snapshots of the logarithm of  $\operatorname {tr}\boldsymbol{\mathsf{C}}$ for resolutions (a)
 $512^2$ and (b)
 $2048^2$ (the
 $256^2$ version is shown in figure 6a). (c) Energy spectra
 $E(K)$ and the spectra of
 $\operatorname {tr}\boldsymbol{\mathsf{C}}$ (inset) for different resolutions (the solid line depicts a scaling of
 $k^{-2.6}$). (d) Time series of the space average of kinetic energy scaled by its Newtonian value
 $e/e_0$ (main graph) and
 $\operatorname {tr}\boldsymbol{\mathsf{C}}$ (inset) for different resolutions. All simulations have been performed using the Cholesky-log reformulation of the FENE-P model with
 $Pe=\infty$.

The sharpening of stretching zones with increasing resolution is reflected in the spatial spectrum of  $\operatorname {tr}\boldsymbol{\mathsf{C}}$ (inset of figure 9c), which preserves its form but extends to larger wavenumbers. The same is true of the kinetic energy spectrum
 $E(k)$ (main graph of figure 9c), which approximates a power law up to a cutoff wavenumber, beyond which the spectrum decays rapidly (see Appendix C for a plot of the compensated spectra and a discussion of the power-law exponent). This cutoff wavenumber scales with the inverse of the width of the shock-like stretching zones and extends to higher wavenumbers as the resolution is increased.
If one focuses on a single high wavenumber, then a large difference in the corresponding energy will be seen; but this does not imply that new small eddies are being generated. Rather, the flow continues to be dominated by the same large vortical cells, as the resolution is increased, and only the straining zones in between the vortical cells become more refined.
The mean polymer stretching (inset of figure 9d) increases when the resolution is first doubled from  $256^2$ to
 $512^2$, but shows no further increase despite a subsequent fourfold increase in the resolution. The mean kinetic energy (main graph of figure 9d) does not change appreciably with resolution.
On the whole, the considerable thinning of the stretching zones, accompanying the increase of the resolution from  $256^2$ to
 $2048^2$, does not alter the qualitative dynamics of the flow; certainly, the distortion of the flow structures produced by an absence of a logarithmic transformation (§ 3), or the presence of artificial diffusion (§ 4), does not occur on increasing the resolution. There are, however, some subtle differences in the
 $2048^2$ simulation: the spectral energy content in the
 $k=1$ mode is higher in both spectra (figure 9c), and the kinetic energy exhibits slightly larger fluctuations (figure 9d). A systematic investigation of these variations would require simulations at even higher resolutions, which are beyond the scope of this work. Nonetheless, it is clear that apart from minor quantitative changes, the use of the Kurganov–Tadmor scheme along with the Cholesky-log decomposition enables the key features of the flow to be captured even at a relatively low resolution.
7. Summary and conclusions
The simulation of elastic turbulence presents difficulties associated with the advection of the polymer stress. The very small diffusivity of high-molecular-weight polymers, in tandem with their ability to undergo large extensions, leads to the formation of strong gradients in the polymer conformation tensor. If these are not resolved and advected accurately, then the mathematical properties of the conformation tensor may be violated, and ultimately the entire dynamics of the polymer solution may be misrepresented.
In the literature, a variety of strategies have been proposed to overcome the aforementioned numerical difficulties. The aim of this study was to identify the combination of numerical methods that are most suitable for the simulation of elastic turbulence. Our conclusion is that preference should be given to those methods that involve a logarithmic reformulation of the constitutive equation. In addition, if the true, physical stress diffusion, arising from the Brownian diffusion of polymers, is too small to be resolved, then one should refrain from artificially enhancing diffusion – even a local enhancement can produce artefacts. Instead, a non-diffusive shock-capturing scheme should be used for the advection of the conformation tensor. However, if the non-enhanced, true stress diffusion is large enough to be resolved (which could be the case for flows with very small Reynolds numbers), then it should be included; the resulting parabolic equation for the conformation tensor can then be discretized with standard techniques such as the pseudo-spectral method.
In high-strain regions, the use of a logarithmic reformulation is known to reduce the numerical errors associated with exponential stretching. We have shown that in elastic turbulence simulations, this is important to preserve the properties of the polymer conformation tensor and reproduce the large-scale dynamics faithfully. Although we have focused on the Cholesky-log decomposition, we expect similar conclusions to apply to the log-conformation representation, since the basic principles behind the two approaches are analogous. A point in favour of using the log-conformation method is that it would facilitate the calculation of a recently introduced diagnostic, the log Euclidean mean conformation tensor (Hameduddin & Zaki Reference Hameduddin and Zaki2019), that can aid in understanding and modelling viscoelastic turbulence.
Prior to this work, it was known that applying artificial polymer-stress diffusion locally, rather than uniformly in space and time, attenuates the artefacts that arise due to excessive smoothing of the polymer-stress field. It was unclear, however, whether the effects of localized stress diffusion are truly negligible or can still modify the large-scale dynamics, and if so, to what extent. We have shown here that since local diffusion intervenes at locations where the polymer stress is large and localized – i.e. precisely where the polymer feedback is strong – it ends up having a significant effect on the dynamics of the flow. Indeed, the redistribution of the largest stresses destabilizes the large flow structures in a similar way, if not to the same extent, as global artificial diffusion. The use of artificial polymer-stress diffusion, of any form, in elastic turbulence simulations should therefore be discouraged. (We have also tried using global and local hyperdiffusion with a fourth-order Laplacian, only to find once again that the large-scale dynamics changes substantially). This result leads to a preference for finite-difference methods over pseudo-spectral methods. Indeed, while the latter generally require some form of small-scale dissipation for stability, the former can more easily incorporate shock-capturing schemes to resolve the discontinuities that form in the polymer conformation field.
Our study also explains some observations of Balci et al. (Reference Balci, Thomases, Renardy and Doering2011), who used the SSR decomposition to simulate two-dimensional elastic turbulence, driven by a four-roll mill forcing. Their simulations displayed a strong destabilization of the cellular symmetry of the forcing – a characteristic artefact of global diffusion (Gupta & Vincenzi Reference Gupta and Vincenzi2019; Dzanic et al. Reference Dzanic, From and Sauret2022b) – even though they had abstained from adding stress diffusion to the constitutive equation. This loss of symmetry can now be explained as a consequence of using the SSR decomposition, which, as we have shown, gives rise to numerical inaccuracies that modify the large-scale dynamics in a manner similar to global or local artificial diffusion. Furthermore, Balci et al. (Reference Balci, Thomases, Renardy and Doering2011) do not use a shock-capturing advection scheme, but instead use a pseudo-spectral method. And though they implement a smooth filter to damp high-wavenumber modes (an operation that is similar in spirit to using local hyperdiffusivity), their simulations suffer from spurious spatial oscillations in the vicinity of sharp gradients in the conformation tensor.
The recommended combination of a logarithm-based reformulation of the conformation tensor along with a non-diffusive shock-capturing advection scheme allows us to predict the large-scale chaotic dynamics of the flow rather inexpensively. Indeed, the results of our simulations, using the Cholesky-log and Kurganov–Tadmor scheme, remain qualitatively unchanged with regard to the large scales and their spatial structure from resolution  $256^2$ to
 $2048^2$, though the quasi-discontinuous stretching zones become ever sharper and more refined with increasing resolution. At the same time, the erroneous large-scale dynamics, obtained when using the decomposition without a logarithmic transformation or when using local artificial diffusion, is not cured by increasing the resolution. Thus a high resolution, while preferable, is not as important a factor for elastic turbulence simulations as a log-based reformulation of the conformation tensor, the absence of artificial diffusion, and an accurate advection scheme.
Our analysis has also emphasized a mathematical lower bound on the determinant of the conformation tensor that has apparently been disregarded in numerical simulations of viscoelastic flows. In the Oldroyd-B model, the determinant of the conformation tensor must not only be positive, as required by the positive-definite nature of the tensor, but also remain greater than unity at all times (after an initial transient, in case it starts out below unity). Thus ensuring positive-definiteness is not sufficient for numerical accuracy. As we have seen, even when the determinant of the conformation tensor stays positive, thanks to a suitable matrix decomposition, its value can fall below unity, which in the case of the Oldroyd-B model signifies numerical errors that are significant enough to modify the large-scale dynamics of the polymer solution. Since the bound on the determinant of the conformation tensor applies only to the Oldroyd-B model, we recommend testing new numerical schemes or simulation codes first with the Oldroyd-B model, to ensure that the bound is satisfied, before applying them to other viscoelastic models.
While we have focused on elastic turbulence and the corresponding low- $Re$ limit, the bound on the determinant of the conformation tensor is valid for high-
 $Re$ flows as well. Preliminary simulations of high-
 $Re$ viscoelastic turbulent flows have shown that, just as for the low-
 $Re$ limit, simulations using the Cholesky-log decomposition preserve the bound, whereas those using the SSR decomposition violate it (Yerasi Reference Yerasi2023). However, the impact of the numerical errors on the dynamics of elasto-inertial turbulence at moderate
 $Re$ and drag-reduction at high
 $Re$ remain to be investigated. Nonetheless, it is clear that a logarithmic reformulation of the conformation tensor remains preferable even when
 $Re$ is not small.
Through the study of the dispersion of a scalar blob, we have shown that errors in computing the large-scale structures of the flow translate into erroneous predictions of mixing. Therefore, an accurate numerical method that resolves the advection of polymer stresses is important for studying not only details of the chaotic dynamics but also applications of elastic turbulence, such as mixing enhancement. A detailed analysis of mixing in elastic turbulence is an interesting avenue for future work. The smoothness of the flow field suggests that the mixing will be similar to that in the Batchelor regime, i.e. in the viscous sub-Kolmogorov scales of inertial turbulence. Techniques that have been used to study chaotic mixing in time-dependent laminar flows (Wiggins & Ottino Reference Wiggins and Ottino2004; Aref et al. Reference Aref2017) may be helpful in understanding the relationship between mixing and the dynamics of the large-scale coherent flow structures that dominate elastic turbulence.
Supplementary material
Supplementary material is available at https://doi.org/10.1017/jfm.2024.858. The data that support the findings of this study are available from the authors on reasonable request.
Acknowledgements
S.R.Y. and D.V. thank F.T. Pinho for helpful discussions. J.R.P. and D.V. acknowledge their Associateships with the International Centre for Theoretical Sciences (ICTS), Tata Institute of Fundamental Research, Bangalore, India. S.R.Y. and D.V. thank the OPAL infrastructure and the Center for High-Performance Computing of Université Côte d'Azur, and the ICTS, Bangalore, for computational resources. J.R.P. thanks the National PARAM Supercomputing Facility PARAM SIDDHI-AI at CDAC, Pune; simulations were also performed on the IIT Bombay workstations Aragorn, Faramir (procured through the IITB seed grant) and Gandalf (procured through grant SRG/2021/001185). A.G. would like to thank NSM facilities PARAM-SHIVAY at IIT-BHU and PARAM-SEVA at IIT Hyderabad, and mini-HPC Kanad at the Department of Physics, IIT Hyderabad.
Funding
This work was supported by CNRS (S.R.Y., 80 – Prime program); Agence Nationale de la Recherche (S.R.Y. and D.V., grant no. ANR-15-IDEX-01); IRCC, IIT Bombay (J.R.P., seed grant); DST-SERB (J.R.P., grant no. SRG/2021/001185; A.G., grant no. MTR/2022/000232); Fédération de Recherche Wolfgang Doeblin (J.R.P.); DST (A.G., grant no. DST/NSM/R&D_HPC_Applications/2021/05 and grant no. SR/FST/PSI-215/2016); the Indo–French Centre for Applied Mathematics IFCAM (S.R.Y., J.R.P. and D.V.); and the Indo–French Centre for the Promotion of Advanced Scientific Research (IFCPAR/CEFIPRA) (J.R.P. and D.V., project no. 6704-A).
Declaration of interests
The authors report no conflict of interest.
Appendix A. Decompositions of the polymer conformation tensor
A.1. The Cholesky-log decomposition
In three dimensions, the evolution equations for the Cholesky factor  $\boldsymbol{\mathsf{J}}=f(r)\,\boldsymbol{\mathsf{C}}$ can be found in Vaithianathan & Collins (Reference Vaithianathan and Collins2003) (a misprint in the equation for
 ${\mathsf {L}}_{32}$ is corrected in Perlekar et al. Reference Perlekar, Mitra and Pandit2006). For
 $d=2$, the equations simplify to (see Gupta et al. (Reference Gupta, Perlekar and Pandit2015); note that a sign error in the equation for
 ${\mathsf {L}}_{22}$ is corrected below)
 $$\begin{gather} \frac{D {\mathsf {L}}_{11}}{D t} = (\partial_x u_x) {\mathsf {L}}_{11}+(\partial_y u_x) {\mathsf {L}}_{21} +\frac{1}{2}\left[\frac{p}{{\mathsf {L}}_{11}}+(q-p){\mathsf {L}}_{11}\right], \end{gather}$$
 $$\begin{gather}\frac{D {\mathsf {L}}_{21}}{D t} = (\partial_x u_y) {\mathsf {L}}_{11}+(\partial_y u_y) {\mathsf {L}}_{21} + (\partial_y u_x)\,\frac{{\mathsf {L}}_{22}^2}{{\mathsf {L}}_{11}} +\frac{1}{2}\left[(q-p){\mathsf {L}}_{21}-\frac{p{\mathsf {L}}_{21}}{{\mathsf {L}}_{11}^2}\right], \end{gather}$$
 $$\begin{gather}\frac{D {\mathsf {L}}_{22}}{D t} = (\partial_y u_y) {\mathsf {L}}_{22}-(\partial_y u_x) \frac{{\mathsf {L}}_{21}{\mathsf {L}}_{22}}{{\mathsf {L}}_{11}} +\frac{1}{2}\left[(q-p){\mathsf {L}}_{22}+\frac{p}{{\mathsf {L}}_{22}}+\frac{p {\mathsf {L}}_{21}^2}{{\mathsf {L}}_{11}^2 {\mathsf {L}}_{22}}\right], \end{gather}$$
where
 $$\begin{gather} p = \frac{b -2 + j^2}{b \tau_p }, \quad q = \left[\frac{h}{b -2} - \frac{(b -2 + j^2)(\,j^2-2)}{b (b-2)\tau_p}\right], \end{gather}$$
 $$\begin{gather}j^2=\operatorname{tr}\boldsymbol{\mathsf{J}},\quad h = \operatorname{tr}[\boldsymbol{\mathsf{J}}\boldsymbol{\cdot}\boldsymbol{\nabla}\boldsymbol{u}+(\boldsymbol{\nabla} \boldsymbol{u})^{\rm T}\boldsymbol{\cdot} \boldsymbol{\mathsf{J}}]. \end{gather}$$
To enforce the positivity of the diagonal elements of  $\boldsymbol{\mathsf{L}}$, Vaithianathan & Collins (Reference Vaithianathan and Collins2003) evolved
 $\tilde {{\mathsf {L}}}_{ii}=\ln {\mathsf {L}}_{ii}$, and calculated
 ${\mathsf {L}}_{ii}$ by taking the exponential of
 $\tilde {{\mathsf {L}}}_{ii}$. The evolution equations for
 $\tilde {{\mathsf {L}}}_{ii}$ are
 \begin{align} \frac{D
\tilde{{\mathsf {L}}}_{11}}{D t} &= \partial_x u_x
+(\partial_y u_x)
{\mathsf {L}}_{21}\exp(-\tilde{{\mathsf {L}}}_{11})
+ \frac{1}{2}[\,p\exp(-2\tilde{{\mathsf {L}}}_{11})+q-p],\end{align}
 \begin{align} \frac{D \tilde{{\mathsf {L}}}_{22}}{D t} & = \partial_y u_y -(\partial_y u_x) {\mathsf {L}}_{21}\exp(-\tilde{{\mathsf {L}}}_{11}) \end{align}
 \begin{align} & \quad +\frac{1}{2}\{\,p\exp(-2\tilde{{\mathsf {L}}}_{22})+p{\mathsf {L}}_{21}^2\exp [-2(\tilde{{\mathsf {L}}}_{11}+\tilde{{\mathsf {L}}}_{22})] +q-p\}. \end{align}
A.2. The SSR decomposition
The symmetric square root of  $\boldsymbol{\mathsf{C}}$ satisfies (Balci et al. Reference Balci, Thomases, Renardy and Doering2011)
 \begin{equation} \partial_t \boldsymbol{\mathsf{B}} + \boldsymbol{u}\boldsymbol{\cdot}\boldsymbol{\nabla}\boldsymbol{\mathsf{B}} = \boldsymbol{\mathsf{B}}\boldsymbol{\cdot}\boldsymbol{\nabla}\boldsymbol{u}+\boldsymbol{\mathsf{a}}\boldsymbol{\cdot} \boldsymbol{\mathsf{B}}+\frac{1}{2\,\textit{Wi}} [(\boldsymbol{\mathsf{B}}^{\rm T})^{-1}-f(\operatorname{tr}\boldsymbol{\mathsf{B}})\boldsymbol{\mathsf{B}}], \end{equation}
where  $\boldsymbol{\mathsf{a}}$ is antisymmetric and, for
 $d=2$, its non-zero elements are
 \begin{equation} {\mathsf {a}}_{12}=-{\mathsf {a}}_{21}=\frac{{\mathsf {B}}_{12}\,\partial_x u_x-{\mathsf {B}}_{11}\,\partial_x u_y+{\mathsf {B}}_{22}\,\partial_y u_x-{\mathsf {B}}_{12}\,\partial_y u_y}{{\mathsf {B}}_{11}+{\mathsf {B}}_{22}}. \end{equation}
Appendix B. Comparison of matrix decompositions with the FENE-P model
In § 3, we compared the performances of the Cholesky-log decomposition and the SSR decomposition for the Oldroyd-B model. Here we present an analogous comparison for the FENE-P model.
The snapshots of  $\operatorname {tr}\boldsymbol{\mathsf{C}}$ in figure 10 and the associated animations in supplementary movie 5 show that in the Cholesky-log simulation, the vortical cells approximately retain the lattice structure of the forcing, whereas in the SSR simulation, the vortical cells are displaced, distorted and subject to constant changes in shape and size. The time series of
 $\varDelta (t)$ for the two decompositions (see (3.1)) confirm a greater distortion of the cellular structure in the SSR simulations (figure 11a).
Representative snapshots (instantaneous) of the logarithm of  $\operatorname {tr}\boldsymbol{\mathsf{C}}$ for (a) the Cholesky-log decomposition and (b) the SSR decomposition. For the corresponding animations, see supplementary movie 5. Both simulations use the FENE-P model without artificial diffusion (
 $P=\infty$).

Time series of (a)  $\varDelta (t)$, and the minimum of
 $\det \boldsymbol{\mathsf{C}}$ over the domain for (b) the Cholesky-log decomposition and (c) the SSR decomposition. The insets show the corresponding time series of the minimum of
 $\operatorname {tr}\boldsymbol{\mathsf{C}}$ over the domain. All plots refer to simulations of the FENE-P model.

These differences parallel those observed in § 3 for the Oldroyd-B model. There, we could use the bound of Hu & Lelièvre (Reference Hu and Lelièvre2007) on  $\det \boldsymbol{\mathsf{C}}$ to determine which of the two decompositions yielded the correct large-scale dynamics. Since an equivalent bound is not available for the FENE-P model, we cannot in principle draw any rigorous conclusions from the analysis of
 $\det \boldsymbol{\mathsf{C}}$ in this case. Nevertheless, it is interesting to note that the behaviour of
 $\det \boldsymbol{\mathsf{C}}$ in the FENE-P model is similar to that observed in the Oldroyd-B model: the minimum of
 $\det \boldsymbol{\mathsf{C}}$ over the spatial domain is persistently greater than unity in the Cholesky-log simulation, while it frequently falls below unity in the SSR simulation (figures 11b,c).
Appendix C. Power-law behaviour of the energy spectrum
Section 6 examines the effect of increasing spatial resolution on simulations that use the non-diffusive Kurganov–Tadmor advection scheme, along with the Cholesky-log decomposition. The kinetic energy spectra obtained at different resolutions (figure 9c) all have the same form: an approximate power-law behaviour, for intermediate wavenumbers, followed by a rapid decay of energy as one approaches the grid scale. The cutoff wavenumber, beyond which the energy decays rapidly, extends to larger values with increasing resolution; the form of the spectra up to the cutoff, however, seems to follow a similar power-law-like decay at all resolutions. We examine this apparent power-law behaviour more carefully by plotting the compensated energy spectra, in figure 12, using the power-law scaling  $k^{-2.6}$ obtained by fitting the spectrum of the lowest-resolution case (
 $256^2$). Though the compensated spectra in figure 12 are not perfectly flat, this plot shows that the spectra at all resolutions remain close to the same power law, i.e. the approximate power-law decay does not change with resolution. The extension of the cutoff wavenumber to higher values, with increasing resolution, is associated with the sharpening of the shock-like stretching zones. Importantly, this refinement does not alter the qualitative features of the flow, such as the structure of the vortical cells (illustrated by the snapshots of
 $\operatorname {tr}\boldsymbol{\mathsf{C}}$ in figures 9a,b).
Kinetic energy spectra  $E(k)$ plotted after compensating for the power-law variation
 $k^{-2.6}$. Results obtained at different spatial resolutions are presented; all simulations use the Cholesky-log reformulation of the FENE-P model. The corresponding uncompensated spectra are shown in figure 9(c).

As noted in the Introduction, the nature of forcing has a strong impact on the properties of elastic turbulence (unlike inertial turbulence). Thus prior studies of two-dimensional elastic turbulence have obtained energy spectra with different values for the power-law exponent, depending on the applied forcing. In addition, the choice of constitutive model also affects the exponent. Gupta & Vincenzi (Reference Gupta and Vincenzi2019) use the cellular forcing (with wavenumber  $K=2$) and report exponents
 ${\approx }-2.5$ for the Oldroyd-B model, and
 ${\approx }-2.3$ for the FENE-P model. (Our FENE-P simulations, which yield an exponent
 ${\approx }-2.6$, use the same parameter values as those in Gupta & Vincenzi (Reference Gupta and Vincenzi2019) except for the maximum polymer square extension
 $b$, which we take to be
 $10/3$ times larger.) Plan et al. (Reference Plan, Gupta, Vincenzi and Gibbon2017), who use the Oldroyd-B model, obtain a value
 $-3$ when using the cellular forcing (with wavenumber
 $K = 4$ or 10, rather than
 $K=2$) and a smaller value
 $\approx -3.7$ when using the rectilinear Kolmogorov forcing. The Kolmogorov forcing lacks the strong extensional zones of the cellular forcing, and produces a shear-dominated flow with weaker gradients; hence the steeper spectra.
The aforementioned results of Gupta & Vincenzi (Reference Gupta and Vincenzi2019) and Plan et al. (Reference Plan, Gupta, Vincenzi and Gibbon2017) are based on simulations that use the Cholesky-log reformulation along with the non-diffusive Kurganov–Tadmor advection scheme. If artificial diffusion is used, then its smoothing action will reduce the energy of the high wavenumbers. In fact, in the case of cellular forcing, artificial diffusion dramatically steepens the spectra to the extent that the power-law behaviour is lost (Gupta & Vincenzi Reference Gupta and Vincenzi2019). The case of Kolmogorov forcing, though, is not as strongly affected: the spectra retain a power-law range even with artificial diffusion, and an exponent close to  $-3.7$ is obtained (Berti et al. Reference Berti, Bistagnino, Boffetta, Celani and Musacchio2008; Garg et al. Reference Garg, Calzavarini and Berti2021).
For three-dimensional homogeneous and isotropic flows, the theory of Fouxon & Lebedev (Reference Fouxon and Lebedev2003) predicts a power-law steeper than  $k^{-3}$, and recent numerical simulations (Singh et al. Reference Singh, Perlekar, Mitra and Rosti2024) have obtained an exponent
 $-4$ in agreement with the three-dimensional theory. The shallower decay (
 ${\sim }k^{-2.6}$) of the spectrum in our simulations is not disallowed by the theory of Fouxon & Lebedev (Reference Fouxon and Lebedev2003) because our two-dimensional simulations are strongly non-homogeneous and anisotropic (see the time-averaged field of
 $\operatorname {tr}\boldsymbol{\mathsf{C}}$ in figure 2(a), or of vorticity in figure 5(c) of the supplementary material – both averaged fields exhibit distinct vortical regions separated by anisotropic straining filaments).


 Open access

