



1. Introduction
The development of high intensity and ultrashort laser pulses and their interaction with plasma has led to the detection of several acceleration techniques for both electrons and ions. Such plasma accelerators can accommodate huge electric fields within them (${\sim }5\text {--}6$ orders of magnitude higher than other conventional accelerators). Owing to their compact size and cost efficiency, such laser–plasma-based accelerators have been shown to be quite promising to obtain energetic particles which have a diverse range of applications ranging from fast ignition in fusion, proton radiography and hadron therapy to understanding several astrophysical phenomena (Tabak et al. Reference Tabak, Hammer, Glinsky, Kruer, Wilks, Woodworth, Campbell, Perry and Mason1994; Khoroshkov & Minakova Reference Khoroshkov and Minakova1998; Bychenkov, Tikhonchuk & Tolokonnikov Reference Bychenkov, Tikhonchuk and Tolokonnikov1999; Remington et al. Reference Remington, Drake, Takabe and Arnett2000; Roth et al. Reference Roth, Cowan, Key, Hatchett, Brown, Fountain, Johnson, Pennington, Snavely and Wilks2001; Malka et al. Reference Malka, Fritzler, Lefebvre, d'Humières, Ferrand, Grillon, Albaret, Meyroneinc, Chambaret and Antonetti2004; Murakami et al. Reference Murakami, Hishikawa, Miyajima, Okazaki, Sutherland, Abe, Bulanov, Daido, Esirkepov and Koga2008).
The fundamental concept behind most of the accelerator schemes using ultra-intense laser pulses is that these pulses drive extremely large electrostatic fields due to the displacement of electrons from their positions. The most widely studied mechanism of accelerating ions using a short-pulsed laser is the target normal sheath acceleration (TNSA) (Pukhov Reference Pukhov2001; Wilks et al. Reference Wilks, Langdon, Cowan, Roth, Singh, Hatchett, Key, Pennington, MacKinnon and Snavely2001). Protons (present as water vapour or impurities) are predominantly accelerated by the sheath field because of their higher charge by mass ratio, irrespective of the target constituents. It is however found that TNSA protons have a broad energy spread with an exponential energy spectrum, which has a detrimental effect on their application in radiation therapy. The energy scaling of TNSA is $\varepsilon \propto \sqrt {I_L}$ , where $I_L$
 is the peak laser intensity.
As the laser transfers energy to the electrons at the front surface of a solid target, a significant amount of the laser energy is reflected, which makes the laser-to-electron energy conversion rather low. This has resulted in the quest for an engineered target that absorbs most of the laser energy which will lead to the generation of hot electrons more efficiently in the vacuum–target interface. Several micro- or nanostructured targets (Hegelich et al. Reference Hegelich, Albright, Cobble, Flippo, Letzring, Paffett, Ruhl, Schreiber, Schulze and Fernández2006; Schwoerer et al. Reference Schwoerer, Pfotenhauer, Jäckel, Amthor, Liesfeld, Ziegler, Sauerbrey, Ledingham and Esirkepov2006; Cialfi, Fedeli & Passoni Reference Cialfi, Fedeli and Passoni2016) have shown an improved absorption efficiency of the target leading to the formation of quasimonoenergetic ion beams. The use of a critical density target with plasma density $n_e\sim n_c$ , where $n_c = {m_e \omega ^{2}}/{4{\rm \pi} e^{2}}$
 , causes a significant amount of the laser energy to be absorbed in the plasma and effectively produces energetic electrons (Sgattoni et al. Reference Sgattoni, Londrillo, Macchi and Passoni2012). Here, $\omega$
 is the laser frequency, and $m_e$
 and $e$
 are the electronic mass and charge, respectively. As the laser propagation is inhibited around the critical density, it steepens the plasma profile and heats the electrons efficiently. The heated electrons perturb the background plasma and drive a return current. This fast return current plays an important role in heating the entire plasma volume.
The radiation pressure of an intense laser pulse sweeps the plasma electrons from the front of the laser pulse. The high electric field formed as a result accelerates the ions from the front side of the target, which creates a piston effect (Denavit Reference Denavit1992; Sentoku et al. Reference Sentoku, Cowan, Kemp and Ruhl2003). This is the mechanism behind the radiation pressure acceleration (RPA). The laser piston effect pushes the plasma front-surface inwards, thus steepening the density ahead of the piston (also known as hole boring; HB) (Schlegel et al. Reference Schlegel, Naumova, Tikhonchuk, Labaune, Sokolov and Mourou2009). This dense region moves along the laser axis with a velocity ${v_{hb}}/{c}={u}/{(1+u)}$ , where $u=a_0 \sqrt {{\mathcal {Z} m_e n_c}/{An_p m_p}}$
 . Here, $m_p$
 and $n_p$
 , and $m_e$
 and $n_e$
 are the masses and number densities of the protons and electrons, respectively; $\mathcal {Z}$
 and A are the atomic number and the mass number of the ion species, respectively, and $c$
 is the velocity of electromagnetic radiation in vacuum. A circularly polarized laser pulse is favoured in the observation of the RPA mechanism, as in such cases the oscillating component of the ponderomotive force vanishes (Macchi et al. Reference Macchi, Cattani, Liseykina and Cornolti2005). RPA has a better laser-to-target energy conversion efficiency as compared with TNSA and a comparatively narrower energy spread. Another similar but more approachable mechanism is the collisionless shock acceleration (CSA). The interaction of an intense laser pulse with a near critically dense or a slightly over-dense target creates sharp fronts of density and electric field ahead of the pulse. Such a sudden rise in density (or electric field) leads to the formation of shock waves that travel at a supersonic velocity ($v_s$
 ) inside the plasma medium (Forslund & Shonk Reference Forslund and Shonk1970). If the electrostatic potential energy, $\mathcal {Z}e\varPhi _{\max }$
 , associated with the shock front exceeds the kinetic energy of the upstream ions, $\frac {1}{2}mv_i^{2}$
 , where $v_i$
 is the velocity of the ions in the shock frame, the ions get reflected elastically to twice the shock velocity and are accelerated along the laser axis (Stockem et al. Reference Stockem, Boella, Fiuza and Silva2013). For electrostatic shocks to efficiently reflect ions, the plasma must be sufficiently transparent so that the target is heated effectively, with the condition for shock reflection fulfilled: ${a_0^{2}}/{\gamma }> 0.78 ({n_i}/{n_c})$
 (Zhang et al. Reference Zhang, Qiao, Huang, Shen, You, Yan, Wu, Zhou and He2016). Here, $a_0 = {eE_0}/{m_e \omega c}$
 is the normalized vector potential, $E_0$
 is the laser electric field amplitude and $n_i$
 is the ion number density. The required target transparency and heating for shock reflection usually make it a late-blooming mode of acceleration of ions, compared with RPA or TNSA. The highly energetic ion beams reflected from the shocks are monoenergetic at the beginning due to their constant velocities. However, at later times when these ions pass through the sheath electric field, their velocities become non-uniform. As a result, the energy spectra become significantly broadened. The final value of accelerated ion velocity thus depends on both shock reflection and sheath acceleration (Pak et al. Reference Pak, Kerr, Lemos, Link, Patel, Albert, Divol, Pollock, Haberberger and Froula2018). The ion energy spectrum shows a plateau region signifying the contribution of both shock and sheath acceleration (Silva et al. Reference Silva, Marti, Davies, Fonseca, Ren, Tsung and Mori2004; Pak et al. Reference Pak, Kerr, Lemos, Link, Patel, Albert, Divol, Pollock, Haberberger and Froula2018).
The size and shape of the target have a significant influence on the interaction mechanisms governing the generation of energetic ions (d'Humières et al. Reference d'Humières, Lefebvre, Gremillet and Malka2005; Henig et al. Reference Henig, Kiefer, Geissler, Rykovanov, Ramis, Hörlein, Osterhoff, Major, Veisz and Karsch2009; Obst et al. Reference Obst, Göde, Rehwald, Brack, Branco, Bock, Bussmann, Cowan, Curry and Fiuza2017). The reduction in the lateral dimension confines the hot electrons to the laser focus area for a longer time causing stronger heating of the target. Spherical targets with diameters less than the laser focal size are known to cause an increase in the peak beam energy along with the reduction of the beam divergence, and are thus favoured as a target geometry (Pšikal et al. Reference Pšikal, Limpouch, Kawata and Andreev2006; Kluge et al. Reference Kluge, Enghardt, Kraft, Schramm, Zeil, Cowan and Bussmann2010; Ostermayr et al. Reference Ostermayr, Haffa, Hilz, Pauw, Allinger, Bamberg, Böhl, Bömer, Bolton and Deutschmann2016; Hilz et al. Reference Hilz, Ostermayr, Huebl, Bagnoud, Borm, Bussmann, Gallei, Gebhard, Haffa and Hartmann2018).
Apart from this classic CSA mechanism, there is a well-studied low-density variant known as low-density collisionless shock acceleration (LDCSA) (d'Humières et al. Reference d'Humières, Antici, Glesser, Boeker, Cardelli, Chen, Feugeas, Filippi, Gauthier and Levy2013; Gauthier et al. Reference Gauthier, Levy, d'Humieres, Glesser, Albertazzi, Beaucourt, Breil, Chen, Dervieux and Feugeas2014; Antici et al. Reference Antici, Boella, Chen, Andrews, Barberio, Böker, Cardelli, Feugeas, Glesser and Nicolaï2017), where a combination of shock acceleration and a decreasing sheath field is present. In the existence of a decreasing density gradient in the target, the sheath electric field monotonically decreases with the distance. As a result, the ions in the high-density region experience a greater pull towards the rear-side electric field, compared with the ions in the low-density region. Accordingly, the surging of fast-moving ions in the low-density region creates an electrostatic shock front that reflects ions in its upstream region. The upstream ions originally moving with a velocity $v_0$ will get reflected from the shock front and attain final ion velocities $v_f = 2v_s + v_0$
 . These velocities will, however, be greatly non-uniform as $v_0$
 is non-uniform due to the decreasing sheath effect. In addition to that, the shock velocity $v_s$
 varies with time as the shock front travels through regions of non-uniform densities. All these effects eventually broaden the energy spectra, and the monoenergetic nature of the ions is greatly reduced.
The main pulse is preceded by a pre-pulse in almost all the available high-power laser facilities. This pre-pulse hits the solid density foil target and ionizes it to form a plasma layer. The density of the target thus decreases due to the plasma expansion, and the main pulse encounters a smoothly increasing density profile instead of a sharp vacuum–solid interface. In the case of homogeneous density targets, the main laser pulse enters an overdense regime instantly, and thus most of its energy is reflected. A density gradient at the front side of the target increases the laser absorption inside it (Andreev, Okada & Toraya Reference Andreev, Okada, Toraya, Nakajima and Deguchi2002; Sentoku et al. Reference Sentoku, Bychenkov, Flippo, Maksimchuk, Mima, Mourou, Sheng and Umstadter2002; Andreev et al. Reference Andreev, Platonov, Okada and Toraya2003; Kluge et al. Reference Kluge, Enghardt, Kraft, Schramm, Zeil, Cowan and Bussmann2010). The presence of a pre-pulse alters the density of the target foil to form a plasma layer with a smooth density gradient both at the target front and the rear, as shown by Andreev et al. (Reference Andreev, Sonobe, Kawata, Miyazaki, Sakai, Miyauchi, Kikuchi, Platonov and Nemoto2006). A decreasing density gradient at the rear side of the target helps to maintain the monoenergetic nature of the ejected ion bunches by the formation of an evenly distributed TNSA field (Fiúza et al. Reference Fiúza, Stockem, Boella, Fonseca, Silva, Haberberger, Tochitsky, Gong, Mori and Joshi2012; Feng-Chao Reference Feng-Chao2013). Boella et al. (Reference Boella, Fiúza, Novo, Fonseca and Silva2018) showed that for the production of monoenergetic protons the characterizing density scale length ($L$ ) must be such that ${4{\rm \pi} c_s^{2}}/{v_s \omega _{pi}} \ll L \leq {{\rm \pi} c}/{\omega _{pi}}$
 , where $\omega _{pi} = \sqrt {{4{\rm \pi} ne^{2}}/{m_i}}$
 is the ion–plasma frequency. A larger inhomogeneity scale length at the foil front increases the absorption coefficient, thereby increasing the temperature of fast electrons and the energy of accelerated ions (Andreev et al. Reference Andreev, Platonov, Okada and Toraya2003). The production of energetic ions thus depends significantly on the density gradient and scale length. A detailed simulation study using near-critical mass-limited spheres is reported by Novo et al. (Reference Novo, Kaluza, Fonseca and Silva2016) where the targets were heated by a pre-pulse leading to the target expansion and reduction in the density in the target front-side. They obtained an optimized parameter space for producing protons having tunable energies. The acceleration regime behind the energetic ions of mass $m_i$
 from different regions of the target usually depend on the target density and the delay time between the two pulses ${\rm \Delta} t \,[\textrm {ps}] = 4.7 \times 10^{-3}\sqrt {{m_i}/{m_e}}(\sigma - 1)({R_0\,[\mathrm {\mu } \textrm {m}]}/{\widetilde {a_0}})$
 . Here, $\sigma = {R}/{R_0} = ({n_0}/{n})^{1/3}$
 such that the density of the target drops from $n_0$
 to $n$
 as its radius increases from $R_0$
 to $R$
 when a pre-pulse of normalized vector potential $\widetilde {a_0}$
 hits upon it. The tailoring of the density profile can tune the inherent ion acceleration mechanisms. Svedung Wettervik, DuBois & Fülöp (Reference Svedung Wettervik, DuBois and Fülöp2016) have shown using Eulerian Vlasov–Maxwell simulations that the final monoenergetic behaviour of the ions can be preserved with a target having a layered density structure. In a recent paper by Yang et al. (Reference Yang, Zhou, Huang, He, Wu, Cai, Qiao, Yu, Ruan and He2020), it was found that the interaction of intense lasers with modified targets having soliton-like density profiles can be administered to obtain energetic protons of controllable beam properties. It was observed that a steep density gradient resulted in protons accelerating with higher energies via an interplay of RPA and TNSA mechanisms with a higher angle of divergence.
In this paper, we perform three-dimensional (3-D) particle-in-cell (PIC) simulations to study the effects of different density inhomogeneities in a micron-sized spherical (droplet) target when irradiated with a femtosecond pulsed laser. The target diameter is kept less than the laser spot-size to ensure proper focusing of the laser onto the target (Pšikal et al. Reference Pšikal, Limpouch, Kawata and Andreev2006; Kluge et al. Reference Kluge, Enghardt, Kraft, Schramm, Zeil, Cowan and Bussmann2010; Ostermayr et al. Reference Ostermayr, Haffa, Hilz, Pauw, Allinger, Bamberg, Böhl, Bömer, Bolton and Deutschmann2016; Hilz et al. Reference Hilz, Ostermayr, Huebl, Bagnoud, Borm, Bussmann, Gallei, Gebhard, Haffa and Hartmann2018). In many practical situations, it is difficult to maintain a homogeneous density of the target as the presence of a pre-pulse and the pedestal of the main pulse tend to expand the plasma isotropically creating a gradually decreasing density profile starting at the target centre. In the simulation set-up, the presence of the pre-pulse is taken into account by considering a predeformed plasma target. The prime objective of this paper is to investigate the acceleration of protons from a plasma droplet having a tailored density profile such that its density is peaked at the centre and dropping gradually towards the edges. Kluge et al. (Reference Kluge, Enghardt, Kraft, Schramm, Zeil, Cowan and Bussmann2010) used two dimensions in space and three dimensions in velocity (2D3V) PIC simulations to study the effect of an exponential density profile on the front side of a solid mass-limited target. They found enhanced hot electron temperature and density in the presence of the pre-plasma. In a similar work, Lecz & Andreev (Reference Lecz and Andreev2015) exploited a linear and exponential density profile on the front and rear sides of an expanded foil target to suppress the proton energy spread and obtain a distinct peak in the energy spectrum. However, in all the previous reported works, to the best of our knowledge, a comparison of different density gradients both at the front and rear sides of a microsphere plasma was missing. Moreover, a Gaussian-shaped inhomogeneity is proposed in this work that supports a prominent monoenergetic peak in the proton spectra. Such a density profile remains somewhat unexplored as far as our knowledge goes. To attain high-quality and efficient hole-boring RPA, Weng et al. (Reference Weng, Sheng, Murakami, Chen, Liu, Wang, Yuan and Zhang2018) modified the target density which had a Gaussian variation along the laser direction. With a peak $a_0 = 100$ , a mean energy of 30 MeV was obtained from the monoenergetic beam of ions. Although a Gaussian-shaped density profile is proposed in our present work, its exact geometry is vastly different from that used in the work of Weng et al. (Reference Weng, Sheng, Murakami, Chen, Liu, Wang, Yuan and Zhang2018). Due to the spherical shape of the target considered in our simulations, our target has a Gaussian density variation along all the sides and not just along the longitudinal direction. We have considered that the target is composed of pure hydrogen with only electrons and protons as the plasma constituents with proton mass $m_p = 1836 m_e$
 . Thus, the terms ‘ions’ and ‘protons’ are interchangeable in this study. At first, the inhomogeneity is assumed to be linear in the first approximation. As the main pulse gradually travels from an underdense to an overdense plasma at the core of the target, several rich physical phenomena emerge, which were not seen in previous studies. In contrast to a previous paper by the present authors (Bhagawati, Kuri & Das Reference Bhagawati, Kuri and Das2019), where a uniform density target was used, the enhanced laser-to-plasma energy absorption, in this case, resulted in quasimonoenergetic peaks in the proton spectrum. In this paper, a distinct comparison is made between the protons accelerated from an inhomogeneous target and those from a target of uniform density. It is found that the rear-side electrostatic field in an inhomogeneous target is reduced to quite an extent which results in the persistence of the monoenergetic feature of the protons for a longer time. The role of the peak density at the centre is analysed in the slightly overdense regime ensuring sufficient heating of the target by the energetic electrons. The role of radiation pressure is seen to be accentuated as the peak density (i.e. the density gradient) is increased, which can be predicted from previous literature. Further, when the inhomogeneity is shifted from being a linear one to a novel Gaussian profile, the proton energy spectra showed a more pronounced peak which resulted due to the combined effect of an enhanced RPA–HB effect on the protons at the front side and a suppressed TNSA field on the rear side.
2. 3-D PIC simulation
We used Picpsi-3D (Upadhyay et al. Reference Upadhyay, Patel, Rao, Naik and Gupta2012), a relativistic 3-D PIC code to study the interaction of a high-intensity circularly polarized laser with an inhomogeneous density spherical plasma target. A laser pulse having both spatial and temporal Gaussian pulse profile with wavelength $1\ \mathrm {\mu }$ m and laser period 3.3 fs was allowed to propagate along the $Z$
 -axis. The laser had a spatial full-width at half-maxima (FWHM) of $10\ \mathrm {\mu }$
 m and a laser pulse duration (temporal FWHM) $\tau _L = 33$
 fs. The critical density for $1\ \mathrm {\mu }$
 m laser was $n_c = 1.1 \times 10^{21}$
 cm$^{-3}$
 . Throughout this work, we used a laser intensity $I_L = 1.37 \times 10^{20}$
 W cm$^{-2}$
 corresponding to normalized vector potential $a_0 = {eE_0}/{\sqrt {2} m_e \omega c}\approx 7.07$
 . The relativistic intensity allowed the laser to penetrate the normally overdense target due to induced transparency. The electrons attained relativistic velocities which increased their mass by the Lorentz factor, $\gamma = \sqrt {1+{a_0^{2}}/{2}}$
 (Macchi Reference Macchi2013). The electron plasma frequency became modified as $\omega _p' = \sqrt {{4{\rm \pi} n_e e^{2}}/{\gamma m_e}}$
 thus making the plasma target transparent to the laser pulse up to a greater density. The simulation box used was a cube of length, $20\ \mathrm {\mu }$
 m with each side consisting of 400 cells. The target was transparent to the laser pulse up to a relativistically enhanced skin depth which exceeded the classical skin depth by a factor of $\sqrt {\gamma }$
 . The relativistic intensity of the laser pulse thus helped to resolve the skin depth by the cell size. A predeformed spherical hydrogen plasma target was placed in the middle of the box, i.e. at an equal distance from all six sides of the simulation box. The centre of the plasma target coincided with the $10\ \mathrm {\mu }$
 m mark of the box and the space between the target and the walls consisted of a vacuum. Absorbing boundary conditions for both the fields and the particles were used along all the six walls. The density inhomogeneity was introduced such that the density was peaked at the centre and gradually decreasing towards the edges. All the simulations were performed with 50 macroparticles per cell and one time step $T_0 = 0.2\omega _p ^{-1}$
 , where $\omega _p$
 is the plasma frequency corresponding to the peak density ($n_{p}$
 ) of the target. The plots and figures in the subsequent sections follow this normalization scheme: the electric field was normalized by the laser electric field ($E_0$
 ); the electron and proton momentum was normalized by $m_e c$
 and $m_p c$
 , respectively; the electron density ($n_e$
 ) or the proton density ($n_p$
 ) was normalized by the critical density $n_c$
 .
We first introduced the laser pulse to a spherical plasma target having a linear density gradient, such that the density was peaked at the centre and linearly dropping towards the edges. The peak density ($n_p$ ) was varied (starting with $8n_c$
 ) so that the laser encountered an overdense region near the centre. The relativistically induced transparency rendered the target dilute for the laser at the near-surface of the plasma target. The density gradient could be created by hitting a solid density hydrogen target ($n_0 \approx 6 \times 10^{22}\ \textrm {cm}^{-3}$
 ) with a laser pre-pulse (Lecz & Andreev Reference Lecz and Andreev2015). This resulted in plasma expansion which was modelled as a linear density gradient in the first approximation. The peak of interaction took place at ${\approx }0.188$
 ps which was the assumed time delay between the pre-pulse and the main pulse (${\rm \Delta} t$
 ) for our simulation. As suggested by Lecz & Andreev (Reference Lecz and Andreev2015), the peak density was $n_p = {n_0 d_0}/{2 c_{s0} {\rm \Delta} t}$
 , where $c_{s0} = \sqrt {{T_e}/{m_p}}$
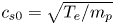 is the ion-acoustic velocity after interaction with the pre-pulse and $d_0$
 is the original diameter of the solid hydrogen target. The expansion of the target depended on the temperature of the electrons heated by the pre-pulse. The initial diameter was chosen in a way that the scale length $L = {n_p}/{( {{\textrm {d}}n}/{{\textrm {d}}r})} = 2.5\ \mathrm {\mu }$
 m, which satisfied the condition ${4{\rm \pi} c_s^{2}}/{v_s \omega _{pi}} \ll L \leq {{\rm \pi} c}/{\omega _{pi}}$
 mentioned by Boella et al. (Reference Boella, Fiúza, Novo, Fonseca and Silva2018). Here $r$
 represents the radial direction of the density gradient. The density relation is thus given by

where $r_c = 10$ , $L = 2.5$
 and $7.5 \leq r \leq 12.5\ \mathrm {\mu }$
 m. As the plasma had a density gradient along all the sides, the scale lengths in the laser propagation direction ($Z$
 ) for the front and the rear sides were $L_f = L_r = 2.5\ \mathrm {\mu }$
 m.
In the case of a target with an increasing density profile, the laser was stopped around the relativistically corrected critical density and a significant amount of laser energy was absorbed by the electrons via collisionless absorption processes. With peak density $n_p = 8n_c$ , the target was transparent to the laser up to $\gamma n_c = 5.1n_c$
 . The laser ponderomotive pressure pushed the electrons forward creating a charge separation region in the relativistically overdense regime. These hot electrons gained kinetic energy and travelled to the rear side of the target, which perturbed the plasma in the process, and heated the entire plasma volume as a result. The laser peak hit the target at ${\simeq } 188$
 fs and the electron momentum in the longitudinal and transverse directions are shown in figures 1(a) and 1(b), respectively. The time frame was considered from the instant the uniform target was hit by the pre-pulse. These phase space plots show that the electrons acquired relativistic velocities as the laser peak hit the pre-formed plasma target. The electron energy spectra at the peak of interaction (${\simeq }188$
 fs) (shown in figure 1c) gives a rough estimate of the average energy of the thermal electrons $T_h \simeq 0.76$
 MeV from the slope of its linear fitting (red solid line). The temperature of the electrons further increased beyond the peak of interaction to 3.68 MeV at 225.6 fs.
(a) The longitudinal electron momentum and (b) the transverse electron momentum along the propagation direction $Z$ for the target with linear density gradient with $n_p = 8n_c$
 at time 188 fs when the laser peak intensity hits the target. The colour axis gives the particle distribution in arbitrary units. (c) Electron energy spectrum at the same time as in panel (a,b).

Figure 2 depicts the longitudinal proton momenta at three different times, (a) $t=226$ fs, (b) $t=263$
 fs and (c) $t=338$
 fs. It is seen that apart from the expansion velocity ($v_0$
 ) of the protons, the protons from the central peak density region attained a forward momentum (as shown in figure 2a). At a somewhat later state (figure 2b), a shock front developed at approximately $Z=11\ \mathrm {\mu }$
 m which evolved to a fully developed shock reflecting protons in its course at time 338 fs, as shown in figure 2(c).
The proton longitudinal momentum and distribution at the central layer in the $YZ$ plane along the laser axis ($Z$
 ) for the target with linear density gradient and $n_p = 8n_c$
 at a time (a) 226 fs (before wave breaking), (b) 263 fs (around wave-breaking time) and (c) 338 fs (after wave breaking). The colour scheme represents the proton distribution in arbitrary units.

Due to the presence of a linear density gradient in the plasma target, the inner ions experienced a stronger Coulombic repulsion than the outer ions. These inner protons in the high-density zone of the plasma, as a result, moved faster than the outer protons. This eventually resulted in the over-running of the outer protons by the inner fast-moving protons. The surging of the protons in the overtaking region excited a shock. The origin of the shock observed in the simulation was attributed to the LDCSA mechanism, as described by Antici et al. (Reference Antici, Boella, Chen, Andrews, Barberio, Böker, Cardelli, Feugeas, Glesser and Nicolaï2017). The time at which the inner high-velocity protons overtake the outer low-velocity protons is termed the wave-breaking time (Grismayer & Mora Reference Grismayer and Mora2006). Figures 2(b) and 2(c) are an indication that the wave breaking caused the production of a shock and the upstream protons received a further thrust along the longitudinal direction by getting reflected from the shock. The resulting velocities acquired by the reflected protons, which were originally moving with $v_0$ velocities, were thus $v_f = 2v_s + v_0$
 , where $v_s$
 is the velocity of the shock. Figures 2(a) and 2(c) give the snapshots of the proton phase spaces for times before and after wave breaking, respectively, whereas figure 2(b) shows the same around the wave-breaking time. The proton density plot in figure 3(a) shows a rise in the proton density around this time ($t=263$
 fs) (red curve) which gradually propagated along the positive laser direction as a shock in plasma. In the temporal evolution of the electric field (figure 3b), after the initial amplified electric field driven by the radiation pressure of the laser, another field appeared at a later time (around 260 fs) that was associated with the shock excited in the decreasing gradient.
(a) The proton density along the laser axis for different times (represented by different colours) for the target with linear density gradient and $n_p = 8n_c$ . (b) The temporal evolution of the longitudinal electric field (normalized by the laser field $E_0$
 ) for the same target. The formation of an electrostatic field due to shock is shown by an arrow.

3. Effect of peak density
The peak density was increased to $12n_c$ keeping $L$
 fixed. Due to the relatively steeper density gradient encountered by the laser in the target front, the laser pressure pushed a dense electron wall followed by a proton wall. The proton density in the central $YZ$
 plane plotted against the laser axis $Z$
 (figure 4a) shows a high-density proton region pushed inwards by the laser pressure at time $t\simeq 230$
 fs. The dense proton region propagated along $Z$
 with time. This is visible in figure 4(b) where the maximum density along the laser axis attained a peak value at the centre, $Z \simeq 10\ \mathrm {\mu }$
 m at time 246 fs (black curve) when the laser effect was still present. As the laser pulse died out, the origin of the proton dynamics shifted from a laser-pressure-based regime to an expansion regime. With the expansion of the central highly dense region of the target, its density reduced (visible by the red curve of figure 4b). At 307 fs (blue curve), the maximum value of the density increased again at $Z \simeq 11\ \mathrm {\mu }$
 m. This was similar to the previous case with peak density $8n_c$
 , where the expanding protons from the core eventually over-ran the outer protons creating a shock in the process. In the inset of figure 4(b), the longitudinal proton phase plots are shown at times 276 and 307 fs. The shock reflected protons emerged from $Z \simeq 11\ \mathrm {\mu }$
 m at time 307 fs, which were absent at time 276 fs signifying the occurrence of wave breaking between 276 and 307 fs. The time evolution of the longitudinal electric field plot in figure 4(c) (black square) shows a second peak emerging after the laser pulse had died off. This secondary peak was created after the wave-breaking time and was due to the excitation of the shock front. This shock front ultimately reflected the upstream protons and pushed them to high velocities. The blue circles in figure 4(c) show the maximum velocity attained by the protons in the longitudinal direction. On the other hand, in figure 4(d), we show the maximum longitudinal proton momenta of only the inner/upstream protons ($Z\geq 10\ \mathrm {\mu }$
 m). By inner protons, we mean the protons that were accelerated in the forward $Z$
 -direction from near the centre. These protons were later reflected from the shock front generated in the decreasing density gradient of the target. It is seen from figure 4(d) that after the formation of the shock and the eventual reflection of the protons from the shock-front, the forward momentum of the upstream protons in the downward density region of the target attained an abrupt spike in its value. This effect at $t > 280$
 fs further indicated the occurrence of the wave breaking. The reflection of the protons in the path of the shock was responsible for an increase in the final proton energy. The blue circles in figure 4(c) show the maximum longitudinal velocity attained by the protons that increased steadily up to a certain time (wave-breaking time), thereafter it varied proportionally to $\ln (0.858 \omega _{pi}t)$
 (Grismayer & Mora Reference Grismayer and Mora2006).
(a) The proton density plot in the central $YZ$ plane for the target with linear density gradient and peak density $n_p = 12n_c$
 at time ${\approx }230$
 fs. The laser radiation pressure pushes the protons from the target front-side creating a high-density proton front. (b) Proton density along the central laser axis for different times (represented by different colours). The inset figures show the longitudinal proton momenta along $Z$
 at times 276 and 307 fs. For the same target, the time evolution is shown for (c) the longitudinal electric field (black squares) and the maximum proton velocity (blue circles), and (d) the maximum longitudinal momentum of the upstream protons (from the core region) at the central layer in the $YZ$
 plane. From the blue curve (circles) of figure 4(c) the maximum value of the proton velocity for a particular time among all the protons (including the sheath accelerated protons) are plotted against time, whereas in figure 4(d) the maximum longitudinal momenta of only the upstream ions are plotted against time.

To study the effect of the central peak density on the dynamics of the accelerated protons, a comparison was made between three targets having peak densities $n_p = 8n_c$ , $12n_c$
 and $15n_c$
 . The longitudinal electric field and the corresponding proton momentum plot of the three targets show the onset of the proton reflection from the shock front at ${\simeq }300$
 fs (figure 5a,b) and at a later time ${\simeq }338$
 fs in figure 5(c,d). In figure 5(a), the central peak was pronounced in the case of $n_p = 12n_c$
 that helped in the reflection of protons from the shock front. With a large number of shock-reflected protons, the energy achieved by the protons reached an optimum value in the case with $n_p = 12n_c$
 . As the density was further increased to $n_p = 15n_c$
 , the absorption efficiency decreased as the laser encountered a steep gradient. This effect restrained volumetric heating of the plasma which restricted the shock formation in this case. Due to the rise in the density gradient for the target with $n_p = 15n_c$
 the target front-side behaved almost like a sharp vacuum–plasma interface. The radiation pressure effect played a dominant role in this case to accelerate the protons.
The longitudinal electric field in the central $YZ$ plane at (a) 300 fs and (c) 338 fs; and the longitudinal proton momentum along $Z$
 at (b) 300 fs and (d) 338 fs for three different peak target densities. The colour axis in panel (b,d) represents the proton distribution in arbitrary units. The presence of a strong peak in the case with $n_p = 12n_c$
 in panel (c) leads to a higher number of protons obtaining momentum from near the centre in the corresponding phase plot in panel (d).

Weng et al. (Reference Weng, Murakami, Mulser and Sheng2012) using one-dimensional simulations with extremely high laser intensities ($a_0 = 100$ ) obtained a boundary density of $12n_c$
 which separated the effect of an incomplete hole-boring from a classical hole-boring case. It is worth mentioning that, for the linear density cases in the present work, an optimum value of peak density was attained at $12n_c$
 . The targets used in the present simulations, however, were of non-uniform densities, in contrast to those of Weng et al. (Reference Weng, Murakami, Mulser and Sheng2012) where a homogeneous plasma was considered. Consequently, the mechanism underlying the production of energetic protons in our case was different from that reported by Weng et al. (Reference Weng, Murakami, Mulser and Sheng2012). Besides, we could see that the occurrence of the shock took place at a much later time at the decreasing density region of the target which indicated that the source of the shock was not laser-based. Instead, it was the over-running of the outer ions by the inner fast-moving ions that caused the shock in our cases.
Due to the non-uniformity in the density the target heating was non-uniform, as a result, the protons attained non-uniform velocities $v_f = 2v_s + v_0$ towards the sheath field. Moreover, the propagation of the shock down the density gradient resulted in a steadily varying shock velocity. These effects added up to the total energy of the protons and as a consequence, the proton energy spectra were broadened significantly (as shown in figure 6). The highest energetic protons were thus affiliated to the combined effect of shock acceleration, TNSA and plasma expansion.
The proton energy spectra comparing different peak densities having a linear density gradient starting from the target centre at their respective saturation times.

4. Gaussian-shaped inhomogeneity
In this section, we study the role of Gaussian inhomogeneity type on the acceleration of protons, and therefore, the density profile is changed from a linear gradient to a Gaussian-shaped one with the peak density located at the centre of the plasma sphere, and the density radially dropping towards the sides following a Gaussian shape. The density equation thus becomes,

where $r$ is the distance from the centre, and $b \approx 0.425 \times$
 FWHM. As $r\rightarrow \infty$
 , $n(r)\rightarrow 0$
 , but for practical purposes and comparison with the linear density profile, $n(r)\rightarrow 0$
 as $r\rightarrow 4\ \mathrm {\mu }$
 m. This length is chosen in a way that makes the inhomogeneity FWHM ${\sim }2.5\ \mathrm {\mu }$
 m which is comparable to the scale length of the linear cases.
We consider a plasma sphere with peak density $n_p = 15n_c$ . Due to the steep density gradient at the front side, the laser quickly encountered a relativistically overdense regime. The laser pressure pushed the plasma inwards creating a density spike that was seen to form around $Z = 9.3\ \mathrm {\mu }$
 m (figure 7a) at $t\approx 220$
 fs. This curve-shaped proton-dense region travelled along $Z$
 with a velocity $0.057c$
 . Figure 7(a) shows that the radiation pressure effect of the laser pulse was felt beyond the relativistically critical density surface $Z = 8.6\ \mathrm {\mu }$
 m (where $n_p \simeq 5.1n_c$
 ). The accumulation of the protons ahead of the laser pulse was observed at $Z = 8.75\ \mathrm {\mu }$
 m. Here, the initial plasma density was $n_{p}\simeq 6.85n_c$
 . Feeding this value in the expression for hole-boring velocity, we got $v_{hb}\simeq 0.059c$
 . This value was close to the velocity of the dense concave region ${\approx }0.057c$
 thus confirming that this propagating dense region originating near the front side of the target was created due to the hole-boring mechanism of the laser. This propagating high-density region, at later times, started reflecting protons in its upstream region and these reflected protons can be seen in figure 7(b) (at 275 fs) as a dense bunch moving ahead of the high-density concave surface. The velocity of this propagating proton-dense bunch was found to be $0.106c$
 . The corresponding longitudinal momentum plots (figure 7c,d) show protons getting predominantly accelerated from the front side of the target. It is seen from figure 7(e) that the divergence angle of the emitted energetic proton beam was ${\simeq }15^{\circ }$
 which suggested that the emitted beam was considerably collimated. As the collimated proton bunch propagated beyond the central peak density region of the plasma, it came across a non-uniform plasma density due to the density ramp at the target rear. This was the reason behind the broadening of the proton spectra at the high-energy end. The quasimonoenergetic structures formed in the proton spectra at different times in figure 7(f) were due to the fairly constant velocities with which the protons travelled after getting reflected from the high-density region, before getting pulled to non-uniform velocities by the sheath field at the rear surface of the target. The protons from the central portion of the target were responsible for the appearance of these quasimonoenergetic peaks in the energy spectra. It is observed in figure 7(g) that the energy scaling law with intensity followed that of the hole-boring mechanism: $\varepsilon \sim I_L$
 (Macchi Reference Macchi2013) for the intensity range considered in our simulations.
For the target with Gaussian density profile and peak density $n_p = 15n_c$ , the proton density in the central $YZ$
 plane at (a) 220 fs and (b) 275 fs; and the longitudinal proton momentum along $Z$
 at (c) 220 fs and (d) 275 fs. The colour axis represents proton numbers in arbitrary units. Panel (e) shows the divergence of the protons (in degrees) at 275 fs. (f) Proton energy spectra at different times represented by different colours. (g) Scaling of maximum proton energy obtained using the same target with different peak laser intensities showing a linear variation, which infers the association of the hole-boring RPA. The dotted line is the linear fit for the simulated values.

5. Influence of density inhomogeneity
To study the effect of introducing a density gradient in the plasma target, we present a comparison of the results using such targets with a uniform density plasma sphere. In our cases, the density inhomogeneity gradually increased from the sides to reach a peak value at the centre. As the laser was incident on the front side of the target, a gradually increasing density profile facilitated a stronger energy conversion from the laser to the electrons (see figure 9a). A high absorption efficiency, later on, translated to higher proton energies. On the other hand, the use of uniform overdense targets caused a major portion of the laser energy to get reflected.
The presence of a decreasing density profile at the rear side had a critical role in decreasing the energy spread of the monoenergetic protons in the energy spectra at the later stages of acceleration. Figure 8(a–c) compares the longitudinal electric field between the targets having a density inhomogeneity with a uniform density target having density $12n_c$ . The uniform target was a sphere of diameter $5\ \mathrm {\mu }$
 m which was equal to the inhomogeneity scale length used in the simulations for the density gradients. The number of particles considered for the simulation of the uniform target was also kept equal to the inhomogeneous cases. It was seen that the TNSA field at the rear end of the target ($Z\sim 14\ \mathrm {\mu }$
 m) was reduced in the case of Gaussian targets. In the presence of an initial exponential scale length, the amplitude of the sheath electric field at early stages (before wave breaking) is given by $E_{\textrm {TNSA}} = {K_B T_h}/{e b}$
 (Grismayer & Mora Reference Grismayer and Mora2006). This may be the reason for the reduction in the TNSA field in comparison to a uniform plasma target observed in our simulation. Figure 8(c) shows that in the case of the Gaussian target the sheath field was characterised by a uniform plateau, which is not seen in figures 8(a) and 8(b). This uniform field accelerated protons to uniform velocities $v_0$
 (as shown in figure 7c), which limited the effects of the TNSA field on the protons reflected by the hole boring at early times. As a consequence, the energy spread of the protons reflected by the hole boring was reduced.
The longitudinal electric field in the central $YZ$ plane along $Z$
 for (a) the uniform density target with density $12n_c$
 , (b) target with linear density gradient and (c) target with Gaussian density gradient with $n_p = 12n_c$
 at time 245.6 fs.

The electron energies achieved using three different target densities are shown in figure 9(a). The target with uniform density, i.e. with abrupt vacuum–plasma interface, showed the lowest laser-to-electron energy conversion. This was consistent with the previous literature which suggested pre-plasma for an increased laser energy absorption (Andreev et al. Reference Andreev, Okada, Toraya, Nakajima and Deguchi2002; Sentoku et al. Reference Sentoku, Bychenkov, Flippo, Maksimchuk, Mima, Mourou, Sheng and Umstadter2002; Andreev et al. Reference Andreev, Platonov, Okada and Toraya2003; Kluge et al. Reference Kluge, Enghardt, Kraft, Schramm, Zeil, Cowan and Bussmann2010). It is observed from figure 9(a) that the linear density inhomogeneity had the highest values of electron energy inferring an enhanced target heating which supported the formation of shocks at later times. The shock accelerated protons, shown in figures 5(b) and 5(d), arose from the higher electron energy achieved, which heated the target efficiently. In the case of the target with Gaussian inhomogeneity, the steepness of the density gradient on the front side was greater, compared with the linear inhomogeneity. As a result absorption of laser energy became reduced thus enabling the hole-boring effect to play its role rather than the LDCSA mechanism. The blue curve in figure 9(a) signifies an intermediate electron energy in the Gaussian case supporting a reduced target heating. A strong RPA–HB was the factor behind the desirable feature of monoenergetic protons in the energy spectra at around 5 MeV (figure 9(b) (blue curve)). In addition to this, a comparatively fast-dropping density at the rear side made the sheath field contribution in the low-density region quite negligible (comparing figure 9c,d). As the proton front pushed most of the protons ahead of it to high energies, the broadening of the spectra due to the weak sheath field became limited. This was the reason behind a sharper monoenergetic peak of protons in the case of a Gaussian density gradient, compared with a linear one.
(a) The comparison between the electron energies at 190 fs for three different density types: a uniform density target (black), target with a linear density gradient (red) and target with Gaussian density gradient (blue). The linear gradient shows the highest electron energies. (b) The comparison between proton energies at time 275 fs for $n_p = 15n_c$ for the three different density profiles. The longitudinal proton momentum and distribution for $n_p = 15n_c$
 at time 275 fs for (c) the linear case and (d) the Gaussian case. The colour axis represents protons in arbitrary units. The laser intensity is $I_L = 1.37 \times 10^{20}$
 W cm$^{-2}$
 .

6. Conclusion
In this paper, we have studied the interaction mechanisms involved in the irradiation of a circularly polarized, ultrashort, intense laser with a micron-sized hydrogen sphere having a density profile radially decreasing starting at the target centre. The laser facilities around the globe produce a pre-pulse which creates a smooth density gradient inside the target. The density profile can be tailored by tuning the target density and delay between the pre-pulses and the main pulse. The comparison of different density profiles in a spherical target having dimensions of the order of the laser spot size, when heated with a pulsed femtosecond laser, is observed using 3-D PIC simulation. The proton beams are accelerated from the interaction region with the involvement of a collection of acceleration mechanisms. It is observed that the target parameters contribute collectively to generate an energetic jet of protons. The results of the reported work can be summed up in the following points:
(1) The dominant acceleration process depends on the density gradient (or the peak density at the centre). An optimum value of peak density $12n_c$
 is obtained for the linear density profile where the protons are accelerated due to the interplay of radiation pressure and LDCSA with a further contribution from the sheath electrostatic field. This optimum case of peak density is observed for the target providing intermediate opacity to the laser. The introduction of a density gradient at the target front-side results in an increased absorption which in turn enhances the proton energy.
(2) The effect of a novel Gaussian-shaped inhomogeneity on the proton acceleration is analysed and found that the sheath contribution is weaker for this profile, compared with a linear one. The increased density gradient in the front side of the Gaussian density target facilitates the hole-boring mechanism of the laser which accelerates the protons from the front side with a near-uniform velocity. For the target with density $15n_c$
the presence of a Gaussian-shaped density gradient increases the maximum proton energy from 15 MeV (in the uniform density case) to 35 MeV using a laser of peak intensity $I_L = 1.37 \times 10^{20}$ W cm$^{-2}$. It is seen that instead of a sharp TNSA field at the rear surface, which is a characteristic of a uniform target, a decaying field is formed at the expanding rear surface of the target. The retention of the monoenergetic peak in the proton spectra poses an advantage of using such targets over uniform density targets.(3) The maximum energy obtained using a Gaussian profile is almost equal to that of the linear profile; however, the monoenergetic feature of the protons is greatly enhanced in the Gaussian-shaped density profile. The proton energy scales as $\varepsilon \propto I_L$
for the Gaussian case which is a signature of the hole-boring RPA mechanism.


Thus, it is found that the proton beam properties may be tuned as per the requirements by engineering novel density profiles in the targets. By changing the density features of the target, the proton beam characteristics can be controlled accordingly. A Gaussian-shaped inhomogeneity shows a promising foundation for future studies on ion beam dynamics. A more detailed study of such Gaussian profiles is planned to be included in a future paper. Using further refinement, the present study may be used to experimentally cultivate energetic protons.
Acknowledgements
The authors acknowledge Dr K. Patel, Visiting Faculty at the Department of Physics, Centre for Excellence in Basic Sciences, Mumbai, India for the simulation code. The authors are thankful to the referees for their valuable comments and suggestions, which lead to the improvement of the quality of the manuscript.
Editor Luís O. Silva thanks the referees for their advice in evaluating this article.
Funding
This work is financially supported by the Science and Engineering Research Board (SERB), Department of Science and Technology, Government of India (Project No. CRG/2019/000380).
Declaration of interests
The authors report no conflict of interest.
Data availability
The data that support the findings of this study are available from the corresponding author upon reasonable request.
Author contribution
Both authors contributed equally to analysing data, reaching conclusions and writing the paper.



