

I. INTRODUCTION
When an energetic ion penetrates into a solid, it loses its energy mainly via two nearly independent processes, the relative magnitude of each is related to the ion velocity: (i) nuclear energy loss dominant at low energy (i.e., ∼keV/u) and due to a direct transfer of kinetic energy to the target nuclei (elastic collisions); (ii) electronic energy loss dominant at high energy (i.e., ∼MeV/u) and due to electronic excitation and/or ionization of the target atoms (inelastic collisions) which may lead to the formation of an electron cascade around the ion trajectory. The first process is known to directly generate atomic displacements leading ultimately to defect formation and structural transformations within the atomic lattice. The second process may also indirectly induce significant atomic rearrangements in the wake of swift heavy ions through energy transfer from the electron cascade to the lattice atoms. Depending on the nature of the irradiated material and the amount of electronic energy loss deposited in the wake of the swift heavy ions, this process can give rise to different types of atomic movements and structural modifications. The latter are illustrated, for instance, by: (i) the giant anisotropic deformation in amorphous solids (the so-called ion hammering effect) Reference Klaumünzer and Schumacher1–Reference Benyagoub and Klaumünzer4 ; (ii) the recovery of the defects concomitantly created by nuclear collisions in metals Reference Iwase, Sasaki and Iwata5,Reference Dunlop, Lesueur, Morillo, Dural, Spohr and Vetter6 ; (iii) the damage creation in the irradiated target independently of its original structure (either crystalline Reference Audouard, Balanzat, Bouffard, Jousset, Chamberod, Dunlop, Lesueur, Fuchs, Spohr, Vetter and Thomé7,Reference Barbu, Dunlop, Lesueur and Averback8 or amorphous Reference Klaumünzer, Schumacher, Rentzsch, Vogl, Söldner and Nieger9,Reference Audouard, Balanzat, Fuchs, Jousset, Lesueur and Thomé10 ); (iv) the occurrence of crystalline-to-crystalline phase transformations Reference Benyagoub, Levesque, Couvreur, Gibert-Mougel, Dufour and Paumier11–Reference Benyagoub13 or of amorphous-to-crystalline phase transitions. Reference Benyagoub, Audren, Thomé and Garrido14–Reference Benyagoub and Audren16
Amorphization is certainly the most investigated structural modification induced by swift heavy ions in materials. The first studies started at the end of the fifties mainly by irradiating insulators with fission fragments. Reference Young17,Reference Silk and Barnes18 The rectilinear tracks (often called latent tracks) formed by the irradiation were observed either indirectly by optical microscopy after revealing with a chemical etching (hence the term latent) Reference Young17 or directly by transmission electron microscopy (TEM). Reference Silk and Barnes18 Ion tracks are easily observable by TEM in crystalline materials because the atomic lattice within the ion track is usually highly disordered or amorphous with generally a sharp contrast between the track and the surrounding crystalline structure. Later, the availability of swift heavy-ion accelerators led to a considerable progress in the knowledge of the track morphology in crystalline materials, mainly the evolution of the track radii with the deposited electronic energy loss. Reference Studer, Hervieu, Costantini and Toulemonde19 This was also performed by making use of the small angle x-ray scattering (SAXS) and small angle neutron scattering techniques. Reference Dartyge20–Reference Albrecht, Balanzat and Schaupert22 Both methods allow to obtain the radii of latent tracks from the variation with respect to the crystalline matrix of the radial density distribution of the electrons or target nuclei within the ion track deduced from the analysis of the collected scattering data. In parallel, other studies showed the occurrence of plastic deformation in amorphous metal–metalloid alloys Reference Klaumünzer and Schumacher1–Reference Benyagoub and Klaumünzer4 and the annealing of the defects created by nuclear collisions in pure metals such as Fe and Ni. Reference Iwase, Sasaki and Iwata5,Reference Dunlop, Lesueur, Morillo, Dural, Spohr and Vetter6 The increase of ion mass and energy thanks to the development of the accelerator technology allowed to explore the effects generated by very high electronic energy losses in several materials. This led to the observation of damage in pure metals like Fe and Zr Reference Dunlop and Lesueur23 and in the crystalline Ni3B alloy. Reference Audouard, Balanzat, Bouffard, Jousset, Chamberod, Dunlop, Lesueur, Fuchs, Spohr, Vetter and Thomé7 It was also found that ion tracks can be produced in metallic materials such as crystalline NiZr2 alloy Reference Barbu, Dunlop, Lesueur and Averback8 and in some compound semiconductors such as GeS Reference Vetter, Scholz and Angert24 and InP. Reference Herre, Wesch, Wendler, Gaiduk, Komarov, Klaumünzer and Meier25,Reference Szenes, Horváth, Pécz, Pászti and Tóth26 A further increase of the electronic energy loss thanks to the use of cluster beams showed that latent tracks can also be formed in the elemental semiconductors Si Reference Canut, Bonardi, Ramos and Della-Negra27,Reference Dunlop, Jaskierowicz and Della-Negra28 and Ge. Reference Colder, Marty, Canut, Levalois, Marie, Portier, Ramos and Toulemonde29
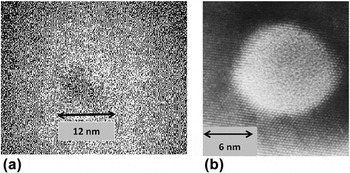
Similarly to the studies on crystalline materials, ion tracks were also evidenced by local structural modification or density change in various amorphous solids such as in metal–metalloid compounds, Reference Klaumünzer, Schumacher, Rentzsch, Vogl, Söldner and Nieger9,Reference Audouard, Balanzat, Fuchs, Jousset, Lesueur and Thomé10 vitreous SiO2, Reference Benyagoub, Löffler, Rammensee and Klaumünzer30,Reference Benyagoub, Löffler, Rammensee, Klaumünzer and Saemann-Ischenko31 amorphous Si, Reference Furuno, Otsu, Hojou and Izui32–Reference Bierschenk, Giulian, Afra, Rodriguez, Schauries, Mudie, Pakarinen, Djurabekova, Nordlund, Osmani, Medvedev, Rethfeld, Ridgway and Kluth34 and amorphous Ge. Reference Furuno, Otsu, Hojou and Izui32,Reference Wesch, Schnohr, Kluth, Hussain, Araujo, Giulian, Sprouster, Byrne and Ridgway35–Reference Ridgway, Bierschenk, Giulian, Afra, Rodriguez, Araujo, Byrne, Kirby, Pakarinen, Djurabekova, Nordlund, Schleberger, Osmani, Medvedev, Rethfeld and Kluth37 Among all these amorphous solids, vitreous silica (a-SiO2) is certainly the most investigated material for several reasons. From the fundamental point of view, a-SiO2 often serves as a model material for the glass structure and therefore the study of its response under swift heavy ions is of utmost importance in the physics of solids under intense excitations. Moreover, this material is often the major component of many inorganic glasses present in natural minerals (which can be exploited for track dating in geochronology, space science, and archaeology) and in many technologically important glasses (such as the borosilicate glasses commonly used for nuclear waste immobilization). It can also be found in many optical and electronical control and diagnostic devices working in high-radiation environments (such as in space or in fusion and fission nuclear reactors). In addition, the electronic energy threshold for track creation is relatively low in this material and is thus accessible to many accelerators. As a result, several works were devoted to the study of track formation in this material using various characterization techniques. It is found that direct observation of ion tracks in a-SiO2 by TEM is generally very difficult due to a lack of sufficient contrast between the track and the matrix. This is well illustrated with the case of the irradiation by 200 MeV Ag ions where there is no sharp interface between the ion track which is also amorphous and the surrounding material, as shown in Fig. 1(a). Reference Mohanty, Satyam, Mishra and Kanjilal38 This is obviously not the case of the irradiation of crystalline SiO2 where the transition between the amorphous ion track and the crystalline matrix is clearly well defined [see Fig. 1(b)]. Reference Meftah, Brisard, Costantini, Dooryhée, Hage-Ali, Hervieu, Stoquert, Studer and Toulemonde39 However, since ion tracks are generally characterized by an increase of disorder or density modification, several indirect methods such as dimensional changes, Reference Benyagoub, Löffler, Rammensee and Klaumünzer30,Reference Benyagoub, Löffler, Rammensee, Klaumünzer and Saemann-Ischenko31 optical absorption, Reference Busch, Slaoui, Siffert, Dooryhee and Toulemonde40–Reference Toulemonde, Weber, Li, Shutthanandan, Kluth, Yang, Wang and Zhang42 the SAXS method, Reference Kluth, Schnohr, Pakarinen, Djurabekova, Sprouster, Giulian, Ridgway, Byrne, Trautmann, Cookson, Nordlund and Toulemonde43 and the track etching technique Reference Jensen, Razpet, Skupinski and Possnert44,Reference Dallanora, Marcondes, Bermudez, Fichtner, Trautmann, Toulemonde and Papaléo45 succeeded to quantify the sensitivity of amorphous SiO2 under swift heavy-ion irradiations.
TEM observations of ion track in (a) amorphous SiO2 (Mohanty et al. Reference Mohanty, Satyam, Mishra and Kanjilal38 ) and in (b) crystalline SiO2 (Meftah et al. Reference Meftah, Brisard, Costantini, Dooryhée, Hage-Ali, Hervieu, Stoquert, Studer and Toulemonde39 ).

The literature on ion tracks in solids is abundant since their discovery and the results of several previous studies are summarized in the book of Fleischer et al. Reference Fleischer, Price and Walker46 and in that of Spohr. Reference Spohr47 Some review articles also report more recent advances either in the underlying mechanisms Reference Klaumünzer48–Reference Klaumünzer50 or in the applications of ion tracks. Reference Trautmann, Hellborg, Whitlow and Zhang51 Instead of aiming to cover this very broad field, the purpose of the present contribution is to focus specifically on the topic of ion track formation in amorphous silica. In the following, the next four sections review the different contributions of the main techniques used to characterize the formation of ion tracks in amorphous silica. Then, the results gathered by each of these techniques are compared with each other to gain a better understanding of this phenomenon. Finally, the last section before the conclusion shows that the set of experimental results obtained by these techniques and embracing a wide range of ion energy can be interpreted in the framework of a comprehensive view based on the thermal spike model.
II. SWIFT HEAVY-ION IRRADIATION INDUCED DIMENSIONAL CHANGES IN VITREOUS SILICA
Similarly to the case of other amorphous materials, vitreous silica is subject to drastic atomic movements under irradiation with swift heavy ions. It is first submitted to structural modifications during a certain incubation fluence which depends on the nature and energy of the irradiating species and then undergoes a macroscopically visible anisotropic plastic deformation. The latter consists of a steady increase with the ion fluence of the sample dimensions perpendicular to the ion-beam direction together with a decrease of the dimension parallel to it, at constant volume. It is found Reference Benyagoub, Löffler, Rammensee and Klaumünzer30,Reference Benyagoub, Löffler, Rammensee, Klaumünzer and Saemann-Ischenko31 in the case of vitreous silica that the structural changes occurring during the incubation fluence lead to an isotropic compaction of ∼3% similar to that produced by nuclear collisions. Reference Primak52
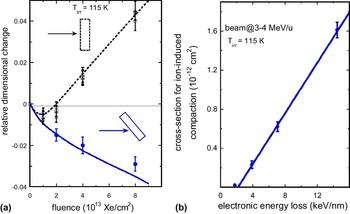
Both kinds of dimensional changes were discriminated by performing ion irradiations at different incident angles with respect to the sample surface using various beams having specific energies ∼3–4 MeV/u. Reference Benyagoub, Löffler, Rammensee and Klaumünzer30,Reference Benyagoub, Löffler, Rammensee, Klaumünzer and Saemann-Ischenko31 This is illustrated in Fig. 2(a) in the case of the irradiation of vitreous silica with 360 MeV Xe at 115 K by using two geometries: in geometry 1, both length l and width b of the samples were perpendicular to the beam direction, and in geometry 2, the samples were tilted so as the width b made an angle of 45° with the beam direction. At low fluences (<1013 Xe cm−2), there is a small shrinkage of the sample dimensions whatever the geometry used denoting an isotropic radiation-induced compaction. While at high fluences, large dimensional changes occur with sign and magnitude depending on the angle between the sample dimension under consideration and the beam: in geometry 1, both l and b grow almost linearly with the ion fluence; whereas in geometry 2, l increases but b shrinks. This behavior is in complete agreement with the angular dependence of the plastic deformation phenomenon as deduced from general symmetry considerations Reference Klaumünzer and Benyagoub53 and as observed in other amorphous materials. Reference Klaumünzer and Schumacher1–Reference Benyagoub and Klaumünzer4,Reference Klaumünzer, Schumacher, Rentzsch, Vogl, Söldner and Nieger9,Reference Audouard, Balanzat, Fuchs, Jousset, Lesueur and Thomé10,Reference Audouard, Dural, Toulemonde, Lovas, Szenes and Thomé54,Reference Audouard, Toulemonde, Szenes and Thomé55 Moreover, the study of the evolution of the compaction effect with the ion fluence allowed to deduce the cross-section for radiation-induced densification during the incubation period. As illustrated in Fig. 2(b), this cross-section was found to increase almost linearly with the deposited electronic energy loss above a threshold of 2.0 ± 0.5 keV nm−1. Concerning the anisotropic plastic deformation phenomenon, the deformation yield per incident ion was also found to increase almost linearly with the electronic energy loss above the same threshold value. Therefore, both radiation-induced densification and plastic deformation are detectable in vitreous SiO2 only above an electronic energy loss threshold equal to 2.0 ± 0.5 keV nm−1 for beam energies of ∼3–4 MeV/u. Both phenomena were explained on the basis of a combination Reference Benyagoub, Klaumünzer and Toulemonde56 of the thermoelastic model of Trinkaus and Ryazanov Reference Trinkaus and Ryazanov57 for the ion hammering effect and the fact that molten silica exhibits a density anomaly (like that of water) in the temperature range between 2000 and 5000 K. Reference Vollmayr, Kob and Binder58 In this description, plastic deformation results from the shear stress relaxation of the low viscosity molten silica generated in the wake of the irradiating ion followed by the “freezing-in” of the associated strain increment during the subsequent rapid cooling down process, whereas compaction is a remnant of the high-density liquid phase configuration persisting after the quench of the ion track.
(a) Relative dimensional change of vitreous silica samples as a function of the fluence of Xe ions at 360 MeV (Benyagoub et al. Reference Benyagoub, Löffler, Rammensee, Klaumünzer and Saemann-Ischenko31 ) under two specific irradiation geometries: the dotted line corresponds to sample dimensions perpendicular to the beam direction and the continuous line to the sample dimension making an angle of 45° with the beam direction. (b) Evolution of the cross-section for radiation-induced compaction as a function of the electronic energy loss. Reference Benyagoub, Löffler, Rammensee, Klaumünzer and Saemann-Ischenko31

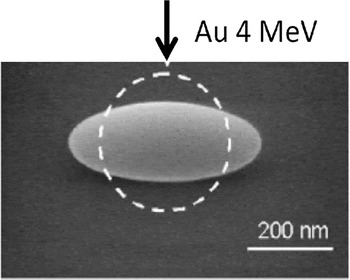
A similar anisotropic growth was also observed at a submicrometer scale by scanning electron microscopy (SEM) in silica colloids irradiated by Au ions with energies between 4 and 16 MeV. Reference van Dillen, Snoeks, Fukarek, van Kats, Velikov, van Blaaderen and Polman59 As shown in Fig. 3, this effect consists in a noticeable deformation of the colloids from spherical to ellipsoidal shape with a decrease of the dimension along the ion beam direction.
Dimensional change of an amorphous SiO2 colloid by Au irradiation at ∼0.02 MeV/u (van Dillen et al. Reference van Dillen, Snoeks, Fukarek, van Kats, Velikov, van Blaaderen and Polman59 ).

III. INFRARED SPECTROSCOPY STUDIES OF IRRADIATION EFFECTS INDUCED BY HIGH-ENERGY IONS IN AMORPHOUS SiO2
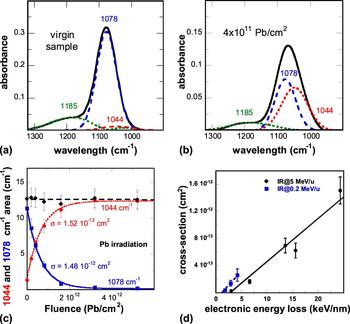
Infrared (IR) spectroscopy may provide valuable information on the microscopic structure of materials via the excitation of vibrational modes involving pairs or groups of bonded atoms by the absorption of radiation of appropriate frequency. It is widely used for the investigations of structural modifications in organic materials and is sometimes also used for the study of some inorganic solids. Figures 4(a) and 4(b) present the IR spectra recorded on amorphous SiO2 before and after irradiation with 4.6 MeV/u 208Pb ions to the fluence of 4 × 10¹¹ Pb/cm2, respectively. Reference Rotaru, Pawlak, Khalfaoui, Dufour, Perrière, Laurent, Stoquert, Lebius and Toulemonde60 The virgin spectrum exhibits mainly a large peak at about 1078 cm−1 attributed to the TO3 absorption band and a small peak at about 1185 cm−1 corresponding to the pair LO4–TO4 band. After irradiation, the IR spectrum reveals an apparent shift of the TO3 band toward lower wave numbers without a significant change of the pair LO4–TO4 band. Examination of the data showed that the evolution of the TO3 band under irradiation can be interpreted as resulting from a decrease of the initial 1078 cm−1 peak associated with the appearance of a new peak at 1044 cm−1. Reference Busch, Slaoui, Siffert, Dooryhee and Toulemonde40 This modification in the IR TO3 absorption band is attributed to a decrease of the Si–O–Si inter-tetrahedral bond angles giving then rise to the reordering of the Si–O tetrahedral network and thus to a compaction of the irradiated material. Reference Busch, Slaoui, Siffert, Dooryhee and Toulemonde40,Reference Rotaru, Pawlak, Khalfaoui, Dufour, Perrière, Laurent, Stoquert, Lebius and Toulemonde60,Reference Awazu, Ishii, Shima, Roorda and Brebner61
IR absorption spectrum of (a) a virgin sample and (b) a sample irradiated with 4 × 10¹¹ Pb/cm2 (Rotaru et al. Reference Rotaru, Pawlak, Khalfaoui, Dufour, Perrière, Laurent, Stoquert, Lebius and Toulemonde60 ); in both cases, the background is subtracted. (c) Evolution of the area of the 1078 cm−1 (in blue) and 1044 cm−1 (in red) IR bands and the sum of these two areas (in black) versus the ion fluence. Reference Rotaru, Pawlak, Khalfaoui, Dufour, Perrière, Laurent, Stoquert, Lebius and Toulemonde60 (d) Track cross-section deduced from IR measurements versus electronic energy loss (Ref. Reference Rotaru, Pawlak, Khalfaoui, Dufour, Perrière, Laurent, Stoquert, Lebius and Toulemonde60 and Toulemonde et al. Reference Toulemonde, Weber, Li, Shutthanandan, Kluth, Yang, Wang and Zhang42 ).

The fit of the peaks in the IR spectra by Gaussian curves [see Figs. 4(a) and 4(b)] allowed to separate the contribution of each peak and to follow the evolution of their areas as a function of the irradiation fluence Φ. As shown in Fig. 4(c), the evolution of the area of the 1078 cm−1 peak exhibits an exponential decrease with the ion fluence whereas that of the area of the 1044 cm−1 peak displays an exponential increase. These evolutions can thus be described by the following expressions:
 $${\rm{Y}}\left( \Phi \right) = \left[ {{\rm{Y}}\left( \infty \right) - {\rm{Y}}\left( {\rm{0}} \right)} \right] \times \left( {1 - {{\rm{e}}^{ - \sigma \times \Phi }}} \right) + {\rm{Y}}\left( {\rm{0}} \right)\quad {\rm{for}}\;{\rm{the}}\;1044\;{\rm{c}}{{\rm{m}}^{ - 1}}\;{\rm{peak}}\quad {\rm{,}}$$
 $${\rm{Z}}\left( \Phi \right) = {\rm{Z}}\left( 0 \right) \times {{\rm{e}}^{ - \sigma \times \Phi }}\quad {\rm{for}}\;{\rm{the}}\;1078\;{\rm{c}}{{\rm{m}}^{ - 1}}\;{\rm{peak}}\quad {\rm{,}}$$
where σ is the cross-section of structural modification generated in the wake of the incident ion. The fits of these equations to the experimental data are represented in Fig. 4(c) by a red dotted line for the 1044 cm−1 peak and by a solid blue line for the 1078 cm−1 peak, and lead to the same value (∼1.5 × 10⁻¹² cm2) for σ. It should be mentioned that the sum of the areas of the two absorption lines is constant [black dashed curve in Fig. 4(c)], indicating that the decrease of the 1078 cm−1 peak is compensated one to one by the increase of the 1044 cm−1 peak.
In addition to the irradiation with 208Pb ions at 4.6 MeV/u, several other irradiations Reference Rotaru, Pawlak, Khalfaoui, Dufour, Perrière, Laurent, Stoquert, Lebius and Toulemonde60 were performed with 12C at 5.5 MeV/u, 32S at 5 MeV/u, 64Ni at 5 MeV/u, 112Sn at 5.5 MeV/u, and 129Xe at 5 MeV/u. The cross-section σ was also extracted for each irradiation from the evolution of the IR peak areas with the ion fluence and all the obtained values are plotted as a function of the electronic energy loss in Fig. 4(d). It can be seen that the threshold in the electronic energy loss for structural transformations detectable by IR spectroscopy is equal to 2.4 ± 0.3 keV/nm for beam energies of ∼5 MeV/u. Other cross-sections obtained by IR spectroscopy in the case of the irradiation of a-SiO2 with 16O, 28Si, and 58Ni beams at a specific energy of 0.2 MeV/u Reference Toulemonde, Weber, Li, Shutthanandan, Kluth, Yang, Wang and Zhang42 are also plotted in Fig. 4(d). It turns out that at this specific energy the electronic energy loss threshold for damage creation is 1.4 ± 0.1 keV/nm. Such a decrease of the electronic energy loss threshold with beam energy can be accounted for by the so-called velocity effect. Reference Meftah, Brisard, Costantini, Dooryhée, Hage-Ali, Hervieu, Stoquert, Studer and Toulemonde39 This phenomenon is a direct consequence of the interaction of high-energy ions with solids. Owing to the kinematics of the ion-electron collision process, high-velocity ions transfer much more kinetic energy to the target electrons than low-velocity ions. As a result, for the same amount of electronic energy loss, high-velocity ions spread their energy into a larger volume and thus give rise to a lower deposited energy density in comparison to low-velocity ions.
IV. CHARACTERIZATION OF ION TRACKS IN AMORPHOUS SiO2 BY THE SAXS METHOD
In order to quantify the track radius without resorting to the analysis of the evolution of the amount of transformed material with the ion fluence (i.e., in the same way as for the case of the IR data in Sec. III), the SAXS technique has been used Reference Albrecht, Armbruster, Spohr, Roth, Schaupert and Stuhrmann21,Reference Albrecht, Balanzat and Schaupert22,Reference Dartyge62,Reference Schwartz, Trautmann, Steckenreiter, Geiß and Krämer63 to deduce track radii independently of the applied fluence as long as the ion tracks are well separated. This characterization method is based on the contrast in density between the ion tracks and the rest of the material. It allows the evaluation of the size of the ion tracks, their orientation and size distribution by analyzing the scattered intensity of x-rays in a small angular domain ranging from ∼0.1° to ∼0.3°. Moreover, this method can be applied not only to crystalline materials but also to amorphous materials. The interest for SAXS was recently renewed thanks to the use of the synchrotron radiation Reference Schwartz, Trautmann, Steckenreiter, Geiß and Krämer63 especially for amorphous SiO2. Reference Kluth, Schnohr, Pakarinen, Djurabekova, Sprouster, Giulian, Ridgway, Byrne, Trautmann, Cookson, Nordlund and Toulemonde43,Reference Kluth, Schnohr, Sprouster, Byrne, Cookson and Ridgway64 These investigations allowed to show a fine structure of ion tracks in this material: each track consists of a low-density cylindrical core surrounded by a high-density shell.
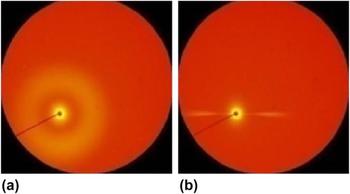
An example of SAXS images Reference Kluth, Schnohr, Sprouster, Byrne, Cookson and Ridgway64 obtained on an amorphous SiO2 sample irradiated with 89 MeV 197Au ions to the fluence of 6 × 10¹¹ ions/cm2 is given in Fig. 5, where in (a) the x-ray beam is incident perpendicularly to the sample surface (i.e., parallel to the ion beam direction) and in (b) the sample surface is tilted around the horizontal axis by 45° with respect to the x-ray beam direction. The radially symmetrical image shown in Fig. 5(a) is consistent with cylindrical ion tracks aligned normal to the sample surface; whereas the narrow horizontal streaks appearing in Fig. 5(b) result from the apparent increase of the vertical track dimension (i.e., the projection of the track length on the vertical plane normal to the x-ray beam) which leads to vanishing of the x-ray scattering in the vertical direction.
X-Y pattern of small angle x-ray scattering (Kluth et al. Reference Kluth, Schnohr, Sprouster, Byrne, Cookson and Ridgway64 ): a) the x-ray beam is parallel to the direction of the swift heavy-ion irradiation; b) the x-ray beam is at 45° to the direction of the irradiation.

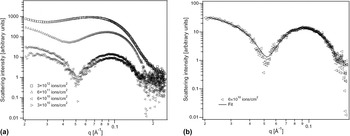
For quantitative analysis of the data, amorphous SiO2 samples were irradiated under normal incidence with different fluences of 89 MeV 197Au ions and then analyzed with the x-ray beam incident normal to the sample surface. The recorded SAXS images [such as in Fig. 5(a)] were radially integrated around the beam center and the obtained scattering spectra are shown in Fig. 6(a) for some irradiation fluences after removal of the scattering background from an unirradiated sample. It can be noticed at low fluences (3 × 10¹⁰ and 6 × 10¹⁰ ions/cm2) the presence of strong oscillations in the scattering intensities which are indicative of a narrow distribution of track sizes with well-defined boundaries and density contrast. It can also be observed that the scattering intensity scales with the ion fluence (or equivalently with the number of ion tracks) indicating that track overlap effects are negligible at these fluences. However, at high fluences (6 × 10¹¹ and 3 × 10¹² ions/cm2), due to overlap effects, the oscillations become smeared out making thus difficult a detailed analysis of the scattering patterns.
(a) SAXS spectra of irradiated amorphous SiO2 after background removal, recorded after irradiation with different fluences (Kluth et al. Reference Kluth, Schnohr, Sprouster, Byrne, Cookson and Ridgway64 ). (b) Fit of a SAXS spectrum by Eqs. (3) and (4) assuming an under-dense core and an over-dense shell. Reference Kluth, Schnohr, Sprouster, Byrne, Cookson and Ridgway64

The SAXS spectra were reproduced Reference Kluth, Schnohr, Pakarinen, Djurabekova, Sprouster, Giulian, Ridgway, Byrne, Trautmann, Cookson, Nordlund and Toulemonde43,Reference Kluth, Schnohr, Sprouster, Byrne, Cookson and Ridgway64 by assuming a cylindrically symmetrical density distribution within the ion track consistent with the formation of continuous tracks. The simplest density distribution that adequately fits the experimental data was that of a low-density cylindrical core surrounded by a high-density shell. In such geometry, the scattering amplitude can be written as Reference Guinier and Fournet65 :
 $$f\left( {{q_{\rm{r}}}} \right) = 2\pi L\left[ {\left( {{\rho _0} - {\rho _{\rm{s}}}} \right){{{r_{\rm{c}}}} \over {{q_{\rm{r}}}}}{J_1}\left( {{r_{\rm{c}}}{q_{\rm{r}}}} \right) + {\rho _{\rm{s}}}{{{r_{\rm{c}}} + {t_{\rm{s}}}} \over {{q_{\rm{r}}}}}{J_1}\left( {\left( {{r_{\rm{c}}} + {t_{\rm{s}}}} \right) {{q_{\rm{r}}}} \right)} \right} \right]\quad ,$$
where L is the track length, ρ0 is the density contrast in the core, ρs is the density contrast in the shell, r c is the core diameter, t s is the shell thickness, and J 1 is the first-order Bessel function of the first kind. The scattering intensity can then be written as:
 $$I\left( {{q_{\rm{r}}}} \right) \propto \int \mathop \smallint \nolimits {1 \over {\sqrt {2\pi \sigma } }}{\left| {f\left( {{q_{\rm{r}}}} \right)} \right|^2}{{\rm{e}}^{ - {{{{\left( {{r_{\rm{c}}} - {R_{\rm{c}}}} \right)}^2}} \over {2{\sigma ^2}}}}}{\rm{d}}{r_{\rm{c}}}\quad ,$$
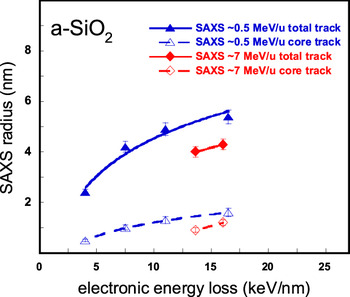
assuming a narrow Gaussian distribution of track core radii with a mean value of R c. Figure 6(b) shows the scattering intensity of the sample irradiated with 6 × 10¹⁰ Au/cm2 and the corresponding fit with Eqs. (3) and (4) indicating a very good agreement. The refined track dimensions yield a core radius R c = 1.3 ± 0.1 nm and a shell thickness of R s = 3.6 ± 0.1 nm, and thus a total track radius of R = 4.9 ± 0.2 nm. Reference Kluth, Schnohr, Pakarinen, Djurabekova, Sprouster, Giulian, Ridgway, Byrne, Trautmann, Cookson, Nordlund and Toulemonde43 Therefore, it appears that a major contribution of the SAXS method is the detection of a fine structure of ion tracks in amorphous SiO2 consisting of a low-density cylindrical core surrounded by a high-density shell. Other irradiations Reference Kluth, Schnohr, Pakarinen, Djurabekova, Sprouster, Giulian, Ridgway, Byrne, Trautmann, Cookson, Nordlund and Toulemonde43 involving 27.4, 54, and 185 MeV 197Au ions as well as 644 and 1430 MeV 129Xe ions were performed and the collected track radii, both the total track R and the core track R c, are reported in Fig. 7 as a function of the electronic energy loss. Both radii increase with the electronic energy loss and it can also be seen that for a similar electronic energy loss, the radii obtained with Au ions are larger than those found with Xe ions, in agreement with the velocity effect.
Total track and core track radii deduced from SAXS experiments (Kluth et al. Reference Kluth, Schnohr, Pakarinen, Djurabekova, Sprouster, Giulian, Ridgway, Byrne, Trautmann, Cookson, Nordlund and Toulemonde43 ) versus electronic energy loss (the lines are there to guide the eyes).

V. THE CHEMICAL ETCHING OF ION TRACKS IN AMORPHOUS SiO2
The chemical etching method has been widely used since long time Reference Young17 for revealing ion tracks created by the electronic slowing down of ions in various materials. Reference Fleischer, Price and Walker46,Reference Spohr47 It was first used for the case of vitreous silica by Fleischer and Price Reference Fleischer and Price66 and was then studied in detail by several groups. Reference Jensen, Razpet, Skupinski and Possnert44,Reference Dallanora, Marcondes, Bermudez, Fichtner, Trautmann, Toulemonde and Papaléo45,Reference Sigrist and Balzer67–Reference Bergamini, Bianconi, Cristiani, Gallerani, Nubile, Petrini and Sugliani70 This method takes advantage of a significant increase of the etching rate within the ion tracks (v t) in comparison to that of the surrounding bulk material (v b) which may give rise to the creation of holes in the irradiated material. Track revealing depends critically on the etching conditions such as the nature of the etch medium, the temperature, and the duration of the chemical attack. Reference Sigrist and Balzer67 Moreover, the aspect ratio of the revealed hole is directly related to the ratio (v t/v b) between the track and the bulk etching velocities. More precisely, the cone opening half-angle is equal to sin−1(v b/v t). Reference Spohr47 The effect of the (v t/v b) ratio on the opening angle of the etched tracks is well documented in the case of amorphous silica: for instance, in a bath of dilute hydrofluoric acid (HF) in water at 40 °C a conical hole is created along the ion track with a half-angle around 20° due to a small (v t/v b) ratio (∼3), Reference Rotaru68 while with HF vapor also at 40 °C a practically cylindrical hole is revealed due to a (v t/v b) ratio larger than 15. Reference Bergamini, Bianconi, Cristiani, Gallerani, Nubile, Petrini and Sugliani70
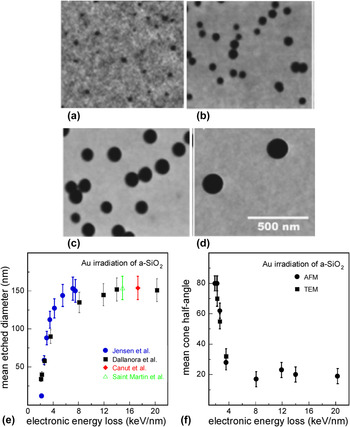
To evaluate the efficiency of track revealing by chemical etching as a function of the deposited electronic energy loss, several irradiations were performed by Dallanora et al. Reference Dallanora, Marcondes, Bermudez, Fichtner, Trautmann, Toulemonde and Papaléo45 with Au beams between 1 and 2200 MeV. The etching conditions were a bath of 4% aqueous HF solution at room temperatures (20–24 °C) for a time t e = 5 min and the etched surfaces were observed by atomic force microscopy (AFM) under ambient conditions. Typical examples of AFM images obtained in the case of the irradiations with 5, 10, 20, and 50 MeV Au beams Reference Dallanora, Marcondes, Bermudez, Fichtner, Trautmann, Toulemonde and Papaléo45 are presented in Figs. 8(a)–8(d), respectively, showing the evolution of the hole size of the etched tracks with the beam energy. The calculated mean value of the measured hole diameters is plotted as a function of the deposited electronic energy loss in Fig. 8(e). A similar study was also previously performed by Jensen et al. Reference Jensen, Razpet, Skupinski and Possnert44 using samples irradiated by Au beams with energy between 0.02 and 1 MeV/u and observed by SEM after etching in 4.8% aqueous HF at room temperature for t e = 7 min. The mean diameters measured by Jensen et al. Reference Jensen, Razpet, Skupinski and Possnert44 are also incorporated in Fig. 8(e) for comparison, after normalization to an etching time t e = 5 min and to a 4% HF etching solution. Canut et al. Reference Canut, Blanchin, Ramos-Canut, Teodorescu and Toulemonde69 also examined by AFM the chemical etching of amorphous SiO2 thermally grown on Si substrates and irradiated with an Au beam of 200 MeV. Using a 1% HF solution for a time t e of 6 min, the measured mean diameter was 46 ± 5 nm. Normalized to the etching conditions of Dallanora et al. (4% HF solution and t e = 5 min) the mean diameter is expected to be equal to 153 ± 17 nm and is added to Fig. 8(e). A similar study was also carried by Saint Martin et al. Reference Saint Martin, Bernaola, García Bermúdez and Behar71 using TEM and an Au beam of 118 MeV. A normalization of their result to the etching conditions of Dallanora et al. provides a mean diameter of 154 ± 20 nm which is also included in Fig. 8(e). It is worth noting that all the collected data fall within a single curve in the figure, indicating a quite good agreement between the different experiments. A linear extrapolation down to zero diameter of the data points obtained with electronic energy losses less than 3 keV/nm gives an etching threshold of 1.5 ± 0.1 keV/nm. Above this threshold, the diameter of the etched tracks increases rapidly with the electronic energy loss up to about 5 keV/nm and then saturates at higher electronic energy losses.
Series of AFM images showing etched amorphous SiO2 surfaces after irradiation with Au ions of (a) 5, (b) 10, (c) 20, and (d) 50 MeV at the fluences of ∼5 × 10⁹, ∼3 × 10⁹, ∼2 × 10⁹, and 2 × 10⁸ Au/cm2, respectively (images from Dallanora et al. Reference Dallanora, Marcondes, Bermudez, Fichtner, Trautmann, Toulemonde and Papaléo45 ). The scale is the same for all the images (leading to a surface of ∼0.8 µm2) and the black spots correspond to the holes resulting from the chemical etching. (e) Evolution of the etched-track diameter with the electronic energy loss (data from Refs. Reference Jensen, Razpet, Skupinski and Possnert44, Reference Dallanora, Marcondes, Bermudez, Fichtner, Trautmann, Toulemonde and Papaléo45, Reference Canut, Blanchin, Ramos-Canut, Teodorescu and Toulemonde69, and Reference Saint Martin, Bernaola, García Bermúdez and Behar71). (f) Mean cone half-angle of the etched tracks as a function of the electronic energy loss. Reference Dallanora, Marcondes, Bermudez, Fichtner, Trautmann, Toulemonde and Papaléo45

Dallanora et al. Reference Dallanora, Marcondes, Bermudez, Fichtner, Trautmann, Toulemonde and Papaléo45 also measured the cone opening angle of the etched tracks either by AFM profilometry or by TEM in cross section. The obtained mean values of the cone half-angles of the pores are plotted as a function of the electronic energy loss in Fig. 8(f). It appears that at low electronic energy loss just above the etchability threshold, wide pores with large angles (near 80°) are observed, indicating that the corresponding etching velocity in the track is close to that of the bulk. This is a signature of a low density of defects along the ion track. Reference Fleischer, Price and Walker46,Reference Spohr47,Reference Dartyge, Duraud, Langevin and Maurette72 The cone half-angle decreases rapidly within a transition region between 2 and 4 keV/nm and then stabilizes at around 20° for electronic energy losses larger than 4 keV/nm [see Fig. 8(f)]. This effect suggests that a continuous track of critical damage is created along the ion trajectory only when the deposited electronic energy is higher than 4 keV/nm. This result is in agreement with the threshold obtained for creating continuous etchable latent nuclear tracks in vitreous silica in previous fission fragment studies. Reference Fleischer, Price and Walker46
Another interest of the etching method is that it can be used to estimate the radii of latent tracks by extrapolation to time zero of the measured radii of the etched holes as a function of the etching time. This procedure was used for the case of the irradiation of amorphous silica with 200 MeV Au ions (leading to an electronic energy loss of 17.3 keV/nm) Reference Canut, Blanchin, Ramos-Canut, Teodorescu and Toulemonde69 and also with 118 MeV Au ions (giving rise to an electronic energy loss of 14.9 keV/nm). Reference Saint Martin, Bernaola, García Bermúdez and Behar71 It allowed to deduce in both cases a latent track radius of 5 ± 1 nm. These results are in agreement with the total track radii measured by small angle x-ray scattering Reference Kluth, Schnohr, Pakarinen, Djurabekova, Sprouster, Giulian, Ridgway, Byrne, Trautmann, Cookson, Nordlund and Toulemonde43 at similar electronic energy losses (see Fig. 7), indicating that chemical etching may be a good alternative to evaluate the size of latent tracks especially in the regime of high electronic energy loss (>4 keV/nm) where tracks consist of continuously damaged cylindrical regions.
VI. COMPARISON OF THE RESULTS COLLECTED BY THE DIFFERENT CHARACTERIZATION TECHNIQUES
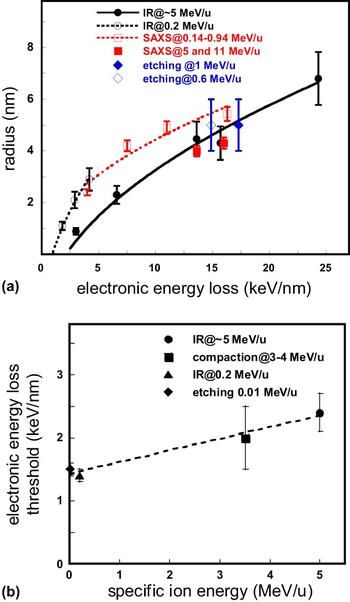
The total track radii obtained from the SAXS analyses as well as the track radii R deduced from IR cross-sections σ, assuming a cylindrical geometry around the ion trajectory (σ = πR 2) are plotted as a function of the electronic energy loss in Fig. 9(a) for different specific beam energies. The IR spectroscopy data show that below ∼5 keV/nm track radii generated by 16O, 28Si, and 58Ni ions with 0.2 MeV/u are larger than those produced by 32S ions with 5 MeV/u. Similarly, within the 11–17 keV/nm electronic energy loss region, SAXS data obtained with Au ions at ∼0.4–0.9 MeV/u are greater than those created by 5 or 11 MeV/u Xe ions. Both facts are a signature of the velocity effect.
(a) Comparison of the evolution of the track radii deduced from IR spectroscopy Reference Toulemonde, Weber, Li, Shutthanandan, Kluth, Yang, Wang and Zhang42,Reference Rotaru, Pawlak, Khalfaoui, Dufour, Perrière, Laurent, Stoquert, Lebius and Toulemonde60 and SAXS analyses Reference Kluth, Schnohr, Pakarinen, Djurabekova, Sprouster, Giulian, Ridgway, Byrne, Trautmann, Cookson, Nordlund and Toulemonde43 as a function of the electronic energy loss for different specific beam energies. The track radii extrapolated from the etching experiments Reference Canut, Blanchin, Ramos-Canut, Teodorescu and Toulemonde69,Reference Saint Martin, Bernaola, García Bermúdez and Behar71 are also added to the plot for comparison. (b) Evolution of the electronic energy threshold for damage creation Reference Benyagoub, Löffler, Rammensee, Klaumünzer and Saemann-Ischenko31,Reference Toulemonde, Weber, Li, Shutthanandan, Kluth, Yang, Wang and Zhang42,Reference Jensen, Razpet, Skupinski and Possnert44,Reference Dallanora, Marcondes, Bermudez, Fichtner, Trautmann, Toulemonde and Papaléo45,Reference Rotaru, Pawlak, Khalfaoui, Dufour, Perrière, Laurent, Stoquert, Lebius and Toulemonde60 with the specific energy. The lines are there to guide the eyes.

It can also be noticed in Fig. 9(a) that the SAXS radii obtained with Au ions between 0.14 and 0.94 MeV/u practically merge at about 4 keV/nm with the IR data produced by 0.2 MeV/u ions indicating a good agreement between the two characterization techniques. This agreement is also confirmed by the fact that the track radius obtained by the SAXS method for the irradiation with 5 MeV/u 129Xe ions and giving rise to an electronic energy loss ∼16 keV/nm is quite close to that determined by IR spectroscopy for the irradiation with the same ion species at the same specific energy. The track radii extrapolated from the etching experiments for the irradiations performed with 200 and 118 MeV Au ions Reference Canut, Blanchin, Ramos-Canut, Teodorescu and Toulemonde69,Reference Saint Martin, Bernaola, García Bermúdez and Behar71 are also included in Fig. 9(a) and are, within the experimental errors, in fair agreement with those obtained by the other characterization methods.
The onset of damage creation by electronic energy loss in amorphous silica detected by different techniques is plotted in Fig. 9(b) as a function of the specific ion energy. The threshold deduced from IR spectroscopy measurements is 1.4 ± 0.1 keV/nm for a specific energy of 0.2 MeV/u and increases to 2.4 ± 0.3 keV/nm for specific energies ∼5 MeV/u. This behavior is in conformity with the velocity effect which predicts that the radial distribution of the deposited electronic energy density is less peaked at higher specific energy, requiring thus a larger amount of electronic energy loss to reach the same critical level of deposited energy density around the ion trajectory. Regarding chemical etching, it starts at 1.5 ± 0.1 keV/nm with Au ions of ∼0.01 MeV/u specific energy and becomes fully operative only above ∼4 keV/nm corresponding to Au beams of ∼0.14 MeV/u. In analogy to the evolution of the ion track morphology with the electronic energy loss studied in the case of the irradiation of Y3Fe5O12, Reference Houpert, Studer, Groult and Toulemonde73 the onset of etching at ∼1.5 keV/nm can be associated with the formation of isolated spherical damaged regions, whereas the threshold value of ∼4 keV/nm observed for efficient chemical etching is related to the formation of a continuously damaged cylindrical track along the ion trajectory. The intermediate threshold value of 2.0 ± 0.5 keV/nm obtained from dimensional change measurements may thus be understood as resulting from the transition of the damaged regions from spherical to elongated ellipsoidal geometry, in agreement with the need of an anisotropic symmetry in the thermo-elastic inclusion model proposed by Trinkaus and Ryazanov Reference Trinkaus and Ryazanov57 to explain the ion hammering effect.
VII. COOPERATIVE EFFECT BETWEEN ELECTRONIC AND NUCLEAR ENERGY LOSSES
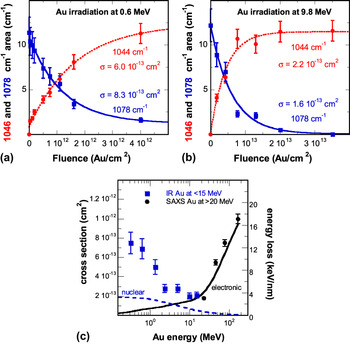
To study the behavior of amorphous SiO2 in a slowing down regime where nuclear energy loss is of the same order of magnitude as the electronic energy loss, irradiations were performed with Au ions in an energy range from 0.3 to 15 MeV. Reference Toulemonde, Weber, Li, Shutthanandan, Kluth, Yang, Wang and Zhang42 In this regime of Au beam energy, the decrease of the nuclear energy loss with the ion energy is nearly compensated by the increase of electronic energy loss, leading to a rather constant total energy loss. The modifications brought to thin (104 nm) amorphous silica films, thermally grown on crystalline Si substrates, were characterized by IR spectroscopy, Reference Toulemonde, Weber, Li, Shutthanandan, Kluth, Yang, Wang and Zhang42 in a similar fashion to the investigations carried out in the high-energy regime (see Sec. III). The areas of the 1078 and 1044 cm−1 IR absorption bands were determined by Gaussian fits and the obtained results were plotted as a function of the ion fluence, as illustrated in Figs. 10(a) and 10(b) by the cases of the irradiations with 0.6 and 9.8 MeV ions, respectively. The evolutions of the peak areas with the ion fluence were fitted by Eqs. (1) and (2), and the deduced cross-sections for damage creation are drawn versus Au beam energy in Fig. 10(c). It appears that below ∼2 MeV Au energy, damage is essentially correlated with the nuclear energy loss: it is more pronounced at high nuclear energy loss and decreases with decreasing nuclear energy loss. This result is in agreement with the known fact that nuclear collisions induce damage in vitreous silica. Reference Primak52,Reference Devine74 The SAXS data obtained with Au irradiations between 27.4 and 185 MeV are also added to Fig. 10(c) for comparison. The whole data set shows that damage passes through a minimum before increasing again with the electronic energy loss, exhibiting thus a U-shaped dependence on the incident Au energy. It appears that in the intermediate region between ∼2 and ∼20 MeV, both slowing down processes contribute appreciably but to different degrees to damage formation.
Evolution of the 1044 (dotted line) and 1078 cm−1 (solid line) absorption bands as a function of the fluence for Au irradiations at (a) 0.6 and (b) 9.8 MeV. Reference Toulemonde, Weber, Li, Shutthanandan, Kluth, Yang, Wang and Zhang42 (c) The deduced cross-sections as well as the data obtained by SAXS measurements Reference Kluth, Schnohr, Pakarinen, Djurabekova, Sprouster, Giulian, Ridgway, Byrne, Trautmann, Cookson, Nordlund and Toulemonde43 are plotted versus Au energy (the dotted curve describes the evolution of the nuclear energy loss whereas the solid curve represents the evolution of the electronic energy loss).

VIII. DESCRIPTION OF THE EXPERIMENTAL RESULTS BY A TRANSIENT THERMAL PROCESS
A. Tracks in the electronic energy loss regime and the inelastic thermal spike model
The inelastic thermal spike (i-TS) model explains how the energy lost by the slowing down of a heavy ion is shared with the lattice atoms through electron–electron interactions followed by electron–atom interactions quantified by the electron–phonon coupling. This model describes the transient thermal process by coupling the heat transport equations of the electron and atomic systems and gives the evolution of their temperatures with space and time by assuming a cylindrical geometry around the ion trajectory Reference Dufour, Audouard, Beuneu, Dural, Girard, Hairie, Levalois, Paumier and Toulemonde75 :
 $${C_{\rm{e}}}\left( {{T_{\rm{e}}}} \right){{\partial {T_{\rm{e}}}} \over {\partial t}} = {1 \over r}{\partial \over {\partial r}}\left[ {r{K_{\rm{e}}}\left( {{T_{\rm{e}}}} \right){{\partial {T_{\rm{e}}}} \over {\partial r}}} \right] - g\left( {{T_{\rm{e}}} - {T_{\rm{a}}}} \right) + A\left( {r,\,v,\,t} \right)\quad ,$$
 $${C_{\rm{a}}}\left( {{T_{\rm{a}}}} \right){{\partial {T_{\rm{a}}}} \over {\partial t}} = {1 \over r}{\partial \over {\partial r}}\left[ {r{K_{\rm{a}}}\left( {{T_{\rm{a}}}} \right){{\partial {T_{\rm{a}}}} \over {\partial r}}} \right] + g\left( {{T_{\rm{e}}} - {T_{\rm{a}}}} \right)\quad ,$$
where C e, C a; K e, K a; and T e, T a are the specific heat; thermal conductivity; and temperature of the electronic system and lattice atoms, respectively, g is the electron–phonon coupling constant, A(r, v, t) is the energy acquired by the electrons after the passage of the ion of velocity v, r is the radial distance from the ion path, and t is the time. The coupling constant g is linked to the electron–phonon mean free path λ by the following relation λ2 = K e/g. Reference Toulemonde, Dufour, Meftah and Paumier76
The initial energy distribution on the electrons A(r, v, t) which depends on the ion velocity (v), is deduced from Monte-Carlo calculations Reference Waligorski, Hamm and Katz77 that compute numerically the development of the electron cascades. It is assumed that the total deposited energy obtained by integration of A(r, v, t) over time and space should be equal to the corresponding electronic energy loss. The transfer of energy to the lattice atoms leads to the formation of a high-temperature cylinder along the ion path which can reach the molten phase (and even the boiling phase). In the framework of this model, the latent track is assumed to result from the rapid quenching of the entire cylinder of the molten matter. This model has been widely used to describe the evolution of track radii with the deposited electronic energy loss in various metallic and insulator materials (see, e.g., Refs. Reference Toulemonde, Dufour, Meftah and Paumier76 and Reference Toulemonde, Assmann, Dufour, Meftah and Trautmann78).
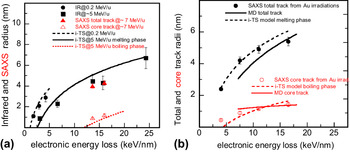
For the case of amorphous silica, the i-TS model was first applied to the track radii obtained from IR spectroscopy measurements of the irradiations with ∼5 MeV/u ions Reference Rotaru, Pawlak, Khalfaoui, Dufour, Perrière, Laurent, Stoquert, Lebius and Toulemonde60 in order to determine the value of the electron–phonon mean free path λ. The latter was deduced by fitting the track radii using known thermodynamic parameters of the lattice and the best fit of the data was obtained with λ = 3 nm. As expected for an amorphous material, this λ value is smaller than that needed to fit the track radii in crystalline quartz. Reference Toulemonde, Costantini, Dufour, Meftah, Paumier and Studer79 The evolution as a function of the energy loss of the track radii deduced from the i-TS model with λ = 3 nm is plotted as a solid line in Fig. 11(a) for a beam energy of 5 MeV/u. It shows a quite good agreement with the experimental radii and provides an electronic energy loss threshold of 2.5 keV/nm quite close to the experimental value (2.4 ± 0.3 keV/nm). Moreover, in the same energy regime, the i-TS model also reproduced the appearance of a core track (as deduced from the SAXS measurements) if one assumes that it comes from the quench of a boiling phase [dotted curve in Fig. 11(a)]. The model was extrapolated to the track radii created by ion beams of 0.2 MeV/u [dashed curve in Fig. 11(a)] and gives an electronic energy loss threshold of 1 keV/nm in fair agreement with the corresponding experimental value of 1.4 ± 0.1 keV/nm. The i-TS model also reproduced the evolution of the total and core track radii [dashed curves in Fig. 11(b)] deduced from the SAXS analyses of the Au irradiations between 27.4 and 185 MeV Reference Kluth, Schnohr, Pakarinen, Djurabekova, Sprouster, Giulian, Ridgway, Byrne, Trautmann, Cookson, Nordlund and Toulemonde43 in the electronic energy loss range between 4 and 16.2 keV/nm. These results were corroborated by molecular dynamic simulations Reference Kluth, Schnohr, Pakarinen, Djurabekova, Sprouster, Giulian, Ridgway, Byrne, Trautmann, Cookson, Nordlund and Toulemonde43 using an initial energy distribution on the atoms provided by the i-TS model and giving rise to a similar core–shell track structure [solid curves in Fig. 11(b)].
(a) Comparison of the measured tracks with the i-TS model for two beam energies of 0.2 and ∼5 MeV/u assuming that these tracks result from the quenching of a molten phase created along the ion trajectory. The smaller track radii around 15 keV/nm correspond to the appearance of a boiling phase and are found to match with the size of the under-dense core track. (b) Description of the SAXS core and total tracks for the Au irradiations between 27.4 and 185 MeV by the i-TS model and by molecular dynamics calculations (Kluth et al. Reference Kluth, Schnohr, Pakarinen, Djurabekova, Sprouster, Giulian, Ridgway, Byrne, Trautmann, Cookson, Nordlund and Toulemonde43 ).

B. Extension of the transient thermal process to the nuclear energy loss regime: the unified thermal spike (u-TS) model
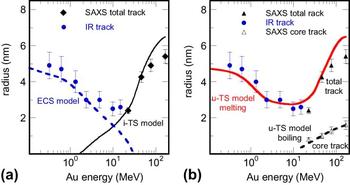
Although the i-TS model is well adapted to describe track formation at high energy, it cannot explain damage creation by Au beams below ∼2 MeV [solid curve in Fig. 12(a)]. Reference Toulemonde, Weber, Li, Shutthanandan, Kluth, Yang, Wang and Zhang42 In this nuclear collision regime, damage cross-section calculations Reference Toulemonde, Weber, Li, Shutthanandan, Kluth, Yang, Wang and Zhang42 deduced from the Stopping and Range of Ions in Matter (SRIM) code Reference Ziegler, Biersack and Littmark80 cannot account for the observed damage. However, the elastic collision spike (ECS) model, Reference Sigmund and Claussen81 which is a transient thermal process in the nuclear energy loss regime, allowed to estimate the increase of temperature around the ion path. In this model, only the lattice heat equation [Eq. (6)] is considered and the coupling term g(T e−T a) is replaced by the nuclear energy density B(r, t) whose evaluation is explained in detail in Ref. Reference Toulemonde, Weber, Li, Shutthanandan, Kluth, Yang, Wang and Zhang42. The radii where amorphous silica reaches the molten phase are drawn as a dashed line in Fig. 12(a) and compare rather well with the experimental radii for Au beam energies less than 3 MeV.
(a) Track radii versus beam energy compared to the inelastic thermal spike (i-TS) model calculations for pure electronic energy loss (solid black line) and to the ECS model for pure nuclear energy loss (dashed blue line). Reference Toulemonde, Weber, Li, Shutthanandan, Kluth, Yang, Wang and Zhang42 (b) Track radii described by the unified thermal spike model (u-TS), Reference Toulemonde, Weber, Li, Shutthanandan, Kluth, Yang, Wang and Zhang42 a combination of the i-TS and ECS models. Total track results from the quenching of the molten phase and core track from the quenching of the boiling phase.

In the intermediate energy regime of the Au beam between ∼3 and ∼20 MeV, both contributions of the two energy depositions (nuclear and electronic) have to be considered in the coupled heat transfer, Eqs. (5) and (6), leading to a unified thermal spike (u-TS) model. Reference Toulemonde, Weber, Li, Shutthanandan, Kluth, Yang, Wang and Zhang42 However, if at low ion energies the nuclear energy loss is well predicted by the SRIM code, the electronic energy loss can be overestimated by a factor of 2 Reference Sigmund82,Reference Jin, Zhang, Zhu, Grove, Xue, Xue and Weber83 in the case of the slowing down of heavy ions (such as Au) in targets made of light elements (such as SiO2). For this reason, in the case of lack of experimental data, Sigmund Reference Sigmund82 recommends to calculate the electronic energy loss from the inverted ion-target system by applying the principle of reciprocity. The latter is based on the invariance of the inelastic excitation in ion-atom collisions against interchange of projectile and target. Using this approach for the calculation of the electronic energy loss at low beam energies within the unified thermal spike model, it becomes possible to fully describe the experimental data, Reference Toulemonde, Weber, Li, Shutthanandan, Kluth, Yang, Wang and Zhang42 and particularly, to reproduce the U-shaped evolution of track radii with ion energy [solid curve in Fig. 12(b)]. Moreover, it appears that the core track data are better reproduced by the u-TS model [dashed curve in Fig. 12(b)] than by using the i-TS model alone [see Fig. 11(b)].
IX. CONCLUSION
Investigations of the structural modifications induced in amorphous SiO2 by ion irradiations in a wide energy range (between ∼1 MeV and ∼1 GeV) have been reviewed. Several characterization methods such as IR spectroscopy, chemical etching, dimensional measurements, and small angle x-ray scattering have been used to measure the generated damage and to study its evolution with the energy deposited by the irradiating species. The obtained results show that high-energy ions lead to track formation above an electronic energy loss threshold depending on the specific energy. For instance, the threshold obtained by IR spectroscopy is found to be ∼1.4 keV/nm for a specific energy of 0.2 MeV/u and increases to ∼2.4 keV/nm for beam energies ∼5 MeV/u. This behavior is in agreement with the velocity effect which predicts a more confined deposited electronic energy distribution with low-energy ions than with high-energy ions. It is also observed that track etching starts at ∼1.5 keV/nm (for Au ions of ∼0.01 MeV/u) and becomes fully operative above ∼4 keV/nm (for Au ions of ∼0.14 MeV/u). The first value corresponds to the appearance of small isolated isotropic damaged regions while the second one is related to the formation of continuously damaged cylindrical tracks. Above their respective threshold depending on the ion velocity, track sizes are found to increase approximately with the square root of the electronic energy loss. However, for Au irradiations between 0.3 and ∼30 MeV, a U-shaped evolution of the track radii versus beam energy is clearly observed, suggesting strongly a combined effect of the nuclear and electronic energy losses in this energy range. A unified thermal spike model taking into account the contributions of both energy losses allows to describe the experimental data, including the U-shaped region and the core–shell structure of the formed ion tracks.
Last but not least, the considerable knowledge gathered about the behavior of amorphous silica under swift heavy ions led to several developments in other fields. For instance, contact-angle studies of liquid droplets on amorphous SiO2 surfaces decorated by etched ion tracks—which are not easy to obtain by other techniques at such a small size—showed very interesting wetting properties Reference Ramos, Charlaix, Benyagoub and Toulemonde84 such as superoleophobic behavior Reference Ramos, Benyagoub, Canut and Jamois85 which could be of interest for the preparation of self-cleaning materials. Furthermore, the etching of ion tracks can also be used for making channels in SiO2 layers on silicon which can be filled by nanocrystallites of metals Reference Milanez Silva, Varisco, Moehlecke, Fichtner, Papaléo and Eriksson86 or transparent conductive oxides. Reference Canut, Blanchin, Ramos-Canut, Teodorescu and Toulemonde69 Another interesting utilization concerns the property of the ion hammering effect to manipulate matter at the nanometer scale: an assembly of spherical amorphous SiO2 nanoparticles can be deformed in a controlled manner by ion beams in order to construct a photonic crystal with tunable optical properties. Reference Velikov, van Dillen, Polman and van Blaaderen87 Similarly, the elongation along the incident-beam direction of metallic nanoparticles embedded in amorphous silica Reference D’Orléans, Stoquert, Estournès, Cerruti, Grob, Guille, Haas, Muller and Richard-Plouet88 can lead to the formation of ellipsoids or nanorods which can have interesting plasmonic properties. Reference Rizza89 All these applications show that high-energy ion beams can be a fascinating tool to transform matter at the nanometer scale.
ACKNOWLEDGMENT
This synthesis would not be possible without the work done by the authors of the cited papers. Most of them result from intense collaborations. They are all very deeply acknowledged.