


1. Introduction
The Triassic–Jurassic (T–J) boundary is associated with a one of the five largest mass extinction events in the Phanerozoic, and appears to coincide with volcanism of the Central Atlantic Magmatic Province (CAMP) (Pálfy, Reference Pálfy, Hames, McHone, Renne and Ruppel2003; Marzoli et al. Reference Marzoli, Bertrand, Knight, Cirilli, Buratti, Verati, Nomade, Renne, Youbi, Martini, Allenbach, Neuwerth, Rapaille, Zaninetti and Bellieni2004; Tanner, Lucas & Chapman, Reference Tanner, Lucas and Chapman2004; Cirilli et al. Reference Cirilli, Marzoli, Tanner, Bertrand, Buratti, Jourdan, Bellieni, Kontak and Renne2009). Emplacement of the GSSP for the base of the Hettangian and hence the T–J boundary at the first occurrence of the ammonite Psiloceras spelae in the Kuhjoch section in Austria (Hillebrandt et al. Reference Hillebrandt, Krystyn, Kürschner, Bown, McRoberts, Uhl, Simms, Tomasovych and Ulrichs2007) was accepted by votes within the Triassic–Jurassic Boundary Working Group and the International Subcommission on Jurassic Stratigraphy (Morton, Reference Morton2008a, Reference Mortonb; Morton, Warrington & Bloos, Reference Morton, Warrington and Bloos2008) and finally (16 April 2010) ratified by the Executive Committee of the International Union of Geological Sciences. At Kuhjoch, the first occurrence of Psiloceras spelae is found ~ 6 m above a negative carbon isotope excursion and is also associated with palynofloral turnover observed at Kuhjoch and in adjacent sections (Bonis, Kürschner & Krystyn, Reference Bonis, Kürschner and Krystyn2009). Study of the T–J transition has gained considerable impetus in recent years (e.g. McElwain, Beerling & Woodward, Reference McElwain, Beerling and Woodward1999; McElwain et al. Reference McElwain, Popa, Hesselbo, Haworth and Surlyk2007; Olsen et al. Reference Olsen, Kent, Sues, Koeberl, Huber, Montanari, Rainforth, Fowell, Szajna and Hartline2002; Hesselbo et al. Reference Hesselbo, Robinson, Surlyk and Piasecki2002; Hesselbo, Robinson & Surlyk, Reference Hesselbo, Robinson and Surlyk2004; Hesselbo, McRoberts & Pálfy, Reference Hesselbo, McRoberts and Pálfy2007; Hounslow, Posen & Warrington, Reference Hounslow, Posen and Warrington2004; Guex et al. Reference Guex, Bartolini, Atudorei and Taylor2004; Marzoli et al. Reference Marzoli, Bertrand, Knight, Cirilli, Buratti, Verati, Nomade, Renne, Youbi, Martini, Allenbach, Neuwerth, Rapaille, Zaninetti and Bellieni2004; Galli et al. Reference Galli, Jadoul, Bernasconi and Weissert2005; Cirilli et al. Reference Cirilli, Marzoli, Tanner, Bertrand, Buratti, Jourdan, Bellieni, Kontak and Renne2009; Muttoni et al. Reference Muttoni, Kent, Jadoul, Olsen, Rigo, Galli and Nicora2010). Carbon isotope values show significant fluctuations through Rhaetian–Hettangian time, with two conspicuous negative δ13Corg excursions. There is an ‘increasingly replicated pattern of an abrupt “initial” negative excursion, closely followed by an extended “main” isotope excursion’ (Hesselbo, McRoberts & Pálfy, Reference Hesselbo, McRoberts and Pálfy2007) across the T–J boundary. Specifically, above the ‘initial’ negative excursion, there is a positive excursion followed again by more negative values, representing subordinate fluctuation within a positive excursion. The subordinate negative peak within the positive excursion is correlated with the T–J boundary (Korte et al. Reference Korte, Hesselbo, Jenkyns, Rickaby and Spötl2009). Thus, the studies of the carbon-cycle disturbances are very useful in discussions on the placement of the T–J boundary and its global correlation (e.g. Pálfy et al. Reference Pálfy, Demeny, Haas, Hetenyi, Orchard and Veto2001; Galli et al. Reference Galli, Jadoul, Bernasconi and Weissert2005; Hesselbo, McRoberts & Pálfy, Reference Hesselbo, McRoberts and Pálfy2007; Hillebrandt et al. Reference Hillebrandt, Krystyn, Kürschner, Bown, McRoberts, Uhl, Simms, Tomasovych and Ulrichs2007; Korte et al. Reference Korte, Hesselbo, Jenkyns, Rickaby and Spötl2009).
Global anoxic events, regression, primary productivity crash, methane hydrate release and rapid global warming, and oceanic productivity crises have all figured in recently proposed kill mechanisms (Hallam & Wignall, Reference Hallam and Wignall1997, Reference Hallam and Wignall1999; Pálfy et al. Reference Pálfy, Demeny, Haas, Hetenyi, Orchard and Veto2001; Pálfy, Smith & Mortensen, Reference Pálfy, Smith and Mortensen2000; Hesselbo et al. Reference Hesselbo, Robinson, Surlyk and Piasecki2002; Hesselbo, McRoberts & Pálfy, Reference Hesselbo, McRoberts and Pálfy2007; Ward et al. Reference Ward, Haggart, Carter, Wilbur, Tipper and Evans2001, Reference Ward, Garrison, Haggart, Kring and Beattie2004; Galli et al. Reference Galli, Jadoul, Bernasconi and Weissert2005; McElwain, Beerling & Woodward, Reference McElwain, Beerling and Woodward1999; McElwain et al. Reference McElwain, Popa, Hesselbo, Haworth and Surlyk2007). The search for trigger mechanisms has focused also on the possibility of rare astronomical-geological events such as a bolide impact (Olsen et al. Reference Olsen, Kent, Sues, Koeberl, Huber, Montanari, Rainforth, Fowell, Szajna and Hartline2002; Simms, Reference Simms2007). The biostratigraphy and carbon isotope profiles across the T–J boundary in Canada (Ward et al. Reference Ward, Haggart, Carter, Wilbur, Tipper and Evans2001), Hungary (Pálfy et al. Reference Pálfy, Demeny, Haas, Hetenyi, Orchard and Veto2001, Reference Pálfy, Demeny, Haas, Carter, Gorog, Halasz, Oravecz-Scheffer, Hetenyi, Marton, Orchard, Ozsvart, Veti and Zajzon2007; Haas & Tardy-Filácz, Reference Haas and Tardy-Filacz2004), United Kingdom (Hesselbo et al. Reference Hesselbo, Robinson, Surlyk and Piasecki2002; Hesselbo, Robinson & Surlyk, Reference Hesselbo, Robinson and Surlyk2004), Nevada, USA (Guex et al. Reference Guex, Bartolini, Atudorei and Taylor2004; Ward et al. Reference Ward, Garrison, Williford, Kring, Goodwin, Beattie and McRoberts2007), Italy (Galli et al. Reference Galli, Jadoul, Bernasconi and Weissert2005) and Austria (Kürschner, Bonis & Krystyn, Reference Kürschner, Bonis and Krystyn2007; Hillebrandt et al. Reference Hillebrandt, Krystyn, Kürschner, Bown, McRoberts, Uhl, Simms, Tomasovych and Ulrichs2007) can be correlated and show a regression–transgression couplet coincident with changes in the carbon isotope curve. It is not clear whether these sea-level changes were eustatic or, alternatively, epeirogenic and linked to the CAMP volcanism (Hallam, Reference Hallam1997; Hallam & Wignall, Reference Hallam and Wignall1999).
Carbon isotope trends in particular have proved useful in evaluation of palaeoenvironmental changes during biotic crises. Perturbations in the Earth's carbon cycle represent geologically instantaneous events, are of a global scale and can potentially be observed in marine and continental settings in a variety of facies (Kump & Arthur, Reference Kump and Arthur1999; Beerling & Berner, Reference Beerling and Berner2002; Korte et al. Reference Korte, Hesselbo, Jenkyns, Rickaby and Spötl2009; Deenen et al. Reference Deenen, Ruhl, Bonis, Krijgsman, Kürschner, Reitsma and Van Bergen2010; Whiteside et al. Reference Whiteside, Olsen, Eglinton, Brookfield and Sambrotto2010). Resolution of extinction timing and the recognition of an ecological selectivity to the extinctions have also helped clarify the nature of the crisis (McRoberts & Newton, Reference McRoberts and Newton1995; Sephton et al. Reference Sephton, Amor, Franchi, Wignall, Newton and Zonneveld2002; Ward et al. Reference Ward, Haggart, Carter, Wilbur, Tipper and Evans2001, Reference Ward, Garrison, Haggart, Kring and Beattie2004; McElwain et al. Reference McElwain, Popa, Hesselbo, Haworth and Surlyk2007; McElwain, Beerling & Woodward, Reference McElwain, Beerling and Woodward1999; McElwain, Wagner & Hesselbo, Reference McElwain, Wagner and Hesselbo2009; Deenen et al. Reference Deenen, Ruhl, Bonis, Krijgsman, Kürschner, Reitsma and Van Bergen2010; Whiteside et al. Reference Whiteside, Olsen, Eglinton, Brookfield and Sambrotto2010). In contrast, other authors have questioned whether the boundary can even be characterized unequivocally as a mass extinction. Hallam (Reference Hallam2002) has argued that the tempo of extinction was gradual rather than catastrophically rapid, whereas others (Tanner, Lucas & Chapman, Reference Tanner, Lucas and Chapman2004) suggest that most of the apparent biodiversity losses across the T–J boundary are due to biases or artefacts of sampling or poor stratigraphical control.
The present paper attempts to address these issues using a multidisciplinary dataset gathered from a T–J boundary section in continental deposits from a cored borehole, which was drilled near Kamień Pomorski in the Pomerania region in northwestern Poland. Palaeontological and geological observations, including palynology and sedimentology, are compared with geochemical data, including carbon isotopes, osmium and rhenium isotopes, and iridium content.
In this paper, in an attempt to better constrain our understanding of the causes and consequences of one of the five greatest extinction events in Earth history, we: (1) document the miospore biostratigraphic framework; (2) present an analysis of the vegetation change spanning the T–J extinction event from a census chosen palynofloral dataset of more that 5000 miospores; (3) report analyses that establish a carbon isotope correlation with other profiles and sea-level changes across the T–J boundary; (4) report first ever analyses of the Os and Re isotope system across the T–J boundary in continental deposits.
2. Geological and palaeogeographical setting
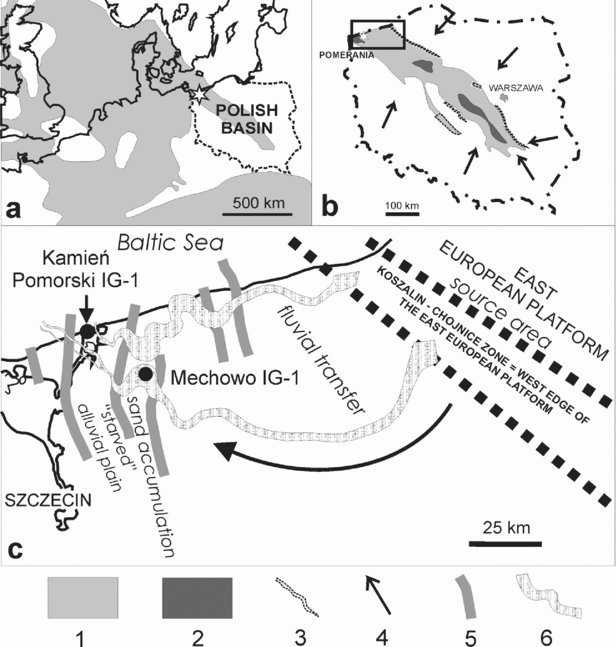
Two boreholes from Pomerania, northwestern Poland (Kamień Pomorski IG-1 and Mechowo IG-1, located 25 km to the SE) (Dadlez, Reference Dadlez1972), have yielded core material from the T–J transition in continental deposits (Fig. 1). Recovery of core in the Kamień Pomorski borehole was about 42% in the Rhaetian and Hettangian and, fortunately, the core was recovered from the most important parts of the profile (including the T–J boundary interval). In Mechowo IG-1 the core recovery was above 90%, but the Rhaetian–Hettangian boundary occurs within a thick sandstone succession of fluvial origin and this boundary is determined only based on sparse occurrences of megaspores (Trileites pinguis assemblage, Rhaetian, and Nathorstisporites hopliticus assemblage, Hettangian, see Marcinkiewicz, Reference Marcinkiewicz1971). In Pomerania, the Rhaetian sediments show conspicuous bi-partite development (Fig. 2). The lower part, belonging to the Lower–Middle Rhaetian Wielichowo Beds, is represented by brownish or variegated mudstone, with rare, scattered calcium-carbonate concretions. In places, poorly preserved, oxidized rootlets with iron-oxide rhizoconcretion mottles occur. These features are indicative of a climate characterized by seasonal precipitation in which evapotranspiration exceeded precipitation, and where the water table fluctuated during the year (a dry inland basin of playa character in a semi-arid, seasonal climate).
Palaeogeography and location of study area: (a) Palaeogeographic map of the Early Jurassic basins in Europe with location of Kamień Pomorski; (b) General palaeogeographic map of the Early Hettangian in Poland: 1– alluvial plain, 2 – lacustrine, 3 – main fracture zones, 4 – main sediment transport directions; (c) Location of boreholes Kamień Pomorski IG-1 and Mechowo IG-1 and the general palaeogeography of the Late Rhaetian–earliest Hettangian alluvial plain deposits in Pomerania (framed section of the map in (b)): 5 – syn-sedimentary faults, 6 – fluvial channels (after Pieńkowski, Reference Pieńkowski2004).
Lithological cross-section of the Upper Rhaetian–Lower Hettangian alluvial deposits in Western Pomerania between Kamień Pomorski and Mechowo; note decrease in depositional energy towards the NW and resulting decrease in thickness of fluvial channel sediments.
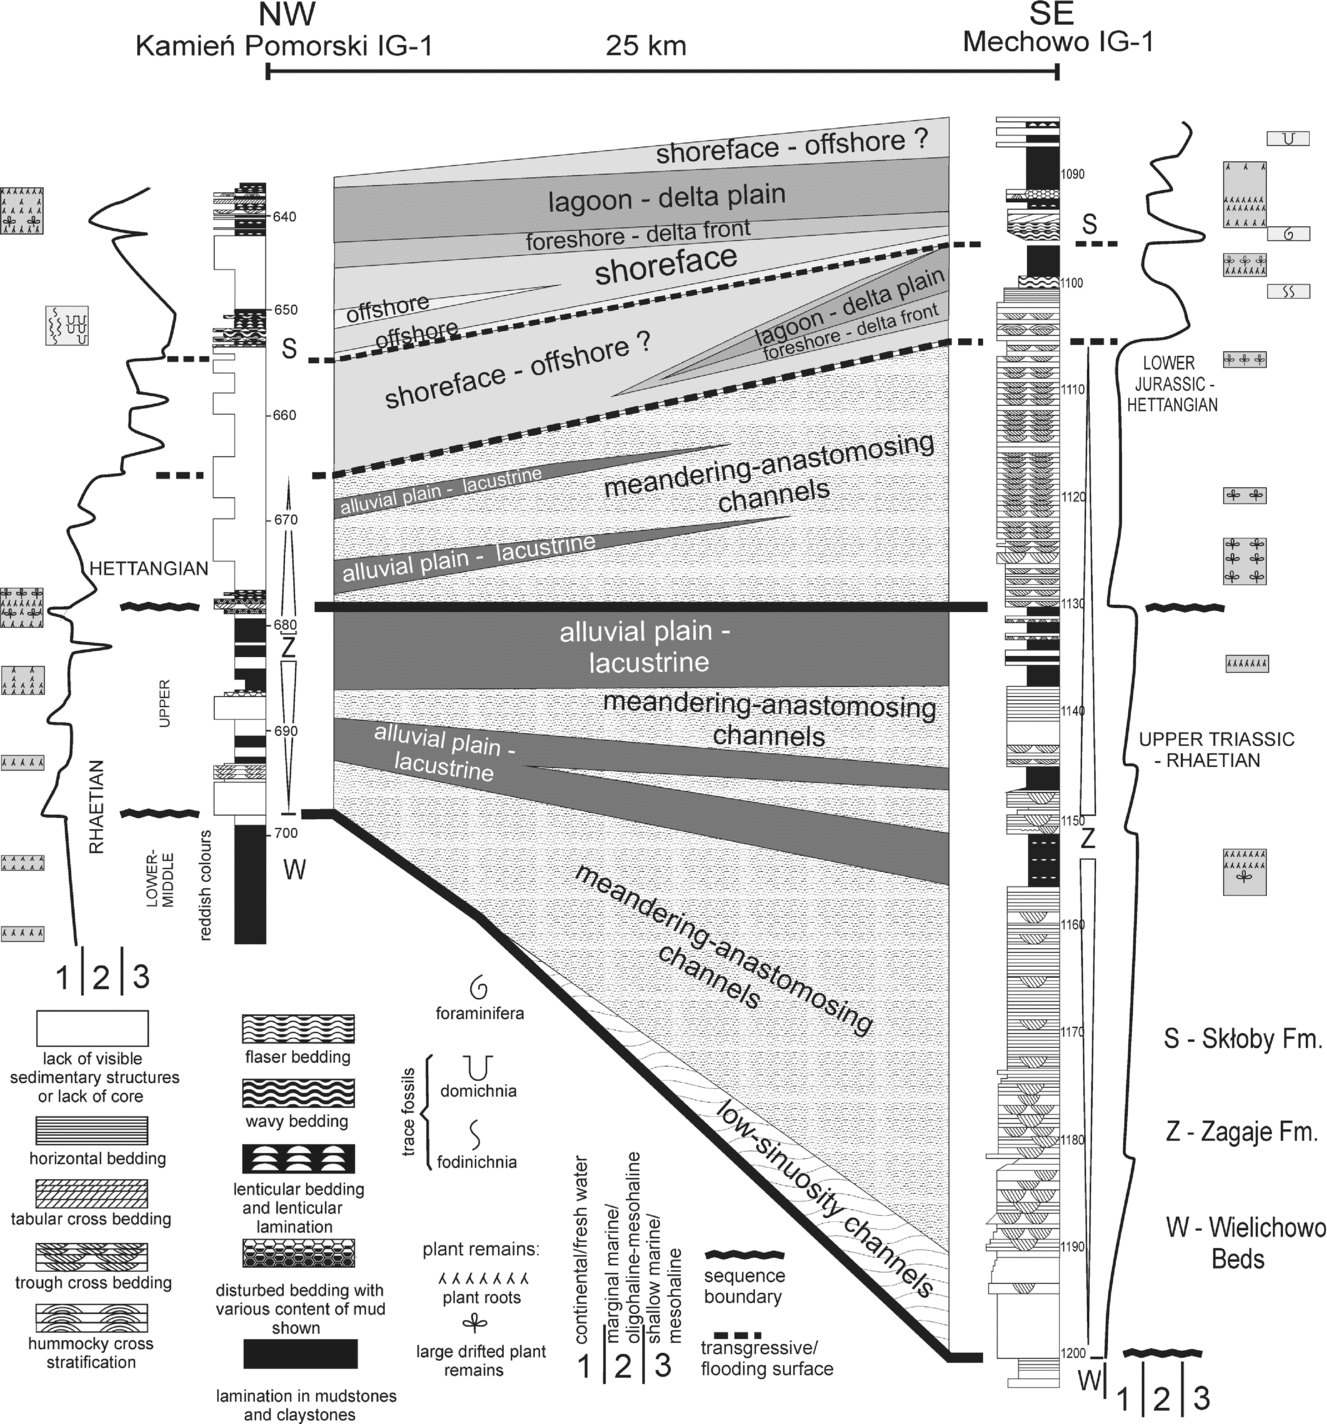
The Upper Rhaetian (lowermost Zagaje Formation sensu Pieńkowski, Reference Pieńkowski2004) commences with sandstones resting on a marked erosional boundary (698 m in Kamień Pomorski borehole), correlated with the sequence boundary, which is probably concomitant with the Rhaetian lowstand, inferred to be one of the lowest in the Phanerozoic (Hallam, Reference Hallam1997). This sequence boundary can be correlated with emergence surfaces within the Westbury Fm, occurring both in the St Audrie's (Hesselbo et al. Reference Hesselbo, Robinson, Surlyk and Piasecki2002) and Larne (Simms & Jarem, Reference Simms and Jeram2006) sections, and a lowstand (correlative with a sequence boundary) at Kuhjoch, located at the top of Koessen Fm (Hillebrandt et al. Reference Hillebrandt, Krystyn, Kürschner, Bown, McRoberts, Uhl, Simms, Tomasovych and Ulrichs2007) and in Csövár (Pálfy et al. Reference Pálfy, Demeny, Haas, Hetenyi, Orchard and Veto2001, Reference Pálfy, Demeny, Haas, Carter, Gorog, Halasz, Oravecz-Scheffer, Hetenyi, Marton, Orchard, Ozsvart, Veti and Zajzon2007). Lithologically these beds comprise grey sandstone and mudstone with coalified rootlets. Carbonate concretions are replaced by sideritic ones, and their oxidization is responsible for red staining of the mudstones, although in places the red colours in mudstones are also primary. The Late Rhaetian climate must have been wetter than in the Early–Middle Rhaetian, although drier periods still occurred. In Mechowo IG-1, thick sandstone packages of fluvial origin make the Upper Rhaetian–Lower Hettangian Zagaje Formation and are much thicker than in the Kamień Pomorski IG-1 borehole, where finer sediments of floodplain, lacustrine and crevasse splay facies prevail (Fig. 2). This indicates a substantial decrease in depositional energy of the alluvial palaeoenvironment to the west and northwest, which reflects both palaeoslope (Mechowo was closer to the sedimentary source area, situated behind the major Koszalin–Chojnice dislocation zone, in the East European Platform) and local tectonic factors (Fig. 1). In Rhaetian and Jurassic times, the studied area was affected by a number of N–S-trending faults, grabens and half-grabens (Dadlez, Reference Dadlez1969; Dadlez et al. Reference Dadlez, Iwanow, Leszczyński and Marek1998). These syn-sedimentary faults and grabens acted as traps for sandy sediments; therefore, the deposition of coarser sediments took place largely east of Kamień Pomorski, around the Mechowo area. A steep palaeoslope favoured erosion at the Koszalin–Chojnice dislocation zone and then fast fluvial transfer to the east, with the dominance of straight- to low-sinuosity channels. Further to the west, the river system entered the zone of faults and grabens in the western part of the area studied. This was the area of the Mechowo IG -1 borehole, characterized by fast accumulation of sand and the dominance of high-sinuosity, meandering fluvial channels (Figs 1, 2; see amalgamated meandering channel deposits). Still further to the west and northwest, channel energy decreased and only a minor part of the sandy sediment could be transported (‘starved’ alluvial plain, likely of meandering-anastomosing character, with high-sinuosity channels). As a result, muddy overbank deposits dominate in the Kamień Pomorski IG-1 profile (Figs 1, 2). Climate became wetter, as indicated by palaeosols with numerous coalified plant roots and numerous well-preserved, coalified, drifted floral remains. During that period, the region was gradually transforming into wetlands.
At the top of the Rhaetian deposits, the second sequence boundary occurs (678.4 m). This boundary is marked by regional erosion in the sedimentary basin of Poland, and also in some localities in Sweden (Lindström & Erlström, Reference Lindström and Erlström2006) and Western Europe, but owing to a local tectonic regime, this erosion in Kamień Pomorski was rather less; fine-grained sandstone above the erosional boundary does not contain coarser grains or mud clasts, and bedding at the bottom of the sandstone is characteristic of a rhythmic, lower flow regime (Fig. 2; depth 678.4 m). This is an exceptional case in the Early Jurassic Polish Basin, because commonly the Rhaetian deposits are truncated from the top by erosion, at this regional sequence boundary, often merged with the lower sequence boundaries between Middle and Upper Rhaetian and between Rhaetian and Norian deposits (Pieńkowski, Reference Pieńkowski2004). Nevertheless, possible erosion at the second sequence boundary at Kamień Pomorski should be also taken into consideration.
Subsequent Early Jurassic sedimentation in Poland and in Pomerania has been characterized in detail by Pieńkowski (Reference Pieńkowski2004). The lowermost part of the Hettangian deposits in the Mechowo IG-1 borehole (Figs 2, 3) contains the Hettangian to Early Sinemurian megaspore Nathorstisporites hopliticus (Marcinkiewicz, Reference Marcinkiewicz1971) and is developed as medium-grained, trough cross-bedded sandstone representing entirely the alluvial (meandering channel–point bar) depositional subsystem. In Kamień Pomorski IG-1 (depth 665.5 to 678.4 m), the grain size of sediments is significantly finer and overbank subsystems (floodplain, lacustrine and crevasse splays) dominate. Earliest Hettangian alluvial deposition was a continuation of Rhaetian deposition, and therefore both Upper Rhaetian and lowermost Hettangian alluvial deposits are assigned to the same lithostratigraphic unit, the Zagaje Formation (Pieńkowski, Reference Pieńkowski2004).
Palynomorph taxa and their vertical ranges, colour of miospores (2 – dark yellow; 2–3 – yellow-orange; 3–4 – orange; 4 – orange-brown), palaeosol levels and frequency of miospores, spore/pollen ratio and number of taxa/miospore diversity (numbers with the frequency bars) in the Kamień Pomorski profile. Triassic–Jurassic (T–J) boundary transition is shaded, dotted horizontal line = palynofloral turnover boundary, sequence boundary and inferred T–J boundary. Explanation of the lithological column in Figure 2. Megaspore occurrences after Marcinkiewicz (Reference Marcinkiewicz1971).

At a depth of 1105 m at Mechowo IG-1, a major Hettangian transgressive surface is recorded (Pieńkowski, Reference Pieńkowski2004). At Kamień Pomorski, this transgressive surface occurs within the uncored section and, based on wire log correlation, is tentatively placed at a depth of 665 m. The overlying sediments both in Mechowo IG-1 and Kamień Pomorski IG-1 are characterized by mudstone, heterolithic and medium-grained to fine-grained sandstone with dolomitic cement, containing horizontal bedding, trough cross-bedding and hummocky cross-stratification. This complex is divided into several parasequences, identified as being deposited in the shoreface-foreshore-barrier depositional subsystems, and is assigned to the Skłoby Formation (Pieńkowski, Reference Pieńkowski2004). The flooding surfaces are identified where dark, lagoonal deposits containing plant roots in the uppermost part are overlain by wavy- and flaser dolomitic heteroliths with microhummocky cross-lamination containing foraminifera and acritarchs. Progradation in each parasequence is represented by a succession of nearshore/barrier and lagoonal depositional systems, ending with marshy deposits with palaeosols and thin coal seams. Flooding events were associated with elevation of the water table and changes in O2 conditions in the sediment, resulting in pyritization of deeper plant roots.
3. Material and methods
3.a. Palynology
Fifteen rock samples from the Kamień Pomorski IG-1 core were taken for quantitative palynological analysis; 12 of them yielded palynomorphs (Figs 3, 4). Samples of different weights (about 20–100 g) were dried and crushed into small fragments. Subsequently, samples were treated twice alternately with cold HCl (30%) and cold HF (38%) in order to remove the carbonate and silicate minerals. The residue was washed with water until a neutral pH was reached. ZnCl2 was applied to separate organic and inorganic residue (e.g. pyrite). Slide preparations, three of each sample, were made in glycerine jelly. Permanent slides are stored in the collection of the Department of Regional Geology, Economic Geology and Geophysics, Polish Geological Institute, Poland.
Selected characteristic miospores of the Triassic–Jurassic boundary section in Kamień Pomorski (compare with Fig. 3). Triassic taxa: spores: (a) Baculatisporites comaumensis (Cookson) Potonie, depth 680.7 m; (b, c) Cingulizonates rhaeticus (Reinhardt) Schulz: (b) 677.5 m, (c) 703.2 m; (d) Deltoidospora toralis (Leschik) Lund, 699.3 m; (e, f) Limbosporites lundblandii Nilsson: (e) 703.2 m, (f) 678.6 m; (g) Ricciisporites tuberculatus Lundblad (tetrad, transitional T–J form), 678.6 m; (h) Semiretisporis gothae Reinhardt, 678.6 m; pollen grains: (i) Angustisulcites klausii Freudenthal, 680.7 m; (j) Brachysaccus neomundanus f. minor (Leschik) Lund, 703.2 m; (k) Microreticulatisporites fuscus (Nilsson) Morbey, 691 m; (l) Minutosaccus potoniei Mädler, 699.3 m; (m) Platysaccus niger Mädler, 680.7 m; (n) Platysaccus nitidus Pastuch, 703.2 m; (o) Schizosaccus keuperi Mädler, 691 m; (p) Vitreisporites pallidus (Reissinger) Nilsson, 686 m (transitional T–J form). Jurassic taxa: spores: (q) Conbaculatisporites mesozoicus Klaus, 642.1 m; (r, s) Dictyophyllidites mortoni (de Jersey) Playford & Dettmann: (r) 677.5 m, (s) 650.3 m; (t) Lycopodiumsporites semimuris Danze-Corsin & Laveine, 676.8 m; (u, v) Trachysporites asper Nilsson, 642.1 m; (w) Trachysporites fuscus Nilsson, 642.1 m; (x) Zebrasporites interscriptus (Thiergart) Klaus, 650.3 m; pollen grains: (y, z) Cerebropollenites thiergartii Schulz: (y) 677.5 m, (z) 650.3 m; (aa) Ovalipolis ovalis Krutzsch, 678.6 m (transitional T–J form); (bb) Pinuspollenites minimus (Couper) Kemp, 642.1 m (transitional T–J form). Scale bar = 25 μm.

Palynological terminology used in this paper includes the following terms: ‘floral remains’ – used here for large floral (macrofloral) remains; ‘palynomaceral’ (= kerogen) – all the HF-resistant organic material; ‘phytoclasts’ – all microscopic remains of vegetative plant tissue (wood, cuticle, etc.) and charcoal; ‘palynomorphs’ – here, microscopic, single-celled, reproductive bodies built of sporopollenin, such as megaspores, spores, pollen grains plus Acritarcha; ‘spore’ – smaller reproductive structures of plants adapted for dispersion; ‘pollen grain’ – a structure produced by plants containing the male gamete to be used in reproduction, commonly with air sacs; ‘miospores’ – spores and pollen grains together; ‘megaspore’ – a type of large spore coming from heterosporous plants; ‘palynofloral’ – here everything regarding miospores and megaspores.
3.b. Carbon isotope analysis
A set of 24 samples from the Kamień Pomorski IG-1 borehole (Fig. 6) was prepared for carbon isotope analysis of bulk sedimentary organic matter, representing mostly phytoclasts, including charcoal. About 30–50 g of sediment were crushed and treated twice with cold HCl (30%) and cold HF (38%) in order to remove the carbonate and the silicate. The residues were washed with water until a neutral pH was achieved and subsequently freeze dried. Phytoclasts were separated manually under the binocular microscope from palynomorphs, and only phytoclast separates were taken for the carbon isotope analysis. Additionally, charcoal was separated in one sample and carbon isotope ratios obtained both from charcoal and other phytoclasts. The results were almost identical, pointing to the lack of isotopic differentiation between charcoal and other phytoclasts. The carbon isotope ratios were measured on homogenized samples by a Carlo-Erba 1110 elemental analyzer connected online to a Thermo Finnigan Delta Plus mass spectrometer. All carbon isotope values are reported in the conventional δ-notation in per mil relative to VPDB (Vienna Pee Dee Belemnite). Accuracy and reproducibility of the analyses were checked by replicate analyses of international standard USGS 40. Analytical precision: mean (μ) = −26.18 and one standard deviation (σ) = 0.06.
It should be noted that 24 samples spanning > 60 m of section is a relatively small number of carbon isotopic data on which to report. However, 35 m of that 60 m section were not cored at all. We sampled the remaining 25 m as densely as possible (considering also the preservation of the core), and actually the average density of sampling in the cored profile is close to one sample per 1 m, although sampling density is not equal, also due to core preservation and lithology (only mudstones yielded enough palynomaceral material).
3.c. Osmium and rhenium isotope analyses and iridium content
Analyses of osmium, iridium and rhenium content, as well as analyses of the following isotopes, 186Os, 187Os, 188Os, 192Os and 187Re, were carried out on nine samples (Table 1; Fig. 8). The analytical procedure used here followed that described in detail by Brauns (Reference Brauns2001). In brief, all samples (0.2–0.75 g) were weighed into pre-spiked Carius tubes and dissolved and equilibrated using inverse aqua regia in an oven at 240°C. Spike 10 solutions of mixed 190Os –185Re tracer (185Re/190Os = 11.2) were used in the course of this study. Osmium was purified by distillation of the volatile tetra oxide, condensed on a very small volume (2 ml) of chilled H2SO4, and then collected in 0.5 ml of 6.8 N HBr. The final purification of Os was accomplished by micro-distillation, following the method of Birck, Roy Barman & Capmas (Reference Birck, Roy Barman and Capmas1997). Os isotope ratios were determined using a SPECTROMAT ion counting-system running in peak-jumping mode. The 2σ in-run analytical uncertainties for Re and Os isotope ratios were < 0.1% and < 0.3%, respectively. Total procedural blanks averaged 0.1 ± 0.05 pg for Os. The isotopic composition of Os in the blank is very close to the natural composition and has a ratio of 0.112 (187Os/188Os). All data were blank corrected on the basis of these measurements in combination with a yield of 90%, and an Os blank of 0.10 pg.

4. Results
4.a. Palynology
A total of 5239 miospores plus a few acritarchs were recorded from 12 productive samples (of which 4780, about 90%, were obtained from two samples). Seventy-two species of miospores (spores and pollen grains) were identified, together with two species of megaspores (Fig. 3). Of the miospores, 63 taxa are listed in Figure 3 (the 23 most characteristic ones are illustrated in Fig. 4), the remaining ten taxa being either forms with a very wide stratigraphic range or of doubtful identity owing to low frequency and poorer state of preservation. In terms of diversity, this is comparable to the miospore assemblages described from the T–J transition interval, i.e. to those described by Lund (Reference Lund1977: 80 taxa identified), Pedersen & Lund (Reference Pedersen and Lund1980: 76 taxa indentified), Achilles (Reference Achilles1981: 147 taxa identified) and the assemblages newly described from Austria (Bonis, Kürschner & Krystyn, Reference Bonis, Kürschner and Krystyn2009: 118 taxa identified) and from Slovakia (Ruckwied & Götz, Reference Ruckwied and Götz2009: 64 taxa identified). Of particular importance is the latest work of Bonis, Kürschner & Krystyn (Reference Bonis, Kürschner and Krystyn2009), giving by far the most complete palynological data from the T–J transition from Austrian profiles, including the GSSP at Kuhjoch, which is taken as a reference for the current paper concerning palynology.
In the beds assigned to the Rhaetian (Fig. 3), the miospores are scarce (3–5 specimens per sample) and pollen grains dominate. Just at and slightly below the sequence boundary at 678.4 m (Fig. 3), identified as the T–J boundary based on the carbon isotope curve, sequence stratigraphic correlation and occurrences of indicative megaspores of Marcinkiewicz (Reference Marcinkiewicz1971), the abundance of spores rapidly increases. In one sample at 678.6 m, just below the sequence (T–J) boundary, the frequency of miospores is 1355 specimens in one sample (many of them being grouped in tetrads), which means that the frequency of miospores just below the T–J boundary is higher by one to two orders of magnitude. In most of the Rhaetian samples the material is too sparse (3 to 5 taxa in several to 20 specimens) for reliable specification of the primary diversity of miospores. In the uppermost sample below the sequence boundary, 11 taxa were identified in 1355 specimens (93% spores), which does not point to a high diversity. Of note also is the changing character of the palynofacies and spore/pollen grain ratio (Fig. 3) in these transitional deposits, which points to changing conditions in the interval. Prevalence of fern-derived spores may indicate a ‘fern peak’ at 678.6 m, because above the T–J boundary the frequency of spores diminishes again. However, in the uppermost sample studied (depth 642.1 m, Hettangian strata) the number of spores is even higher (3425 miospores). This sample comes from a lagoonal-marsh environment (Fig. 3). Obviously, this shift is not connected with a ‘fern peak’ associated with floral turnover, but represents a local change of environment, associated with an elevated water table in the swampy-marsh setting and the resulting character of vegetation, dominated by ferns and fern allies. Generally, the Hettangian assemblage is more diverse than the Rhaetian assemblage (only one sample with 5 taxa; other samples contain 11 to 26 taxa; Fig. 3).
Importantly, the Rhaetian miospores show lighter, dark yellow colours compared to the miospores in some samples from the Rhaetian/Hettangian transitional section, which are darker: yellow-orange, orange, and in one sample (678.6 m, just below the sequence boundary), orange-brown. Above the transitional section, miospores get lighter (dark yellow) again (Fig. 3). Generally, the miospores in a given sample show a darkening ranging by one colour step. One sample showing mostly darkened, brownish miospores shows quite a uniform darkening of the miospores. Most of the samples contain relatively light, yellow miospores, and those samples also show uniform character in colour of the miospores. Light pollen grains often show a superficial dark coating, but this was not taken into account when specifying the colours of the miospores. Spores are usually darkened uniformly; however, in pollen grains the sacs are often slightly lighter than the corps. Figure 3 shows the section 676.9–686 m with the fluctuating miospore colours. A sample at 678.6 m, just below the sequence/T–J boundary, shows the most conspicuous darkening of the miospores (orange-brown). Two other samples at 686 m and 676.8 m contain orange miospores; the rest of the samples contain lighter, yellow-orange or dark-yellow miospores.
The uppermost Rhaetian and lowermost Jurassic transitional deposits (Fig. 3; 676.5–681 m) show a palynofloral turnover (Fig. 3): 11 taxa continue from Rhaetian to Jurassic strata, but 7 taxa disappear at the T–J boundary and 38 taxa appear above this boundary.
In the Rhaetian strata, the following miospores are characteristic: Baculatisporites comaumensis (Fig. 4a), Cingulizonates rhaeticus (Fig. 4b, c), Deltoidospora toralis (Fig. 4d), Limbosporites lundblandii (Fig. 4e, f), Ricciisporites tuberculatus (Fig. 4g), Semiretisporis gothae (Fig. 4h) (spores); and Microreticulatisporites fuscus (Fig. 4k), Platysaccus niger (Fig. 4m), Schizosaccus keuperi (Fig. 4o) (pollen grains). Megaspore Trileites pinguis, occurring in the profile studied just below the T–J boundary, is also restricted to the Rhaetian (Marcinkiewicz, Reference Marcinkiewicz1971). Spores Baculatisporites comaumensis, Cingulizonathes rhaeticus, Deltoidospora toralis, Limbosporites lundblandii and pollens Angustisulcites klausii, Minutosaccus potoniei, Microreticulatisporites fuscus and Schizosaccus keuperi show continuous occurrences in the Rhaetian interval, while the other miospores were noted in single samples.
Occurrences of Angustisulcites klausii (Fig. 4i), Brachysaccus neomundanus (Fig. 4j), Infernopollenites gracilis, Microcachryidites fastidiosus, Minutosaccus potoniei (Fig. 4l) and Platysaccus nitidus (Fig. 4n) in the Rhaetian strata in the Kamień Pomorski profile need to be commented on. They are typical of Middle Triassic (including lower Keuper in a German sense) or Carnian–Norian strata (Fijałkowska-Mader, Reference Fijałkowska-Mader, Bachmann and Lerche1999; Orłowska-Zwolińska, Reference Orłowska-Zwolińska1977, Reference Orłowska-Zwolińska and Malinowska1979, Reference Orłowska-Zwolińska1983, Reference Orłowska-Zwolińska1985). However, the Rhaetian age of these strata in Kamień Pomorski is proved by the presence of Rhaetian miospores (Cingulizonates rhaeticus and Limbosporites lundblandii), assigned to the Rhaetian in many works: Orłowska-Zwolińska (Reference Orłowska-Zwolińska and Malinowska1979), Poland; Fisher (Reference Fisher1972), UK; Lund (Reference Lund1977), Denmark and Sweden; and Achilles (Reference Achilles1981), Germany. Therefore, presence of these ‘older’ forms can be explained either by redeposition or a longer stratigraphical range.
Just above the T–J and sequence boundary (676.6–678.4 m), the lowermost Hettangian assemblage comprises the following characteristic spores: cf. Auritulina scanicus, Cingulizonates delicatus, Cingulizonates cf. inequalis, Concavisporites intrastriatus, Concavisporites umbonatus, Conbaculatisporites mesozoicus (Fig. 4q), Cyclogranisporites congestus, Densosporites fissus, Dictyophyllidites harrisi, Dictyophyllidites mortoni (Fig. 4r, s), Duplexisporites problematicus, Leiotriletes mesozoicus, Lycopodiacidites rugulatus, Lycopodiumsporites semimuris (= Retitriletes semimuris) (Fig. 4t) and Zebrasporites interscriptus (Fig. 4x); and pollen grains: Cerebropollenites thiergartii (Fig. 4y, z), Ovalipollis ovalis (Fig. 4aa) and Pinuspollenites minimus (Fig. 4bb). The appearance of Cerebropollenites thiergartii is noteworthy: the FAD of this pollen grain is correlated with the beginning of the Jurassic (FAD of Psiloceras spelae) in the Kuhjoch GSSP section and other profiles (Kürschner, Bonis & Krystyn, Reference Kürschner, Bonis and Krystyn2007; Hillebrandt et al. Reference Hillebrandt, Krystyn, Kürschner, Bown, McRoberts, Uhl, Simms, Tomasovych and Ulrichs2007; although Bonis, Kürschner & Krystyn, Reference Bonis, Kürschner and Krystyn2009 noted a single occurrence of Cerebropollenites thiergartii also c. 3 m below the FAD of Psiloceras spelae). Also, the occurrence of megaspore Nathorstisporites hopliticus is characteristic of the Lower Jurassic, namely, Hettangian strata (Marcinkiewicz, Reference Marcinkiewicz1971). On the other hand, occurrences of several taxa of miospores typical of the Rhaetian (Cingulizonates rhaeticus, Deltoidospora toralis, Limbosporites lunblandii, Ricciisporites tuberculatus) continue in the lowermost Jurassic strata just above the sequence boundary at 677.5 m (Fig. 3). It is not clear to what extent these occurrences were caused by redeposition. The abundance of typically Rhaetian taxa quickly diminishes upwards, but a large-scale redeposition associated with erosion at the sequence boundary is unlikely considering the good state of preservation of these miospores. Likely, the parent plants of these miospores could still have survived into the Jurassic, albeit quickly giving way to the Jurassic flora.
Higher cored sections (635–642.1 and 649.8–653.4 m) show continuity of the assemblage noted from below, although a number of new taxa (such as Apiculatisporites ovalis, Baculatisporites wellmanii, Cibotiumsporites jurienensis, Concavisporites toralis, Cosmosporites elegans, Ischyosporites variegatus, Lycopodiacidites rugulatus, Polycingulatisporites crenulatus, Stereisporites punctus, Stereisporites stereoides, Trachysporites asper (Fig. 4u, v), Trachysporites fuscus (Fig. 4w), Uvaesporites reissingeri, Zebrasporites laevigatus, and pollen Alisporites radialis, cf. Microcachryidites fastidiosus, Quadreculina anellaeformis, as well as few acritarchs appear there (Fig. 3). It should be borne in mind that the cored sections between 649.8 and 653.4 m, and 637.2 and 642.4 m (Skłoby Formation) represent nearshore brackish and barrier-lagoonal/deltaic environments, respectively; thus, changes in palynofacies, frequency of miospores and the presence of acritarchs are influenced by the environmental conditions.
Collectively, miospores, associated palynofacies and macroscopic observations of floral remains and palaeosols, allow approximate reconstruction of the vegetation and its evolution through the Lower–Middle Rhaetian to the Upper Rhaetian–Early Hettangian transition in Pomerania (Fig. 3). First recorded miospores from a depth of 698–704 m in brownish mudstones with scattered carbonate nodules representing a semi-dry alluvial plain, are represented by poor miospore assemblages with pollen grains, pointing to the presence of Coniferophyta such as Pinaceae/Podocarpaceae (Barrón et al. Reference Barrón, Gómez, Goy and Pieren2006). Oxidized plant roots indicate the presence of palaeosols, possibly with local vegetation in wetter spots: the spores Leiotriletes minutus, Baculatisporites comaumensis, Cingulizonathes rhaeticus and Deltoidospora toralis indicate the presence of Pteridophyta such as Cyatheaceae/Dicksoniaceae (Barrón et al. Reference Barrón, Gómez, Goy and Pieren2006). The rare Limbosporites lundblandii was probably produced by Selaginellaceae (club mosses).
The following section of grey, subordinately red sandstone and mudstone (above the lower sequence boundary at 698 m and below the depth 680.9 m), was deposited in a fluvial channel/alluvial plain environment and shows similarly impoverished miospore assemblages represented mainly by pollen, with a few more taxa such as Vitreisporites pallidus, Infernopollenites gracilis, Microreticulatisporites fuscus, Pinuspollenites minimus, Chordasporites platysaccus, Quadraeculina sp. and Schizosaccus keuperi, and the spore Deltoidospora auritora. Palynofacies show slightly higher abundances of structured organic matter (phytoclasts) and plant roots (palaeosols) are more frequent. The vegetation in this section implies increasing humidity upwards, with more abundant palaeosols with coalified plant roots occurring at the top, with drier periods, and the vegetation is still dominated by Pinaceae/Podocarpaceae, possibly also Caytoniales and Pteridophyta such as Cyatheaceae/Dicksoniaceae and Pinacea/Podocarpacea (Barrón et al. Reference Barrón, Gómez, Goy and Pieren2006).
The interval 677–680.9 m (with the sequence boundary at 678.4 m) is characterized by rich palynofacies, including wood, cuticle and charcoal, with very abundant miospores, accompanied also by megaspores. This is the interval of marked palynofloral turnover: a number of taxa disappear, such as the megaspore Trileites pinguis and characteristic spores such as Baculatisporites comaumensis, Cingulizonates rhaeticus, Deltoidospora toralis, Limbosporites lundblandii and Semiretisporis gothae, and pollen such as Angustisulcites klausii, Minutosaccus potoniei and Schizosaccus keuperi. On the other hand, spores such as Concavisporites umbonatus, Conbaculatisporites mesozoicus, Dictyophyllidites mortoni and Lycopodiumsporites semimuris, and pollen grains Cerebropollenites thiergartii and Ovalipollis ovalis appear in this interval. Ricciisporites tuberculatus and Ovalipollis ovalis appear just below the sequence boundary and continue 1.5 m above it; thus, these miospores occur exclusively within this interval. It should be noted that the disappearance of a megaspore species (i.e. Trileites pinguis) and spore species might reflect the disappearance of a single parent plant taxon, rather than the disappearance of two plant taxa.
Our results reveal two major palynological assemblages (Figs 3, 4, 5). The first one (678.4–703 m), with sparse miospores in its lower part (680.9–703 m) becoming much more abundant at the top (678.4–680.9 m), is typically Rhaetian and contains characteristic miospores such as Baculatisporites comaumensis, Cingulizonates rhaeticus, Deltoidospora toralis, Limbosporites lundblandii, Semiretisporis gothae, Platysaccus niger and Schizosaccus keuperi. A low abundance of miospores in the Lower–Middle Rhaetian section (699–703 m, below the first sequence boundary) was probably related to climatic aridity and an oxidizing environment, while numerous spores in the uppermost Rhaetian (678.4–680.9 m) point to a generally more humid climate. In the whole Rhaetian section (678.4–703 m) some forms show continuous occurrences (i.e. Cingulizonates rhaeticus, Deltoidospora toralis, Limbosporites lundblandii and Schizosaccus keuperi), several forms occur only within the uppermost ~ 2 m of Rhaetian strata (Baculatisporites comaumensis, Cingulizonates marginatus, Deltoidospora crassexina, Ricciisporites tuberculatus, Semiretisporis gothae, Ovalipollis potovalis and Platysaccus niger), and the occurrences of five other taxa are spotty.
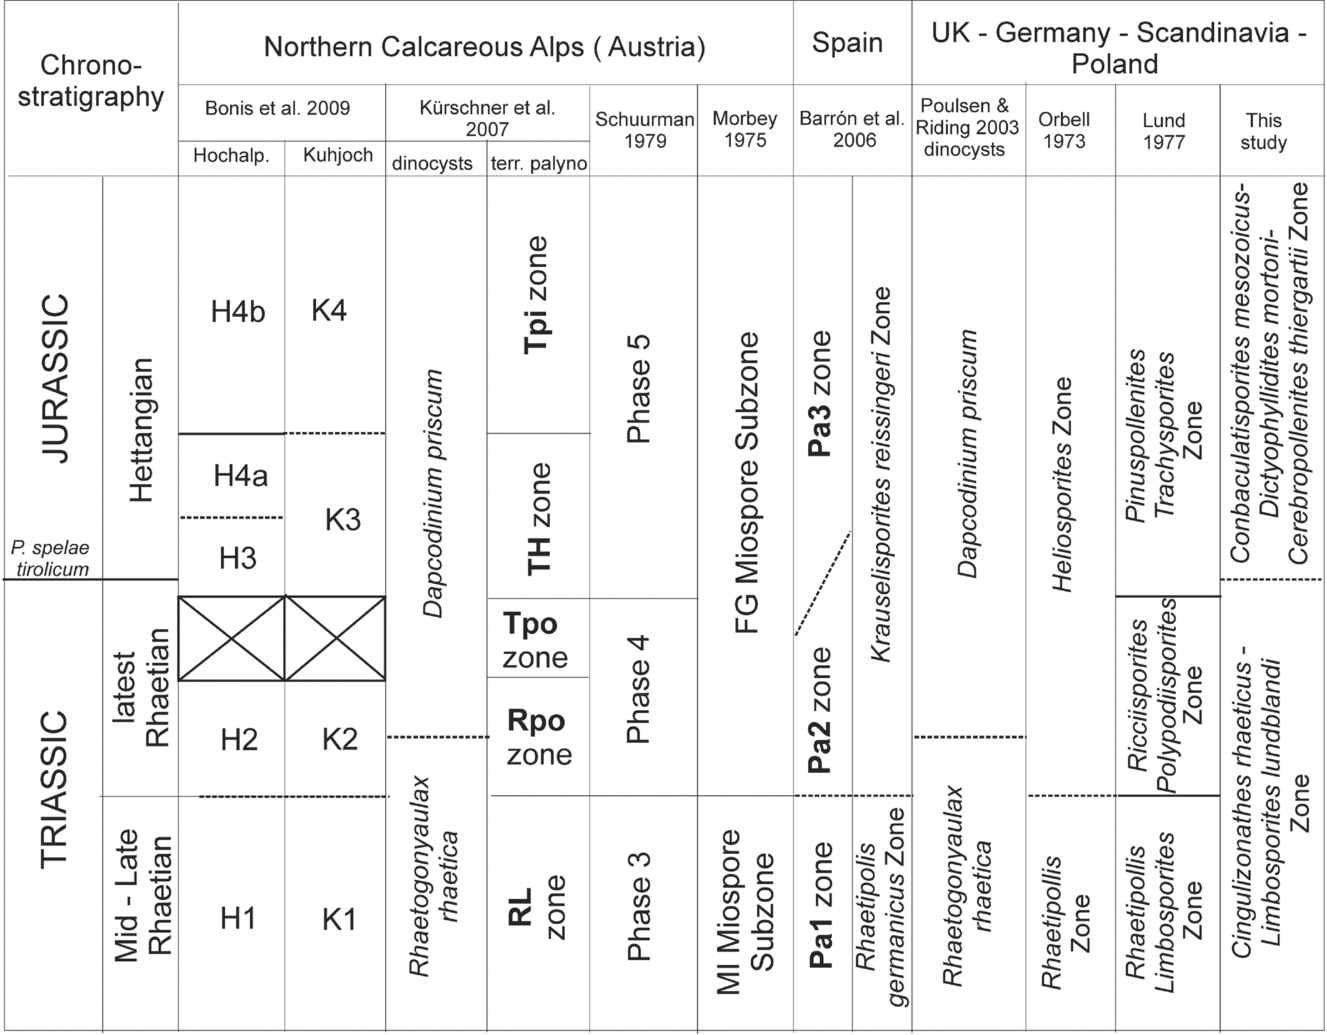
Comparison of the biostratigraphical and palynological zonation schemes from the Northern Calcareous Alps, Spain and North-Central Europe. Based on Bonis, Kürschner & Krystyn (Reference Bonis, Kürschner and Krystyn2009), changed and amended.
4.b. Carbon isotopes
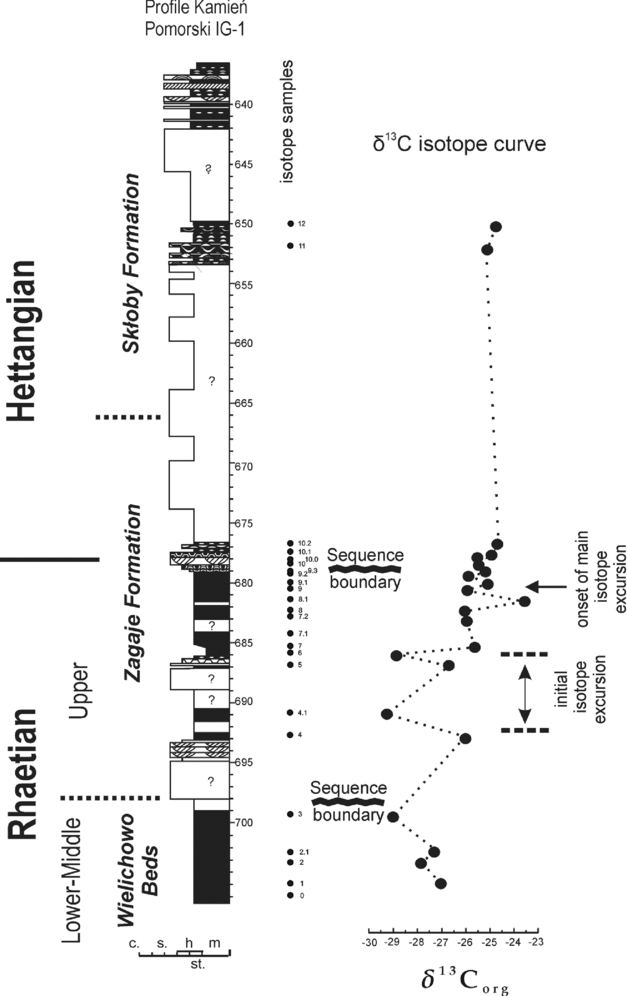
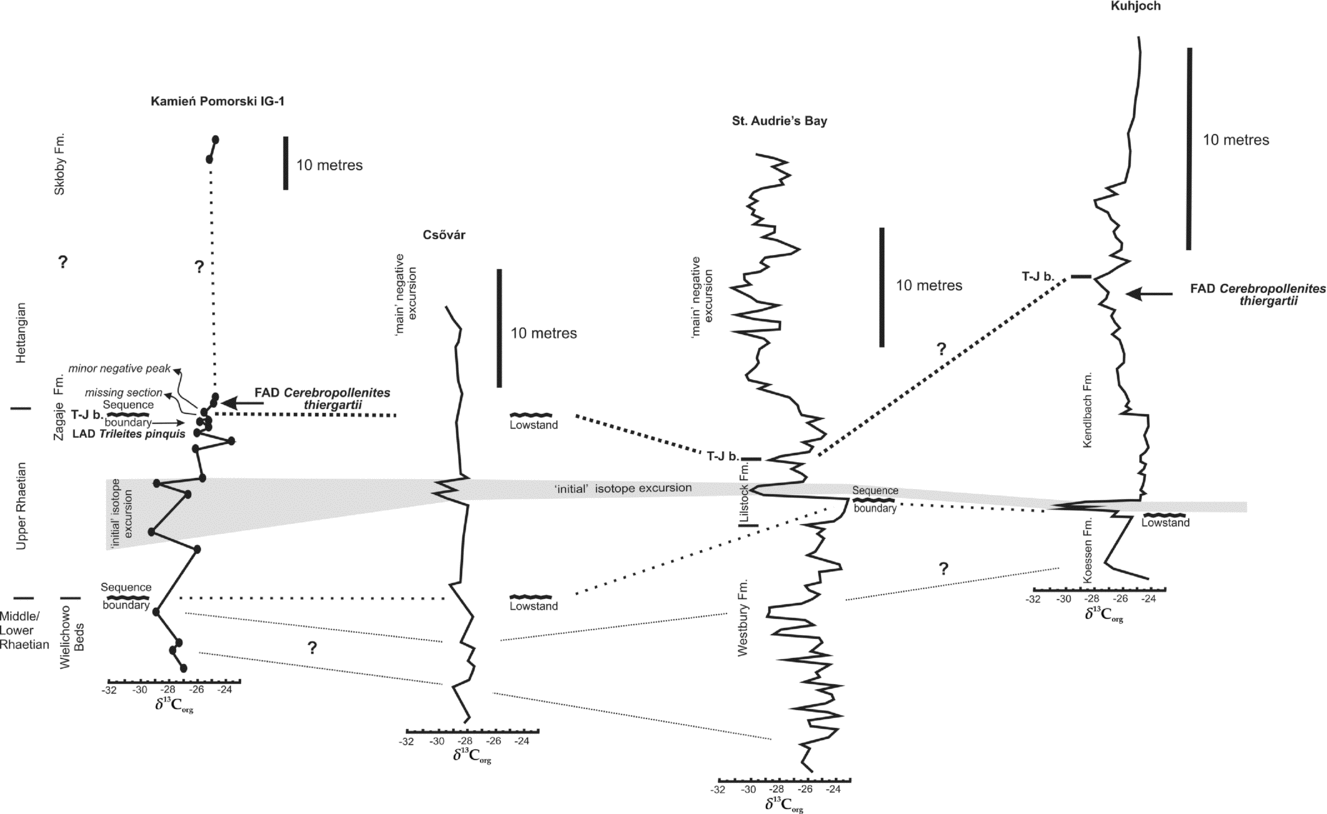
Carbon isotope values from palynomaceral separates (δ13Corg = per mil deviation in 13C/12C with respect to the VPDB standard) show marked fluctuations through the succession (Fig. 6). The first conspicuous negative excursion (−29.15 ‰ δ13Corg at 699.3 m) is observed in the lower part of the section (Wielichowo Beds), below the lower sequence boundary. Of note is the negative excursion (= ‘initial’) with two conspicuous negative sub-peaks (−29.38 ‰ δ13Corg at 691 m and −28.85 ‰ δ13Corg at 686 m) separated by more positive values (~ −26 ‰ between 686 m and 691 m), a subsequent more positive excursion (−23.67 ‰ δ13Corg at 681.5 m) and a second less conspicuous negative excursion beginning at 678.6 m, followed above the upper sequence boundary at 678.4 m by a slight trend towards more positive values in the interval 676.9–677.5 m, followed by an uncored section between 676.5 and 653.4 m, for which there are no data. These trends are correlated with Hungarian, UK and Austrian isotopic profiles, after Hesselbo et al. (Reference Hesselbo, Robinson, Surlyk and Piasecki2002), Hillebrandt et al. (Reference Hillebrandt, Krystyn, Kürschner, Bown, McRoberts, Uhl, Simms, Tomasovych and Ulrichs2007), Pálfy et al. (Reference Pálfy, Demeny, Haas, Carter, Gorog, Halasz, Oravecz-Scheffer, Hetenyi, Marton, Orchard, Ozsvart, Veti and Zajzon2007), Ruhl, Kürschner & Krystyn (Reference Ruhl, Kürschner and Krystyn2009), Ruhl, Veld & Kürschner (Reference Ruhl, Veld and Kürschner2010) and Korte et al. (Reference Korte, Hesselbo, Jenkyns, Rickaby and Spötl2009) (Fig. 7). Two measurements obtained from the section between 649.8 and 653.4 m show less negative values. Most likely, the upper (= ‘main’) negative excursion occurs somewhere within the uncored section between 653.4 and 686.5 m. The uppermost section, containing both continental and brackish-marine sediment is correlated with the Planorbis Zone (see Pieńkowski, Reference Pieńkowski2004).
Carbon isotope curve with major excursions in the Kamień Pomorski IG-1 section.
Correlation of δ13C excursions and sequence boundaries from the Kamień Pomorski IG-1 section with the major correlative horizons in marine Triassic–Jurassic sections. ‘Initial’ δ13C excursion is shadowed; note bi-partite character of the excursion in Kamień Pomorski, Csövár and Kuhjoch. T–J boundary is correlated with the minor subordinate negative δ13C peak within the positive excursion observed in St Audrie's Bay (Korte et al. Reference Korte, Hesselbo, Jenkyns, Rickaby and Spötl2009) and Kuhjoch in marine sections. Modified from Hesselbo et al. Reference Hesselbo, Robinson, Surlyk and Piasecki2002; Pálfy et al. Reference Pálfy, Demeny, Haas, Carter, Gorog, Halasz, Oravecz-Scheffer, Hetenyi, Marton, Orchard, Ozsvart, Veti and Zajzon2007; Kürschner, Bonis & Krystyn, Reference Kürschner, Bonis and Krystyn2007; Ruhl, Kürschner & Krystyn, Reference Ruhl, Kürschner and Krystyn2009; Korte et al. Reference Korte, Hesselbo, Jenkyns, Rickaby and Spötl2009. Placement of the T–J boundary (T–J b.) based on Korte et al. (Reference Korte, Hesselbo, Jenkyns, Rickaby and Spötl2009).
The method allowed visual observations of the residue and indicated that the palynofacies comprise mainly phytoclasts (wood, cuticle) and miospores. As the assemblages are made up of materials that originate in the terrestrial environment, the carbon isotope composition is an integrated representation of the standing vegetation, and thus also of the contemporaneous atmospheric carbon dioxide (see Hasegawa, Reference Hasegawa1997; Jahren, Arens & Harbeson, Reference Jahren, Arens and Harbeson2008). Alternatively, changes in the bulk C-isotope signature of the continental section can be explained by changes in the source of the terrestrial sedimentary organic matter, as observed among some contemporaneous terrestrial primary producers (Killops & Killops, Reference Killops and Killops2005; Tyson, Reference Tyson1995). However, our material taken for carbon isotope analysis comes exclusively from the phytoclast (wood) fraction, which minimizes the risk of a large variation in C-isotope composition caused by heterogeneity of the organic source. Also charcoal shows no fractionation of carbon isotopes in comparison with wood (phytoclast fraction). Moreover, the surrounding palaeogeography was a rather flat, relatively uniform landscape without dramatic altitude contrasts (Pieńkowski, Reference Pieńkowski2004), which precludes one of major factors of recent C-isotope fractionation, i.e. altitude of growth of parent plants (Killops & Killops, Reference Killops and Killops2005).
Whilst it is inevitable that the data obtained are far from being of a high-resolution character, at least the existence of the ‘initial’ isotope excursion (luckily, occurring in a quite expanded section of c. 7 m) can be proven with five samples, of which two show markedly negative values. Such values clearly indicate a major carbon isotope excursion. Considering its stratigraphical position, it is inconceivable that it could represent something other than the ‘initial’ isotope excursion.
4.c. Osmium/rhenium isotope system and iridium content
Herein we present the first suite of osmium/rhenium isotope data from the continental deposits across the T–J boundary, as well as iridium content, which can help resolve the question of a hypothetical impact and furnish evidence of igneous activity at that time. The dataset obtained from nine samples is presented in Table 1 and Figure 8. Table 1 presents both measurements of recent Re/Os isotopic contents and ratios, and the corrected, initial isotopic ratios. The calculations of initial ratios are necessary to avoid spurious isotope ratios. Firstly, the isotope186Os is unstable and contemporary results do not reflect the Early Jurassic values. Secondly, the radiogenic isotope 187Os is a product of the radiogenic decay of 187Re, according to the formula 187Re → 187Os + e−. Therefore, the measurements of 187Re (source of the radiogenic 187Os) were used to calculate the initial (= original) content of the radiogenic 187Os isotope, assuming the latest Triassic–earliest Jurassic age of the samples is c. 200 Ma. The higher the content of 187Os is, the more radiogenic the Os-isotope ratios are. Particularly important data, such as content of non-radiogenic osmium isotope 192Os and two ratios of osmium isotopes, 187Os/186Os and 187Os/188Os (marked in bold in Table 1), are presented in Figure 8. Content of 192Os, the most common non-radiogenic osmium isotope, is thought to be mainly derived from igneous activity (Cohen & Coe, Reference Cohen and Coe2002, Reference Cohen and Coe2007; Kuroda et al. Reference Kuroda, Hori, Suzuki, Gröcke and Ohkouchi2010). Also, a negative shift in 187Os/188Os values suggests input of non-radiogenic Os of mantle (or extraterrestrial) origin or a reduction in continentally derived Os or both (Cohen & Coe, Reference Cohen and Coe2002; Kuroda et al. Reference Kuroda, Hori, Suzuki, Gröcke and Ohkouchi2010).
Changes in the iridium content and osmium isotopic system (Table 1) in the Kamień Pomorski IG-1 section (lithological column and main features of δ13C on the left). Correlation with and polycyclic aromatic hydrocarbon (PAH) and TOC changes (after Marynowski & Simoneit, Reference Marynowski and Simoneit2009, supplementary data) is shown. Levels with darkened miospores (see Fig. 3) are arrowed. Note two disturbance levels in the osmium isotope system concomitant with carbon isotope disturbances, PAH shifts and darkened colour of the miospores. The uppermost PAH shift is not related to carbon and Os-isotope disturbances; thus it is probably purely a wildfire effect.
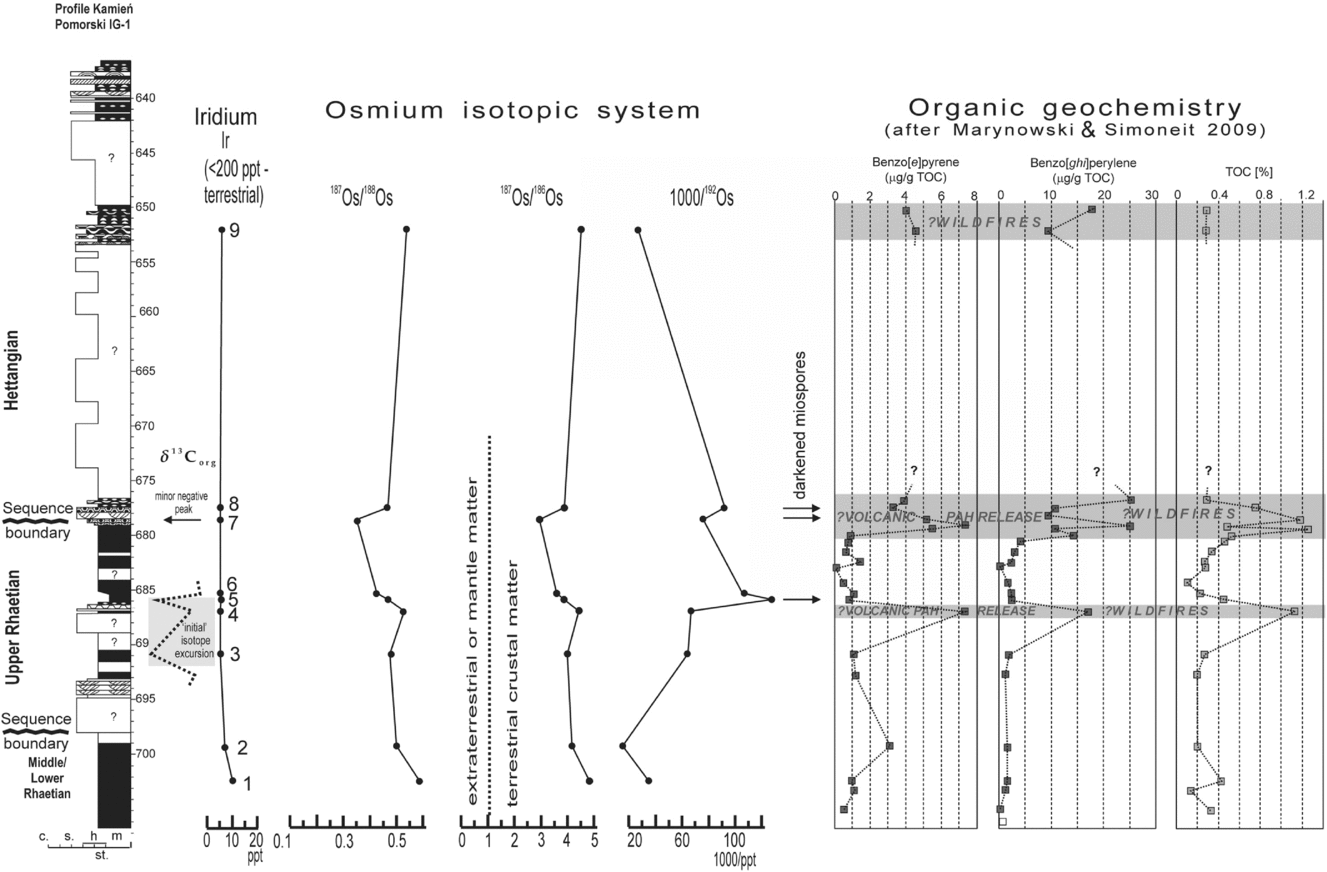
Obtained results (Table 1; Fig. 8) show that the 187Os/188Os and 187Os/186Os ratios decrease upwards in the studied section, up to the sequence boundary at 678.4 m. Particularly sharp decreases are connected with carbon isotope excursions (higher ‘subpeak’ of the ‘initial’ excursion at 686 m and a minor negative peak at 678.6 m) just below the T–J and sequence boundary. Higher up in the profile, the187Os/188Os and 187Os/186Os ratios in Hettangian section return to positive values. The stable 192Os results show a marked increase of 192Os at a depth of 686 m (concomitant with the higher ‘subpeak’ of the ‘initial’ isotope excursion) and a less marked increase at a depth of 677.5 m (just above the sequence boundary and inferred T–J boundary). Then, the content of 192Os drops back to the Lower–Middle Rhaetian values (one sample at depth 652.1 m). The first (older) increase of the 192Os content at depth 686 m coincides with a drop in 187Os/188Os ratio (Fig. 8). The upper (later) increase of 192Os at 677.5 m is not coupled with a decrease in 187Os/188Os ratio. Interestingly, the disturbances in the Os isotopic system are coeval or almost coeval with two levels showing elevated polycyclic aromatic hydrocarbon (PAHs) contents (Marynowski & Simoneit, Reference Marynowski and Simoneit2009, who analysed organic geochemistry in the same samples). Their first PAH positive excursion slightly pre-dates (1 m below) the major Os excursions at the depth of 686 m, the second PAH excursion coincides with the less marked excursions at the T–J boundary (677.5–678.6 m) and the third PAH disturbance at 652 m (Hettangian) is not related to any Os system disturbance (Fig. 8).
In the samples studied, all the values of the initial ratio of 187Os/186Os are around 3 or higher (Table 1; Fig. 8).
Additionally, iridium content was measured, and all the values were very low, below 10 ppt (Fig. 8).
5. Discussion
5.a. Palynology: palynofloral turnover and palaeoclimatic background
The T–J boundary is historically the least well studied of the all faunal mass extinction events and has been particularly lacking data with regard to plant palaeoecology. However, available information hints at a major palaeoecological disturbance of plant communities. Dating of the extinction event was and still is a much debated issue (e.g. Fowell & Olsen, Reference Fowell and Olsen1993; van Veen, Reference Van Veen1995; Olsen et al. Reference Olsen, Kent, Sues, Koeberl, Huber, Montanari, Rainforth, Fowell, Szajna and Hartline2002; Lucas & Tanner, Reference Lucas and Tanner2007). In his seminal work, Harris (e.g. Harris, Reference Harris1937) described fossil flora of the Scoresby Sund (East Greenland), and he distinguished two palynofloral assemblages: a Rhaetian Lepidopteris Zone and a Hettangian Thaumatopteris Zone. Studies of plant taxonomic ranges have revealed that up to 90% of species became locally to regionally extinct across North America (Cornet & Olsen, Reference Cornet, Olsen and Weber1985; Fowell & Olsen, Reference Fowell and Olsen1993) and Greenland (Pedersen & Lund, Reference Pedersen and Lund1980; McElwain, Beerling & Woodward, Reference McElwain, Beerling and Woodward1999; McElwain et al. Reference McElwain, Popa, Hesselbo, Haworth and Surlyk2007). In Greenland, considerable changes in the dominance and diversity structure of Triassic forests have been identified before the T–J boundary. Triassic communities of Podozamites, a broad-leafed conifer, and bennetites (Pterophyllum and Anomozamites) were replaced by lower diversity and less even (i.e. more dominant) forests, overwhelmingly dominated by taxa that had been relatively minor components of Late Triassic forests: Czekanowskia, Sphenobaiera and an osmundaceous fern (Todites) (McElwain et al. Reference McElwain, Popa, Hesselbo, Haworth and Surlyk2007; McElwain, Wagner & Hesselbo, Reference McElwain, Wagner and Hesselbo2009). Importantly, a climate-driven shift from a prevalence of broad-leaved taxa to a predominantly narrow-leaved assemblage contributed to increased fire activity at the T–J boundary in Greenland (Belcher et al. Reference Belcher, Mander, Rein, Jervis, Haworth, Hesselbo, Glasspool and McElwain2010a). However, estimates of diversity loss based on macrofossils are typically much higher than estimates of diversity loss based on miospores (Mander, Kürschner & McElwain, Reference Mander, Kürschner and McElwain2010). The authors explained that conflicting records of diversity loss obtained from plant macrofossils and sporomorphs are caused by the absence of reproductively specialized plants, including cycads, bennetites and the seed-fern Lepidopteris, from the palynofloral record. Moreover, current reports from Europe and the Tethyan domain (Kürschner & Herngreen, Reference Kürschner, Herngreen and Lucas2010; Cirilli, Reference Cirilli and Lucas2010) show that palynofloral composition between the Late Triassic and Hettangian was gradual and without abrupt changes and consequently claimed that the end-Triassic biotic crisis appears to have little affected palynofloral species diversity, at least in Europe. On the other hand, in North America high-diversity pollen assemblages comprising monosulcates and monosaccates give way to lower-diversity assemblages dominated by Classopollis, a pollen type normally associated with hot and/or arid climate conditions, and palynofloral diversity loss is estimated at about 60% (Fowell & Olsen, Reference Fowell and Olsen1993; Lucas & Tanner, Reference Lucas and Tanner2007). These low-diversity pollen assemblages are confined to within 21000 years before the T–J boundary in eastern North America as defined by a fern spike (Fowell & Olsen, Reference Fowell and Olsen1993) and negative carbon isotope excursion. Recently, the fern spike has been correlated with the ‘initial’ carbon isotope excursion and end-Triassic extinction (Whiteside et al. Reference Whiteside, Olsen, Eglinton, Brookfield and Sambrotto2010).
In Kamień Pomorski the palynofloral turnover coincides with the sequence boundary at 678.4 m. Twenty new taxa appear just above this boundary and within 2 m above it. Some typically Rhaetian spores pass into the strata immediately above the sequence boundary, but they show rapid decrease in frequency (Cingulizonates rhaeticus and Limbosporites lundblandii) and quickly disappear. Importantly, the index pollen grain Cerebropollenites thiergartii appears just at the sequence boundary. Several characteristic Jurassic taxa (Concavisporites intrastriatus, Concavisporites umbonatus, Conbaculatisporites mesozoicus, Dictyophyllidites mortoni, Zebrasporites interscriptus and Cerebropollenites thiergartii) show continuity throughout the rest of the Hettangian profile studied herein. Chordasporites platysaccus, Pinuspollenites minimus and Vitreisporites pallidus appear already in the Rhaetian strata and continue through the Jurassic section. As was previously mentioned, a hiatus at the sequence boundary could exist, which would make the transition perhaps appear more abrupt than it actually is.
The Rhaetian assemblage from Pomerania (which is referred to here as the Cingulizonathes rhaeticus–Limbosporites lundblandii association; Fig. 5) can be compared to other biostratigraphical/palynological zones in Europe, both in Tethyan and epicontinental domains (Fig. 5; Table 2; see Bonis, Kürschner & Krystyn, Reference Bonis, Kürschner and Krystyn2009; Lund, Reference Lund1977; Pedersen & Lund, Reference Pedersen and Lund1980; Kürschner, Bonis & Krystyn, Reference Kürschner, Bonis and Krystyn2007). Also in the previous works from Poland (Orłowska-Zwolińska, Reference Orłowska-Zwolińska1983, Reference Orłowska-Zwolińska1985; Marcinkiewicz & Orłowska-Zwolińska, Reference Marcinkiewicz and Orłowska-Zwolińska1994) Limbosporites lundblandii (along with Cingulizonathes rhaeticus and Semiretisporis gothae) are regarded as the most common and characteristic Rhaetian forms in Poland.
Occurrences of miospores from Kamień Pomorski in other regions of Europe
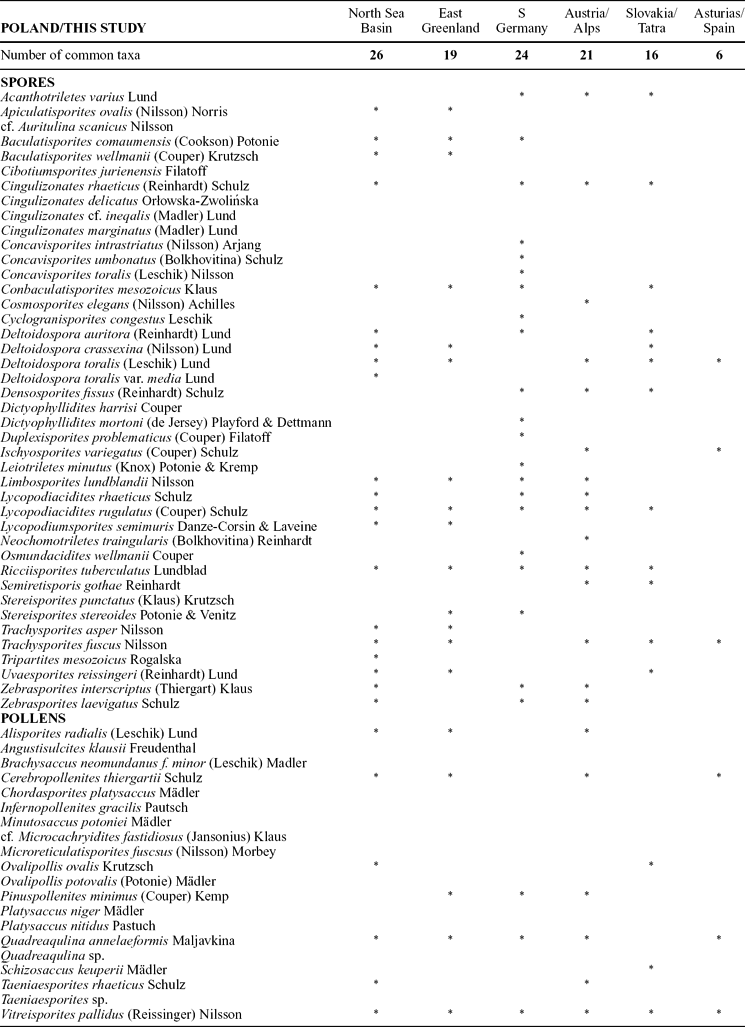
Note clear difference with Asturias, Spain, pointing to provincialism between North-Central Europe and the Mediterranean area.
The narrow interval between 677 and 680.9 m (Fig. 3) could represent the transitional Ricciisporites–Polypodiisporites (Lund, Reference Lund1977) or Trachysporites–Porcellispora Zone (Kürschner, Bonis & Krystyn, Reference Kürschner, Bonis and Krystyn2007), although in Pomerania the transitional assemblage cannot be clearly distinguished. Only Ricciisporites tuberculatus and Ovalipollis ovalis occur exclusively within this transitional zone, at the same time crossing the inferred Rhaetian–Hettangian boundary.
The Hettangian assemblage in Pomerania is referred to here as the Conbaculatisporites mesozoicus–Dictyophyllidites mortoni–Cerebropollenites thiergartii association (Fig. 5). All three miospore taxa characterizing Hettangian strata in Pomerania are widespread and characteristic forms, known from most of the important T–J profiles (Lund, Reference Lund1977; Barrón et al. Reference Barrón, Gómez, Goy and Pieren2006; Kürschner, Bonis & Krystyn, Reference Kürschner, Bonis and Krystyn2007; Bonis, Kürschner & Krystyn, Reference Bonis, Kürschner and Krystyn2009 and others; Fig. 5; Table 2). Dictyophyllidites mortoni, Lycopodiumsporites semimuris and Trachysporites fuscus were listed by Fijałkowska (Reference Fijałkowska1989) as characteristic Hettangian forms from central Poland. The two cored sections, 635–642.1 m and 649.8–653.4 m, show continuity of the Jurassic palynological assemblage (eight taxa continue), although 20 new taxa are reported from these two sections. However, these new taxa do not represent any new groups of plants at a higher taxonomic level, and are still represented by Lycopodiacea (Uvaesporites, Lycopodiacidites, Lycopodiumsporites), Pteridophyta (ferns Apiculatisporites, Baculatisporites, Cibotiumsporites, Concavisporites, Cosmosporites, Ischyosporites, Lycopodiacidites, Polycingulatisporites, Stereisporites, Trachysporites, Zebrasporites) plus Bryophyta (rare Stereisporites) as chief parent plants for spores, and Coniferophyta (Pinaceae, Podocarpaceae, Caytoniales) representing parent plants of the pollen grains (Alisporites, Microcachryidites, Quadraeculina, Vitreisporites). As mentioned above, palynofacies and miospore spectra in these two sections from Kamień Pomorski are chiefly dictated by palaeoenvironmental factors, i.e. shifting nearshore-marginal marine depositional environments. Palynofacies thus reflect flooding (transgressive)-progradation cyclicity (Fig. 3): flooding events result in relatively poorer palynomacerals with less abundant miospores and more abundant Acritarcha (interval 649.8–653.4 m), while progradational deltaic–barrier/lagoonal facies (representing delta plain–lagoon/marsh environments) show rich palynomacerals with abundant miospores, particularly spores produced by local hydrophilic plants (interval 637.2–642.4 m). Moreover, some minor fluctuations of palynofacies from lagoonal/interdistributary–delta plain environments, reflecting probable seasonal changes, have been described from the section between 637.2 and 642.4 m depth (Pieńkowski, Reference Pieńkowski2004; Pieńkowski & Waksmundzka, Reference Pieńkowski and Waksmundzka2009).
Comparison of T–J spores described in the present paper show a significant number of common taxa with the adjacent sedimentary basins and the Northern Tethys domain (Table 2). In contrast, there are only six taxa in common with the profiles in Asturias, Spain (of 43 listed there; Barrón et al. Reference Barrón, Gómez, Goy and Pieren2006) and very few (4–6) with the British profiles (Warrington & Harland, Reference Warrington and Harland1975; Warrington, Cope & Ivimey-Cook, Reference Warrington, Cope and Ivimey-Cook1994), but only 20 to 33 miospore taxa were identified in the British profiles at St Audrie's and Larne. Even fewer taxa occur in common with the North American sections (Cornet & Olsen, Reference Cornet, Olsen and Weber1985; Fowell & Olsen, Reference Fowell and Olsen1993; Cirilli et al. Reference Cirilli, Marzoli, Tanner, Bertrand, Buratti, Jourdan, Bellieni, Kontak and Renne2009). Absence of the otherwise widespread thermophilic pollen Corollina sp. (Classopollis sp.) is notable; these pollen were noted in central Poland, some 700 km SE from Kamień Pomorski (Fijałkowska, Reference Fijałkowska1992; Marcinkiewicz & Orłowska-Zwolinska, Reference Fowell and Olsen1994; Ziaja, Reference Ziaja2006). These pollen show very low frequencies in some other regions (i.e. East Greenland), which was attributed to palaeogeographic factors (Pedersen & Lund, Reference Pedersen and Lund1980).
Comparison with other profiles also shows that a few stratigraphically indicative forms found in Kamień Pomorski (such as spores Cingulizonathes rhaeticus, Conbaculatisporites mesozoicus, Limbosporites lundblandii, Ricciisporites tuberculatus, Deltoidospora toralis, Trachysporites fuscus and pollen grains Cerebropollenites thiergartii, Minutosaccus potoniei, Pinuspollenites minimus) are more cosmopolitan than other miospores (Table 2). Collectively, these facts suggest some provinciality of the T–J palynofloral assemblages.
Perhaps, this provinciality and changing local climatic and palaeoenvironmental conditions could provide explanations for the conflicting records of T–J palynofloral turnover. Mander, Kürschner & McElwain (Reference Mander, Kürschner and McElwain2010) and Kürschner & Herngreen (Reference Kürschner, Herngreen and Lucas2010) played down the scale of this turnover, pointing to emigration and/or extirpation of taxa rather than immigration and/or origination of taxa. According to these authors, the end-Triassic biotic crisis appears to have little affected palynofloral species diversity in Europe and Greenland. However, similarly to Fowell & Olsen (Reference Fowell and Olsen1993), we report quite a marked palynofloral turnover at the T–J boundary. Influence of rather minor erosion and a potential missing section at the sequence boundary in Kamień Pomorski does not provide a sufficient explanation. Perhaps, differences between T–J palynofloral assemblages could be regionally enhanced (or the opposite, masked) by changing climatic or taphonomic conditions. This issue needs further studies.
Interestingly, the palynofloral turnover, which coincides with the sequence boundary at 678.4 m, was not, at least not directly, related with crucial change in humidity of the climate: the climate was generally humid throughout deposition of the whole 677–680.9 m interval, which is proven by the presence of rich drifted floral remains, coalified plant roots and a huge amount of spores produced by Lycopodiacea (Selaginellaceae: Limbosporites, Lycopodiumsporites) and Pteridophyta (ferns Cyatheaceae/Dicksoniaceae: Cibotiumsporites, Concavisporites; Dipteridaceae: Conbaculatisporites, Deltoidospora; Matoniacea: Dictyophyllidites; Osmundacea: Baculatisporites; Schizaceae: Duplexisporites). On the other hand, the presence of Coniferophyta (Pinaceae, Podocarpaceae) is proven by the presence of pollen grains such as Ovalipollis potovalis, Quadraeculina sp. and Platysaccus niger below the sequence boundary (Rhaetian section) and Cerebropollenites thiergartii and Taeniasporites sp. above this boundary (Hettangian section). If a rapid increase in humidity was not a direct factor in this marked turnover, then there must have been other environmental factors responsible for the palynofloral change in our material. Climatic changes, including a general increase in humidity, commenced above the first sequence boundary at 698 m. Judging from changes in leaf morphology and decreases in stomatal indices, McElwain, Beerling & Woodward (Reference McElwain, Beerling and Woodward1999) postulated a fourfold increase in atmospheric CO2 resulting in global warming and sudden loss of Late Triassic biodiversity, for example in East Greenland, a climate-driven shift from broad-leaved to narrow-leaved taxa and resulting fire activity at the T–J boundary (McElwain, Wagner & Hesselbo, Reference McElwain, Wagner and Hesselbo2009; Belcher et al. Reference Belcher, Mander, Rein, Jervis, Haworth, Hesselbo, Glasspool and McElwain2010a). Similarly, increased content of other greenhouse gases such as methane (Hesselbo et al. Reference Hesselbo, Robinson, Surlyk and Piasecki2002) may have contributed to the climate warming. On the other hand, Hubbard & Boulter (Reference Hubbard and Boulter2000) argued for a dramatic series of global temperature oscillations, including at least one colder/drier period at or just above the T–J boundary. Schoene et al. (Reference Schoene, Guex, Bartolini, Schaltegger and Blackburn2010) postulated global cooling and glaciations associated with the end-Triassic extinction period. These contradicting results suggest that the contrasts of Late Triassic climates may have been dramatic enough to trigger radical biological and ecological changes (Hubbard & Boulter, Reference Hubbard and Boulter2000; van de Schootbrugge et al. Reference Van de Schootbrugge, Quan, Lindström, Püttmann, Heunisch, Pross, Fiebig, Petschick, Röhling, Richoz, Rosenthal and Falkowski2009). Indeed, dramatic release of SO2 and sulphate aerosols (causing climate cooling), following release of CO2 and methane (causing climate warming), with additional release of toxic pollutants such as PAHs, could have most likely been the final blow to the highly stressed end-Triassic ecosystem, as was postulated by van de Schootbrugge et al. (Reference Van de Schootbrugge, Quan, Lindström, Püttmann, Heunisch, Pross, Fiebig, Petschick, Röhling, Richoz, Rosenthal and Falkowski2009) and Deenen et al. (Reference Deenen, Ruhl, Bonis, Krijgsman, Kürschner, Reitsma and Van Bergen2010). The spore/pollen ratio in the critical boundary section between 677 and 680.9 m (Fig. 3) shows marked fluctuations expressed in palynofacies (Fig. 3), which suggest rapid climate (temperature) changes just below and at the T–J transition. Additionally, darkening of spores observed in this interval, particularly in three samples (Figs 3, 8), could have been caused by soil acidification from sulphuric acid rains during CAMP eruptions (van de Schootbrugge et al. Reference Van de Schootbrugge, Quan, Lindström, Püttmann, Heunisch, Pross, Fiebig, Petschick, Röhling, Richoz, Rosenthal and Falkowski2009). On the other hand, contrasting miospore colours in one sample, named by Pieńkowski & Waksmundzka (Reference Pieńkowski2009) as palynofacies inversion no. 1, can be attributed to the early burial setting: miospores showing darker colours temporarily went through an early diagenetic cycle, commonly in the swamp/marshy environment, and after becoming darker they were redeposited again to be finally incorporated into the sediment. At the same time, the ‘background’ (lighter) miospores were delivered to the sediment directly from parent plants.
The presence of charcoal and the organic geochemistry indicate that despite the humid climate, forest fires occurred on the surrounding lands (Pieńkowski & Waksmundzka, Reference Pieńkowski and Waksmundzka2009; Marynowski & Simoneit, Reference Marynowski and Simoneit2009). A dramatic rise in fire activity has been recently attributed to the dominance of narrow-leaved plants coupled with increased lightening strikes in the much warmer climate at the beginning of the Jurassic period (Belcher et al. Reference Belcher, Mander, Rein, Jervis, Haworth, Hesselbo, Glasspool and McElwain2010a). Noteworthy is that concentrations of atmospheric oxygen reconstructed from recent experimental burn studies using the GEOCARBSULF (Belcher & McElwain, Reference Belcher and McElwain2008) and sedimentary charcoal concentration (Glasspool & Scott, Reference Glasspool and Scott2010) challenged the previous model estimates of a very low concentration of atmospheric O2, ~ 12–13%, during Late Triassic and Early Jurassic time (Berner, Reference Berner2006; Algeo & Ingall, Reference Algeo and Ingall2007). The new estimates show that the lower O2 limit for combustion should be increased from 12% to at least 15% (Belcher & McElwain, Reference Belcher and McElwain2008) or 16% (Belcher et al. Reference Belcher, Yearsley, Hadden, Mcelwain and Rein2010b), and based on concentration of charcoal, O2 atmospheric concentration was much higher, about 25% (Glasspool & Scott, Reference Glasspool and Scott2010). Concerning charcoal concentration, one should take notice that charcoal produced by wildfires was widely redeposited (owing to its resistance to biogenic degradation and buoyancy) and commonly shows an elevated concentration (in comparison to other palynomacerals) in high-energy environments and younger sediments. Reworking and redeposition of charcoal in high-energy environments occurred not only in alluvial environments (Marynowski & Simoneit, Reference Marynowski and Simoneit2009), but also occurred in other environments, such as nearshore; therefore, fossil charcoal abundance should be taken with some caution as an ‘in situ’ indicator of wildfire frequency (Pieńkowski & Waksmundzka, Reference Pieńkowski and Waksmundzka2009).
In addition, we would like to point out that release of toxic pollutants such as SO2, sulphate aerosols and PAHs certainly led to defoliation, which increased forest flammability and resulting fire activity, similar to the climate-driven shift from broad-leaved to narrow-leaved taxa at the T–J boundary (McElwain, Wagner & Hesselbo, Reference McElwain, Wagner and Hesselbo2009; Belcher et al., Reference Belcher, Mander, Rein, Jervis, Haworth, Hesselbo, Glasspool and McElwain2010a).
5.b. Carbon isotopes
Terrestrial organic matter displays significant interspecific variation in isotopic composition owing to variations in the organic composition and/or pedogenic processes; thus it may be argued that only a compound-specific analysis is likely to reveal an atmospheric change in isotopic composition (Kürschner, Bonis & Krystyn, Reference Kürschner, Bonis and Krystyn2007; Ruhl, Kürschner & Krystyn, Reference Ruhl, Kürschner and Krystyn2009; Ruhl, Veld & Kürschner, Reference Ruhl, Veld and Kürschner2010). The obtained results reflect carbon-cycle disturbances in the atmospheric system from a limited set of plant organs. Therefore, the isotope data obtained from the palynomaceral separates (i.e. separated phytoclasts) may be the most reliable, although obtained by a very arduous method.
The carbon isotope excursions (CIEs) at the T–J boundary interval are known from many (mostly marine) successions from several continents from low to mid palaeolatitudes, and provide a robust and reproducible means of correlation. The CIE is well documented at several other former GSSP candidates including St Audrie's Bay, UK (Hesselbo et al. Reference Hesselbo, Robinson, Surlyk and Piasecki2002), Larne, Northern Ireland (Simms & Jeram, Reference Simms and Jeram2006), Queen Charlotte Islands (Kunga Island and Kennecott Point combined), British Columbia (Ward et al. Reference Ward, Haggart, Carter, Wilbur, Tipper and Evans2001, Reference Ward, Garrison, Haggart, Kring and Beattie2004; Williford et al. Reference Williford, Ward, Garrison and Buick2007), and numerous sites in Austria, including Kendelbachgraben and Tiefengraben and particularly at Kuhjoch, the GSSP for the base of the Jurassic System (Kürschner, Bonis & Krystyn, Reference Kürschner, Bonis and Krystyn2007; Ruhl et al. Reference Ruhl, Kürschner, Reichart and Krystyn2007; Hillebrandt et al. Reference Hillebrandt, Krystyn, Kürschner, Bown, McRoberts, Uhl, Simms, Tomasovych and Ulrichs2007). At most localities the CIE is divided into two excursions: the lower (‘initial‘) and the upper (‘main’, although not so well characterized), separated by a positive excursion. Of note is also another negative CIE observed in older Rhaetian strata (i.e. the Westbury Fm in St Audrie's Bay, see Hesselbo et al. Reference Hesselbo, Robinson, Surlyk and Piasecki2002). Possibly, the most marked excursion from the Westbury Fm corresponds to the oldest excursion observed in Kamień Pomorski at the depth of 699.3 m (Fig. 6). Furthermore, the position of the sequence boundaries (emergence surfaces or lowstand deposits) in St Audrie's Bay, Kuhjoch and Csövár and the most prominent sequence boundary in Kamień Pomorski at 698 m provide additional correlative constraints, separating the older Rhaetian excursions from subsequent ‘initial’ excursion (Fig. 6). The ‘initial’ excursion, was regarded as so significant, that it prompted the suggestion that isotope stratigraphy may be used to define the position of the T–J boundary (Hesselbo et al. Reference Hesselbo, Robinson, Surlyk and Piasecki2002; Hesselbo, Robinson & Surlyk, Reference Hesselbo, Robinson and Surlyk2004). The advantage of choosing the CIE event is that it has been widely recognized in North America and Europe. However, the isotope excursions have not so far been described from South America. The disadvantage of adopting a carbon isotope marker is that it could become unrecognizable or distorted by the occurrence of minor gaps in the succession or by post-depositional alteration; errors in identification and correlation could occur, so independent biochronological corroboration will in all cases be required. In the UK at St Audrie's Bay, the ‘initial’ excursion is located slightly below the last occurrence of conodonts (top of the Cotham Member of the Lilstock Formation); in eastern North America the ‘initial’ excursion spans most of the prominent evolutionary events in the latest Rhaetian, such as the Newark (Passaic) palynofloral turnover and the first CAMP eruptions (Lucas & Tanner, Reference Lucas and Tanner2007; Korte et al. Reference Korte, Hesselbo, Jenkyns, Rickaby and Spötl2009; Deenen et al. Reference Deenen, Ruhl, Bonis, Krijgsman, Kürschner, Reitsma and Van Bergen2010; Whiteside et al. Reference Whiteside, Olsen, Eglinton, Brookfield and Sambrotto2010). The above observations show that the ‘initial’ carbon isotope excursion is of great correlative significance and it coincides with the onset of magmatism in the CAMP and onset of the Late Rhaetian extinction level (Deenen et al. Reference Deenen, Ruhl, Bonis, Krijgsman, Kürschner, Reitsma and Van Bergen2010; Whiteside et al. Reference Whiteside, Olsen, Eglinton, Brookfield and Sambrotto2010).
In the Kamień Pomorski continental succession, this marked ‘initial’ negative CIE occurs at a depth of ~ 685–692 m, spanning some 7 m of sediments (Fig. 6) and is located within the range of the typical Rhaetian miospores (Fig. 4). Two negative sub-peaks of the ‘initial’ negative excursion, separated by a more positive value, are observed (although only in three samples). Judging from the values of δ13C and its stratigraphical position, the ‘bi-partite’ character of the ‘initial’ excursion can be tentatively compared to the isotope curves obtained from many Late Rhaetian marine sections: Pálfy & Dosztály (Reference Pálfy and Dosztaly2000), Pálfy et al. (Reference Pálfy, Demeny, Haas, Hetenyi, Orchard and Veto2001, Reference Pálfy, Demeny, Haas, Carter, Gorog, Halasz, Oravecz-Scheffer, Hetenyi, Marton, Orchard, Ozsvart, Veti and Zajzon2007), Götz et al. (Reference Götz, Ruckwied, Pálfy and Haas2009) in Hungary; Ward et al. (Reference Ward, Garrison, Williford, Kring, Goodwin, Beattie and McRoberts2007) and Hesselbo, McRoberts & Pálfy (Reference Hesselbo, McRoberts and Pálfy2007) in Nevada, USA; Hesselbo et al. (Reference Hesselbo, Robinson, Surlyk and Piasecki2002) in Greenland, and Ruhl, Veld & Kürschner (Reference Ruhl, Veld and Kürschner2010) in the Northern Calcareous Alps (even if the section including the ‘initial’ negative excursion is highly condensed there).
Next, the higher section between 681 and 685 m is characterized by more positive values (−26.0, −26.5 and particularly a −24.0 positive peak at 681.5 m). Above 681.5 m there is a trend back towards more negative values (−25.5, −26.0), with a slight return to more positive values at 676.9–677.5 m. The most positive peak at 681.5 m we correlate with the lower part of the positive excursion at St Audrie's Bay, separating the ‘initial’ and ‘main’ negative isotope excursions (Hesselbo et al. Reference Hesselbo, Robinson, Surlyk and Piasecki2002).
Recently, Korte et al. (Reference Korte, Hesselbo, Jenkyns, Rickaby and Spötl2009, fig. 1c) have correlated the carbon isotope curves from St Audrie's Bay and Kujoch, placing the T–J boundary at a secondary negative peak within the positive isotope excursion, i.e. at the top of Langport Member and Lilstock Formation (Hesselbo et al. Reference Hesselbo, Robinson, Surlyk and Piasecki2002), although Ruhl, Kürschner & Krystyn (Reference Ruhl, Kürschner and Krystyn2009) and Deenen et al. (Reference Deenen, Ruhl, Bonis, Krijgsman, Kürschner, Reitsma and Van Bergen2010) still correlate the T–J boundary at Kujoch with the higher part of the section at St Audrie's (onset of the ‘main’ isotope excursion at St Audrie's or even the higher part of this profile). Based on miospores and megaspore evidence and succession of carbon isotope disturbances, we follow the correlation of Korte et al. (Reference Korte, Hesselbo, Jenkyns, Rickaby and Spötl2009). Consequently, the slight trend towards more negative values above the positive excursion at 681.5 m in Kamień Pomorski (Fig. 7) is correlated with the subordinate negative peak within the positive excursion at St Audrie's, adopted also as the geochemical marker of the T–J boundary (Korte et al. Reference Korte, Hesselbo, Jenkyns, Rickaby and Spötl2009). Again, it should be borne in mind that some section in Kamień Pomorski could be missing at the sequence boundary.
The second negative excursion is probably hidden within the uncored section between 653.5 and 676.5 m and correlation with Hettangian strata in the marine profiles of St Audrie's, New York Canyon and Tyrol is based on the appearance of Cerebropollenites thiergartii and a Jurassic palynomorph assemblage just above the Rhaetic palynomorph assemblage. The upper range of the ‘main’ isotopic excursion is unclear. In England (Hesselbo et al. Reference Hesselbo, Robinson, Surlyk and Piasecki2002), the top of the main excursion has not been documented; in the USA and Tyrol (Ward et al. Reference Ward, Garrison, Williford, Kring, Goodwin, Beattie and McRoberts2007; Hillebrandt et al. Reference Hillebrandt, Krystyn, Kürschner, Bown, McRoberts, Uhl, Simms, Tomasovych and Ulrichs2007; Kürschner et al. Reference Kürschner, Bonis and Krystyn2007; Ruhl et al. Reference Ruhl, Kürschner, Reichart and Krystyn2007) this excursion is terminated within the Lower Hettangian (Psiloceras planorbis chron), while in other profiles from Canada (Williford et al. Reference Williford, Ward, Garrison and Buick2007), this excursion extends stratigraphically higher than any other extant dataset and demonstrates that the ‘main’ isotope excursion does not represent a short event at all, but in fact a prolonged trend of isotopically light organic matter that extends well into the Sinemurian.
5.c. Rhenium/osmium isotopic system and iridium content
Obtained results (Table 1; Fig. 8), showing the decreasing trend of 187Os/188Os and 187Os/186Os values up to the sequence boundary at 678.4 m and increase (although not so stable) in 192Os values indicates an increase in the relative supply rate of non-radiogenic Os from the mantle, most probably associated with emplacement of the CAMP. The subsequent shift towards radiogenic values in Hettangian strata reflects an increased supply of radiogenic Os owing to enhanced continental weathering (Cohen & Coe, Reference Cohen and Coe2002, Reference Cohen and Coe2007; Kuroda et al. Reference Kuroda, Hori, Suzuki, Gröcke and Ohkouchi2010). A marked increase in the most common Os stable isotope (192Os), coupled with a decrease in both 187Os/188Os and 187Os/186Os and δ13C values (‘initial’ negative excursion) point to particularly intense volcanic activity at that level. 187Os/188Os and 187Os/186Os values further decrease to the top of Rhaetian strata (678.6 m), but the increase of 192Os is this time slighter and occurs about 1 m higher at 677.5 m. Cohen & Coe (Reference Cohen and Coe2002, Reference Cohen and Coe2007) and Kuroda et al. (Reference Kuroda, Hori, Suzuki, Gröcke and Ohkouchi2010) analysed the Os-isotope system in marine mudrock samples from St Audrie's Bay, UK, and pelagic deposits at Kurusu, Japan. These authors confirmed coincidence between the carbon-cycle disturbances and changes in the Os system reflecting volcanic activity versus continental weathering. Results obtained herein show that similar changes in the Os-isotope system occur also in the continental realm (fluvio-lacustrine environment) and are also linked with the carbon-cycle disturbances (particularly to the ‘initial’ one). In a continental environment, the herein reported decrease in the 187Os/188Os and increase in stable 192Os (Fig. 8) might point to the volcanic fallout, which must have been extensive enough to reach the Pomerania area, i.e. a distance of some 1500 km (at that time) from the CAMP (Cirilli et al. Reference Cirilli, Marzoli, Tanner, Bertrand, Buratti, Jourdan, Bellieni, Kontak and Renne2009; Muttoni et al. Reference Muttoni, Kent, Jadoul, Olsen, Rigo, Galli and Nicora2010; van de Schootbrugge et al. Reference Van de Schootbrugge, Quan, Lindström, Püttmann, Heunisch, Pross, Fiebig, Petschick, Röhling, Richoz, Rosenthal and Falkowski2009; Deenen et al. Reference Deenen, Ruhl, Bonis, Krijgsman, Kürschner, Reitsma and Van Bergen2010). Based on existing knowledge of the osmium isotopic system in the geological cycle, it is hard to point to an alternative explanation.
Moreover, van de Schootbrugge et al. (Reference Van de Schootbrugge, Quan, Lindström, Püttmann, Heunisch, Pross, Fiebig, Petschick, Röhling, Richoz, Rosenthal and Falkowski2009) indicated that the T–J boundary is marked by an enrichment of PAHs, which, in the absence of correlative charcoal peaks, the authors interpreted as an indication of incomplete combustion of organic matter by ascending flood basalt lava. Van de Schootbrugge et al. (Reference Van de Schootbrugge, Quan, Lindström, Püttmann, Heunisch, Pross, Fiebig, Petschick, Röhling, Richoz, Rosenthal and Falkowski2009) also observed that enrichment of PAHs was associated with darkening of miospores, likely caused by acid rains. The same changes (enrichment in PAHs and darkening of miospores) can be also observed in the Kamień Pomorski profile (Fig. 8). Marynowski & Simoneit (Reference Marynowski and Simoneit2009) performed organic geochemistry analyses in the same samples from Kamień Pomorski. According to them, three levels (one at 687 m within the ‘initial’ δ13C excursion, a second interval 676.9–679.4 m from the T–J transitional section and a third Hettangian interval 650–653 m) show elevated PAH concentrations, with phenanthrene, fluoranthene, pyrene and benzo[ghi]perylene being most abundant fractions (Marynowski & Simoneit Reference Marynowski and Simoneit2009, fig. 9 and supplementary data). Although charcoal is present throughout the Kamień Pomorski profile as dispersed, crushed and angular fragments, there are no peculiar charcoal concentrations which might be statistically correlated to the observed PAH peaks.
At the depths 686 m and 678.6 m, darkened (brown and orange-brown) miospores were observed (Figs 3, 8). Collectively, all these indicators (carbon and osmium isotopic system disturbances, darkened miospores and PAH concentrations) tend to support van de Schootbrugge et al. (Reference Van de Schootbrugge, Quan, Lindström, Püttmann, Heunisch, Pross, Fiebig, Petschick, Röhling, Richoz, Rosenthal and Falkowski2009), suggesting that the release of volcanic-derived pollutants such as sulphur dioxide and toxic compounds such as PAHs may have contributed to the observed δ13C, PAH and Os geochemical disturbances and resulting extinction. Wildfires would accomplish the whole scenario, although in our opinion PAHs were produced not only by local wildfires. Belcher et al. (Reference Belcher, Mander, Rein, Jervis, Haworth, Hesselbo, Glasspool and McElwain2010a) indicated increased fire activity at the T–J boundary in Greenland due to climate-driven floral changes, which is there additionally supported by a fivefold increase in the abundance of fossil charcoal in the earliest Jurassic. Similarly, wildfires also occurred during the T–J transitional time in Poland, as documented by Marynowski & Simoneit (Reference Marynowski and Simoneit2009) and Pieńkowski & Waksmundzka (Reference Pieńkowski and Waksmundzka2009).
Additionally, the Os isotopic system studied in nine samples (Table 1; Fig. 8) can also be indicative of the potential presence of extraterrestrial matter. The most common criteria applied in such studies are the detection of a positive siderophile element anomaly (enrichment of ejecta fallout matter in Os, Re, Ir and other siderophile elements at the ppb level) and the Re–Os isotopic system (187Os/186Os as well as 187Os/188Os ratios). As the Earth's crust is characterized by a highly radiogenic ratio of Os isotopes (high 187Os content) and meteorites are characterized by the opposite (non-radiogenic ratio of Os isotopes), the Os isotopic system is regarded as the most sensitive, thus the most reliable indicator of the presence of extraterrestrial matter in sediments (Geyh & Schleicher, Reference Geyh, Schleicher, Geyh and Schleicher1990; Dickin, Reference Dickin and Dickin1995; Faure, Reference Faure1986; Muñoz-Espadas, Martinez-Frias & Rosario, Reference Muñoz-Espadas, Martinez-Frias, Rosario, Koeberl and Muñoz-Espadas2003). An 187Os/186Os ratio of about 1.05–1.1 (Geyh & Schleicher, Reference Geyh, Schleicher, Geyh and Schleicher1990; Dickin, Reference Dickin and Dickin1995) and an 187Os to 188Os ratio of about 0.12–0.13 (Faure, Reference Faure1986; Muñoz-Espadas, Martinez-Frias & Rosario, Reference Muñoz-Espadas, Martinez-Frias, Rosario, Koeberl and Muñoz-Espadas2003) point to the presence of extraterrestrial matter (or alternatively, also of mantle-derived material); higher values are regarded as typical of the Earth's crust. This was first shown for the Cretaceous–Palaeogene boundary by Turekian (Reference Turekian1982), Luck & Turekian (Reference Luck and Turekian1983) and later in other analyses (Koeberl & Shirey, Reference Koeberl and Shirey1997; Koeberl, Reference Koeberl, Grady, Hutchison, McCall and Rothery1998). Based on elevated iridium content at the T–J boundary in the Newark Basin, Olsen et al. (Reference Olsen, Kent, Sues, Koeberl, Huber, Montanari, Rainforth, Fowell, Szajna and Hartline2002) hypothesized, that the T–J boundary supposed mass extinction was connected with an impact event and ejecta layer (recently, this view has been softened by Whiteside et al. Reference Whiteside, Olsen, Eglinton, Brookfield and Sambrotto2010).
In the samples studied, all the 187Os/186Os values (initial) are between 3.838 and 4.873, and 187Os/188Os ratio (initial) ranges between 0.427 and 0.586 (Table 1; Fig. 8). These results indicate that the Os isotopic system of the levels sampled is characteristic of typical crustal rocks, namely for the sediments derived most likely from the weathered Precambrian crystalline rocks. Furthermore, Ir content is less than 5 ppt (measurement sensitivity threshold), except for one sample (depth 703.2 m) where the Ir content was 7 ppt. In conclusion, the samples studied (in respect of the 187Os/186Os and 187Os/188Os ratio values as well as the Ir content) do not contain detectable extraterrestrial (or larger amounts of mantle) matter, which lends no support to the hypothesis of a large projectile impact at the T–J boundary.
6. Conclusions
The sequence of main stages in the formation of the continental section of Kamień Pomorski IG-1 can be summarized as follows:
(1) Early–Middle Rhaetian time was characterized by semi-dry alluvial plain sedimentation, a poor association of xeromorphic plants, red beds with carbonate pedogenesis, and at least one negative excursion on the background of less negative carbon isotope values.
(2) A sequence boundary, probably marking the lowest sea-level (and erosion base level), followed by fluvial sedimentation coupled with a change to grey colour and the accumulation of coaly matter, indicating a change in the hydrologic cycle, a prominent ‘initial’ negative isotope excursion in organic carbon (showing a bi-partite character), concomitant marked perturbation in the Os-isotope system (decrease in 187Os/188Os ratio, increase of stable 192Os), increase in PAHs and darkening of miospores. The palynofloral association is characterized by sparse pollen grains, which lends no support for rapid warming and humidification at this level.
(3) Positive shift in carbon isotope values.
(4) Slight shift towards more negative carbon isotope values, second (although less marked) change in the Os isotopic system, prevalence of spores (including a ‘fern peak’ just below the T–J boundary with markedly darkened miospores), humidification of climate at the top, a second sequence boundary, frequent changes in palynofacies and inferred palaeoclimatic fluctuations, and palynofloral turnover at the sequence boundary.
(5) Early–Middle Hettangian, brackish marine transgression in the Planorbis Zone, further diversification of miospores, and humid conditions.
Our analyses reveal: (1) background sediment deposition, with marked changes in the hydrologic cycle, pedogenic processes, palynofacies and colour of sediments, all pointing to gradual humidification of the climate in Late Rhaetian times, although these times were probably still punctuated by rapid and pronounced climatic fluctuations, as shown by the palynofacies and carbon isotope fluctuations; (2) the carbon isotope curve obtained from phytoclast palynomacerals, which shows significant fluctuations beginning already in the Early–Middle Rhaetian, continuing in the Late Rhaetian interval with a prominent bi-partite negative δ13Corg excursion, correlated with the ‘initial’ excursion, and a second, much less prominent excursion, indicating the T–J boundary; (3) the composition and diversification of the latest Triassic and earliest Jurassic palynological assemblages; a total of 63 well-preserved palynomorph taxa have been recorded: 42 spore taxa, 20 pollen taxa and 1 indeterminate acritarch; two assemblages of miospores have been distinguished: the latest Triassic Cingulizonathes rhaeticus–Limbosporites lundblandii association and earliest Jurassic Conbaculatisporites mesozoicus–Dictyophyllidites mortoni–Cerebropollenites thiergartii association with characteristic index taxa, i.e. C. thiergartii, marking the beginning of the Jurassic; comparison with other European records points to some provincialism of palynoflora; (4) regional palynofloral turnover, probably reflecting a turnover of ecological dominants between Triassic and Jurassic floral communities and marked structural changes in the vegetation as reflected by potential loss of the Late Triassic xerophilous plant species; (5) after the turnover at the T–J boundary, the Jurassic recovery of new species is well marked; (6) marked fluctuation in the Os-isotope system, concomitant with the negative δ13Corg excursions, PAH shifts (see Marynowski & Simoneit, Reference Marynowski and Simoneit2009), presence of darkened miospores and floral turnover interval, which collectively point to volcanic activity (volcanic fallout) (see van de Schootbrugge et al. Reference Van de Schootbrugge, Quan, Lindström, Püttmann, Heunisch, Pross, Fiebig, Petschick, Röhling, Richoz, Rosenthal and Falkowski2009); PAHs were produced also by local wildfires (Marynowski & Simoneit, Reference Marynowski and Simoneit2009; Pieńkowski & Waksmundzka, Reference Pieńkowski and Waksmundzka2009); (7) a lack of evidence for presence of extraterrestrial matter (osmium isotopic system, iridium content), which lends no support to the impact scenario at the T–J boundary.
Importantly, carbon and osmium isotope correlation and coeval increase in PAH content confirm that the release of pollutants such as sulphur dioxide and toxic compounds (PAHs) may have contributed to the perturbances in the climate and the crisis in the terrestrial biosphere, causing floral turnover (van de Schootbrugge et al. Reference Van de Schootbrugge, Quan, Lindström, Püttmann, Heunisch, Pross, Fiebig, Petschick, Röhling, Richoz, Rosenthal and Falkowski2009). The floral turnover period commenced at the ‘initial’ carbon isotope excursion, concomitant with the onset of CAMP volcanism. Most likely, periodical atmospheric loading by CO2, CH4 or, on the other hand, SO2 and sulphate aerosols and PAHs, related to eruptions of the CAMP, is inferred to have caused a series of rapid climatic reversals (including rapid temperature fluctuations, see Schoene et al. Reference Schoene, Guex, Bartolini, Schaltegger and Blackburn2010), directly influencing the ecosystem. Thus, instead of one catastrophic event, a series of rapid climatic changes (but spanning a relatively short time and thus difficult to register) may have caused the end-Triassic disturbances in ecosystems. In our opinion, the floral turnover period in the continental realm did not end at the ‘initial’ carbon isotope excursion (Whiteside et al. Reference Whiteside, Olsen, Eglinton, Brookfield and Sambrotto2010), but lasted approximately until the minor (secondary) negative excursion within the positive excursion, which is now correlated with the T–J boundary (Korte et al. Reference Korte, Hesselbo, Jenkyns, Rickaby and Spötl2009) and the intermediate unit (I.U.) of the Argana volcanic flow in Morocco (Marzoli et al. Reference Marzoli, Bertrand, Knight, Cirilli, Buratti, Verati, Nomade, Renne, Youbi, Martini, Allenbach, Neuwerth, Rapaille, Zaninetti and Bellieni2004, Reference Marzoli, Jourdan, Puffer, Cuppone, Tanner, Weems, Bertrand, Cirilli, Bellieni and De Min2011; Deenen et al. Reference Deenen, Ruhl, Bonis, Krijgsman, Kürschner, Reitsma and Van Bergen2010). Floral recovery began at the same time, but it is not clear to what extent it reflects the origination of taxa. Changes in both the carbon and osmium isotopic systems, coupled with PAH content, suggest that the biotic changes in the continental environment were compatible with a global crisis triggered by the near synchronous (Marzoli et al. Reference Marzoli, Jourdan, Puffer, Cuppone, Tanner, Weems, Bertrand, Cirilli, Bellieni and De Min2011) end-Triassic volcanism and implies that the continental ecosystem and marine ecosystem were affected more or less simultaneously (Cirilli et al. Reference Cirilli, Marzoli, Tanner, Bertrand, Buratti, Jourdan, Bellieni, Kontak and Renne2009; Muttoni et al. Reference Muttoni, Kent, Jadoul, Olsen, Rigo, Galli and Nicora2010; Korte et al. Reference Korte, Hesselbo, Jenkyns, Rickaby and Spötl2009; van de Schootbrugge et al. Reference Van de Schootbrugge, Quan, Lindström, Püttmann, Heunisch, Pross, Fiebig, Petschick, Röhling, Richoz, Rosenthal and Falkowski2009; Deenen et al. Reference Deenen, Ruhl, Bonis, Krijgsman, Kürschner, Reitsma and Van Bergen2010; Schoene et al. Reference Schoene, Guex, Bartolini, Schaltegger and Blackburn2010; Kuroda et al. Reference Kuroda, Hori, Suzuki, Gröcke and Ohkouchi2010). Their and our data demonstrate that the carbon and osmium isotope disturbances at the T–J transition were characteristic not just of surface seawater, in which it might be argued the isotope signal only represents localized oceanographic processes, but also the contemporaneous atmosphere and terrestrial biosphere, where localized anomalies matching those in the ocean are inconceivable. Jurassic floral renewal is related to climate stabilization. Thus, we propose here various key abiotic environmental changes that increased extirpation or extinction risk just before and at the T–J boundary. Our palaeoecological analysis reveals a significant replacement of the dominant Triassic palynotaxa with new dominants in Jurassic communities. It is not clear how widespread the palynofloral turnover observed in Pomerania was and to what extent it was dictated by the local ecological or taphonomical conditions. Other data, pointing to gradual palynofloral changes across the T–J boundary (Mander, Kürschner & McElwain, Reference Mander, Kürschner and McElwain2010; Cirilli, Reference Cirilli and Lucas2010; Kürschner & Herngreen, Reference Kürschner, Herngreen and Lucas2010) open up the question of whether the observed palynofloral turnover here was more or less localized. Provincialism and local palaeoenvironmental/taphonomical conditions could have played a more significant role in observed palynofloral changes at the T–J boundary. If the palaeoecological changes described from the Pomeranian borehole are a basin-wide phenomenon, they are likely to have contributed significantly to T–J faunal change by altering the dominant forms of terrestrial primary productivity.
Acknowledgements
This work was financed by the Polish scientific funds as the project N307 011 31/0941 – our thanks go to Prof. Grzegorz Racki of Silesia University, Poland, for his support in acceptance of this grant. We thank Prof. Stephen Hesselbo of Oxford University, UK, and Dr Josef Pálfy from the Research Group for Palaeontology, Hungarian Academy of Sciences–Hungarian Natural History Museum, for all valuable suggestions and comments. We are grateful to Prof. Paul Olsen of Columbia University (USA) and to an anonymous reviewer for discerning reviews, which improved the paper. Prof. Michael Joachimski, Head of the Stable Isotope Laboratory, GeoZentrum Nordbayern, Germany, performed carbon isotope analyses. Prof. Zdzisław Bełka of Poznań University, Poland, carried out osmium and rhenium isotope analyses. This is a contribution to IGCP project 506 ‘Marine and Non-marine Jurassic: Global Correlation and Major Geological Events’.






