1. Introduction
Effective drop removal from a condenser surface is critical to highly efficient dropwise condensation, which is in turn important to many applications such as condensation heat transfer (Yao et al. Reference Yao, Lai, Alvarado, Zhou, Aung and Mejia2017) and water harvesting (Dai et al. Reference Dai, Sun, Nielsen, Stogin, Wang, Yang and Wong2018). The recent advancement on superhydrophobic surfaces (Boreyko & Chen Reference Boreyko and Chen2009b; Yao et al. Reference Yao, Lai, Alvarado, Zhou, Aung and Mejia2017) have shown promising enhancement of droplet mobility. Nevertheless, high mobility of drops on superhydrophobic surfaces can be lost when the condensate nucleates within the texture and the wetting falls into the Wenzel state. To restore the high drop mobility, external forcing such as surface vibration is typically required to excite the oscillation of the drops and to revert the wetting to the Cassie state (Boreyko & Chen Reference Boreyko and Chen2009a; Yao et al. Reference Yao, Lai, Alvarado, Zhou, Aung and Mejia2017). When the excitation frequency matches the natural frequency, the oscillation amplitude of the drop is maximized for a given energy input due to the resonance effect (Noblin, Buguin & Brochard-Wyart Reference Noblin, Buguin and Brochard-Wyart2004; Boreyko & Chen Reference Boreyko and Chen2009a; Yao et al. Reference Yao, Lai, Alvarado, Zhou, Aung and Mejia2017). Therefore, it is highly advantageous to predict the natural oscillation frequencies for drops on surfaces of different wettability.
Similar to a free drop, the oscillation of a drop supported by a planar surface can be characterized by spherical-harmonic modes, with  $n$ and
 $m$ representing the longitudinal and azimuthal wavenumbers, respectively (Strani & Sabetta Reference Strani and Sabetta1984; Bostwick & Steen Reference Bostwick and Steen2014). Different from free drops, the two
 $n=1$ modes, corresponding to the centroid translation in the directions normal
 $(n=1,m=0)$ and tangential
 $(n=1,m=1)$ to the surface, trigger shape oscillations for supported drops. Since the natural frequency and damping rate increase with
 $n$ (Lamb Reference Lamb1932), the
 $n=1$ modes typically dominate the oscillations of supported drops (Strani & Sabetta Reference Strani and Sabetta1984; Noblin et al. Reference Noblin, Buguin and Brochard-Wyart2004; Sakakeeny & Ling Reference Sakakeeny and Ling2020, Reference Sakakeeny and Ling2021). While the longitudinal mode
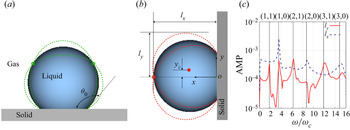
 $(n=1,m=0)$ is axisymmetric, see figure 1(a), and has been extensively studied (Strani & Sabetta Reference Strani and Sabetta1984, Reference Strani and Sabetta1988; Noblin et al. Reference Noblin, Buguin and Brochard-Wyart2004; Sakakeeny & Ling Reference Sakakeeny and Ling2020, Reference Sakakeeny and Ling2021), less attention has been paid to the lateral mode
 $(n=1,m=1)$, see figure 1(b), which is the focus of the present study.
Schematics of the (a) longitudinal ( $n=1$,
 $m=0$) and (b) lateral (
 $n=1$,
 $m=1$) oscillation modes for a drop on a flat surface with pinned contact lines. The red and green open circles indicate the longitudinal and azimuthal nodal lines, while the red filled circle indicates the centroid of the deformed drop. (c) Simulation results for the frequency spectra for the maximum interfacial locations
 $l_x$ and
 $l_y$, for
 $\theta _0=100^{\circ }$ and
 $Bo=0$. The Bostwick & Steen (Reference Bostwick and Steen2014) model predictions for modes
 $(n,m)$ are shown (see vertical lines) for comparison.

In the limit of zero gravity, different inviscid theoretical models (Strani & Sabetta Reference Strani and Sabetta1984; Celestini & Kofman Reference Celestini and Kofman2006; Bostwick & Steen Reference Bostwick and Steen2014) have been developed to predict the frequency of different spherical-harmonic modes, including the lateral mode of interest here. As the effect of gravity is characterized by the Bond number ( $Bo$), the aforementioned inviscid models are strictly valid only in the limit of zero
 $Bo$, although the model predictions were observed to agree reasonably well with experiment for drops with small
 $Bo$ (Chang et al. Reference Chang, Bostwick, Daniel and Steen2015). A simple capillary–gravity wave model has been suggested by Noblin et al. (Reference Noblin, Buguin and Brochard-Wyart2004) to include the effect of gravity on the oscillation frequency, but significant discrepancies with experiment was found for surfaces with large contact angles (Yao et al. Reference Yao, Lai, Alvarado, Zhou, Aung and Mejia2017). Numerical simulations have been recently performed by Sakakeeny & Ling (Reference Sakakeeny and Ling2020, Reference Sakakeeny and Ling2021) to investigate the effect of Bond number on the axisymmetric zonal oscillation modes for supported drops. Their results indicated that the drop oscillation frequency varies significantly with
 $Bo$, even when the drop radius is smaller than the capillary length (
 $Bo<1$). Furthermore, they also found that the orientation of the supporting surface, with respect to the gravitational acceleration, also matters: while the drop oscillation frequency increases with
 $Bo$ for sessile drops, the frequency decreases with
 $Bo$ for pendant drops. To the knowledge of the authors, there are no former experimental or numerical studies in the literature that systematically address the effects of
 $Bo$ and equilibrium contact angle on the oscillation of drops pinned on a vertical planar surface. In the present study, a combined numerical, experimental and theoretical analysis is performed for the lateral oscillation of a water drop on a vertical planar surface. The goal of the study is to establish a model to predict the oscillation frequency for a drop at small but finite
 $Bo$. We focus only on drops with pinned contact lines, since they are the ones that require oscillation excitation to restore high mobility.
2. Methods
2.1. Key parameters
The shape oscillation of a liquid drop is mainly controlled by surface tension. The contact with the solid surface has a significant impact on the oscillation dynamics. The natural frequency of the drop oscillation depends on the equilibrium contact angle ( $\theta _0$), contact line mobility and
 $Bo$ (Bostwick & Steen Reference Bostwick and Steen2014; Sakakeeny & Ling Reference Sakakeeny and Ling2020, Reference Sakakeeny and Ling2021). The key dimensionless parameters and the ranges of values considered are summarized in table 1. Due to the small gas-to-liquid density and viscosity ratios,
 $r=\rho _g/\rho _l$ and
 $m=\mu _g/\mu _l$, the effect of the surrounding gas is generally small. The effects of gravity and liquid viscosity, compared with surface tension, are characterized by the Bond and Ohnesorge numbers,
 $Bo =\rho _lgR_d^2/\sigma$ and
 $Oh=\mu _l/\sqrt {\rho _l \sigma R_d}$, where
 $g$ and
 $\sigma$ are gravity and surface tension, while
 $R_d=(3V_d/4{\rm \pi} )^{1/3}$ is the radius based on the drop volume
 $V_d$. For millimetre-size water drops,
 $Oh$ and
 $Bo$ are smaller than one. As a result, the oscillation frequency
 $\omega$ generally scales with the capillary frequency (Lamb Reference Lamb1932),
 $\omega _c= \sqrt {\sigma / (\rho _l R_0^3)}$, where
 $R_0$ is the radius of the equilibrium spherical-cap shape when gravity is absent, and
 $R_0= R_d ((2 + cos \theta _0) (1-cos \theta _0)^2/4)^{-1/3}$. The reason for using
 $R_0$, instead of
 $R_d$ is because
 $R_0$ better represents the radius of curvature.
Key parameters for simulations.

While  $r$,
 $m$ and
 $Oh$ are fixed in the simulation, the equilibrium contact angle
 $\theta _0$ is varied from
 ${50}^{\circ }$ to
 ${150}^{\circ }$ to cover a wide range of wettability, varying from hydrophilic to superhydrophobic surfaces. For a given liquid,
 $Bo$ can be varied by changing
 $V_d$ or
 $g$. In the present study, we keep
 $V_d$ fixed and vary
 $g$, yielding
 $0\le Bo \le 0.78$. Except for very small
 $Bo$, the simulation results also well represent cases for drops with different
 $V_d$ under full gravity. Although
 $Bo$ is smaller than unity for all cases considered, namely
 $R_0$ is smaller than the capillary length
 $\sqrt {\sigma /(\rho _l g)}$, it will be shown later that the effect of gravity on the oscillation frequency can be significant.
2.2. Simulation methods
The numerical simulations were conducted using the Basilisk solver, in which the Navier–Stokes equations are solved by a finite-volume approach. The sharp interface is captured by the volume-of-fluid (VOF) method (Scardovelli & Zaleski Reference Scardovelli and Zaleski1999). The balanced-force method is used to discretize the surface tension (Popinet Reference Popinet2009). The height-function method is used to calculate the interface curvature (Popinet Reference Popinet2009) and to specify the contact angle at the surface (Afkhami & Bussmann Reference Afkhami and Bussmann2009). Details of the numerical methods and validation studies for the Basilisk solver can be found in previous studies (Sakakeeny & Ling Reference Sakakeeny and Ling2020, Reference Sakakeeny and Ling2021) and the code website.
The computational domain is a cube with the edge length  $L=8R_d$, see figure 2(a). The drop is symmetric with respect to the plane
 $z=0$ for the lateral mode, so only half of the drop is simulated. The surface
 $x=0$ is in contact with the drop and is taken as a no-slip wall. Other boundaries are slip walls. Although modelling of mobile contact lines is challenging (Snoeijer & Andreotti Reference Snoeijer and Andreotti2013; Afkhami et al. Reference Afkhami, Buongiorno, Guion, Popinet, Saade, Scardovelli and Zaleski2018), here, we consider only the asymptotic limit such that the contact lines are pinned. Physically, this limit occurs when the hysteresis effect is very strong and the oscillation amplitude is small. The pinning of contact lines is achieved by imposing very small and large contact angles, i.e.
 $\theta _0={15}^{\circ }$ and
 ${165}^{\circ }$, inside and outside of the contact line on the surface
 $x=0$, see figure 2(b), to mimic the strong hysteresis effect. As long as the contact angle
 $\theta$ remains bounded by these two values when the drop oscillates, the contact line cannot recede or advance. Validation of this treatment of the contact lines can be found in our previous study (Sakakeeny & Ling Reference Sakakeeny and Ling2021). The drop oscillations are initiated by specifying an initial shape different from the equilibrium shape or by increasing the gravity for a short period. The oscillation frequency will not be affected if the amplitudes of excited oscillations are small.
(a) The simulation domain. (b) Close up of the field of liquid volume fraction  $f$ on the contact plane (
 $x=0$), showing the pinned contact line circle and the small and large
 $\theta _0$ specified inside and outside of the contact line. (c) Close up of the symmetric plane (
 $z=0$), showing the adaptive mesh and VOF field.

An adaptive octree mesh is used for spatial discretization, see figure 2(c), and the maximum refinement level is  $\mathcal {L}=10$, corresponding to
 $R_d/\varDelta _{min}=128$, where
 $\varDelta _{min}$ is the minimum cell size. The adaptation thresholds for the liquid volume fraction (
 $\,f$) and the fluid velocity components (
 $u,v,w$) are 0.0001 and 0.01, respectively. It is verified that the refinement level and error thresholds are sufficient to yield mesh-independent results. The simulations were performed on the cluster Kodiak using 144 CPU cores (Intel E5-2695 V4). Each simulation case takes approximately 15 days to reach the time
 $t\omega _c\approx 110$. The simulation time has been verified to be sufficiently long for accurate measurement of frequencies from the spectra. To vary both
 $\theta _0$ and
 $Bo$, there are in total approximately 30 cases simulated.
Figure 1(c) shows the frequency spectra of the maximum interfacial locations in  $x$ and
 $y$ directions,
 $l_x$ and
 $l_y$, for
 $\theta _0=100^{\circ }$ and
 $Bo =0$. The different oscillation modes are clearly identified: while the spectrum for
 $l_y$ shows the
 $m=1$ modes, that for
 $l_x$ indicates the
 $m=0$ modes. The frequencies predicted by the inviscid model of Bostwick & Steen (Reference Bostwick and Steen2014) (B–S) for
 $(n,m$) modes are shown for comparison, see the vertical lines. The simulation results generally agree very well with the inviscid model, although small discrepancies were observed for the high-order
 $(3,0)$ and
 $(3,1)$ modes. It can be seen that the lateral mode considered in the present study exhibits the lowest frequency.
2.3. Experimental methods
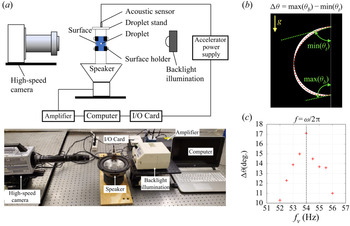
Experiments have also been performed to measure the oscillation frequency of the lateral mode. The drop oscillations were excited by the lateral vibration of the supported substrate. Distilled water drops were placed on the vertical substrate, which was fixed to a drop stand, see figure 3(a). The stand was attached to a sound speaker (Infinity Reference 860 W, Infinity Inc.) with an amplifier system (Russound P75-2 Channel Dual Source 75 W). The speaker provided sine wave vibrations of different frequencies to the substrate using a connected online tone generator. An accelerometer (352C04, PCB Piezoelectronics) was used to measure vibration frequencies and acceleration of the substrate. A National Instruments Data Acquisition System (NI USB-5132) was used to interface the accelerometer with the computer. A high-speed camera (Photron SA3) with a halogen lamp (Fiber-Lite MI series, Dolan-Jenner Inc.) was used to capture the drop deformation.
(a) Experimental set-up. (b) Superimposition of drop edges on the central plane from 100 snapshots for the polystyrene surface and drop volume 4.78  $\mathrm {\mu }$l. The red dashed line indicates the equilibrium shape. The contact angles at the top and bottom of the drop,
 $\theta _{t}$ and
 $\theta _{b}$, are measured. The maximum contact angle hysteresis is defined as
 $\Delta \theta =\max (\theta _b)-\min (\theta _t)$. (c) Variation of
 $\Delta \theta$ as a function of the surface vibration frequency
 $f_v$. The resonance angular frequency
 $\omega =2{\rm \pi} f$ is identified as the peak of the function.

The different substrates and drop volumes tested are summarized in table 2. Five different commercially available substrates with increasing  $\theta _0$ were used. For each substrate, four different droplet volumes were tested. The wax substrate was prepared in house by firmly attaching wax paper on the polystyrene surface. All substrates, except for the wax one, were cleaned with isopropyl alcohol, distilled water and air dried before testing. The ranges of parameters considered in the simulation are wide enough to cover all the experimental cases.
Experimental cases. PTFE, polytetrafluoroethylene.

For a given acceleration of the substrate, the excited drop oscillation amplitude is maximized when the substrate vibration frequency  $\omega _v$ matches the natural frequency
 $\omega$. The acceleration amplitude is controlled to be small to avoid drop sliding on the surface. Different
 $\omega _v$ were imposed, and the range of
 $\omega _v$ tested was estimated based on the theoretical model of Celestini & Kofman (Reference Celestini and Kofman2006) (C–K). For each
 $\omega _v$, 100 drop images were recorded. The drop contours on the central plane were identified using the Canny method in MATLAB and superimposed as shown in figure 3(b). The contact angles at the top and bottom of the drops
 $\theta _t$ and
 $\theta _b$ are measured. The maximum contact angle difference,
 $\Delta \theta = \max (\theta _b)-\min (\theta _t)$, is used to characterize the excited drop oscillation amplitude. The resonance frequency
 $\omega =2{\rm \pi} f$ is then identified by the local maximum of
 $\Delta \theta$ as a function of
 $\omega _v=2{\rm \pi} f_v$, see figure 3(c). A small
 $f_v$ increment of 0.5 Hz were used near the local maximum for accurate measurement.
3. Results and discussion
3.1. Oscillation frequency
The simulation and experimental results for the oscillation frequency of the lateral mode  $\omega$ are shown in figure 4. The results of previous experiments by C–K and Sharp, Farmer & Kelly (Reference Sharp, Farmer and Kelly2011), and theoretical models by C–K and B–S are also included for comparison. It is observed that the experimental data for different drop volumes collapse approximately, when
 $\omega$ is normalized by
 $\omega _c$. This scaling relation
 $\omega \sim \omega _c$ indicates
 $\omega \sim V_d^{3/2}$, which is consistent with previous observations for a minor gravity effect (Noblin et al. Reference Noblin, Buguin and Brochard-Wyart2004). The normalized frequency
 $\omega /\omega _c$ for different
 $V_d$ still varies slightly due to the effect of
 $Bo$. For the experiments of C–K (
 $0.04\lesssim Bo \lesssim 0.19$) and Sharp (
 $0.16\lesssim Bo \lesssim 0.66$), the surface is horizontal,
 $\omega /\omega _c$ increases with
 $Bo$ (Sakakeeny & Ling Reference Sakakeeny and Ling2021), while for the present experiment (
 $0.12\lesssim Bo \lesssim 0.16$) that uses vertical surfaces,
 $\omega /\omega _c$ decreases with
 $Bo$ (as shown later in figure 7). When
 $Bo$ decreases, the experimental results for different surface orientations approach to the simulation results for
 $Bo =0$.
Present simulation, model and experimental results for the frequency of the lateral oscillation mode as a function of the equilibrium contact angle  $\theta _0$ for
 $Bo =0$, compared with previous models and experiments by C–K, Sharp et al. (Reference Sharp, Farmer and Kelly2011) and B–S. The experiments of C–K and Sharp are for sessile drops on a horizontal surface, for which the normalized frequency increases with
 $Bo$, while the present experiments are for a vertical surface, where the frequency decreases with
 $Bo$. The arrows indicate the variation of the normalized frequency as
 $Bo$ increases. When
 $Bo$ decreases, the experimental results for different surface orientations approach the simulation and model results for
 $Bo =0$.

The B–S model assumes  $Bo=0$, so the equilibrium drop is a spherical cap. The inviscid linear stability theory is used to predict the frequency of the oscillation. The B–S predictions generally agree well with simulation results, see figure 4. Small discrepancies are observed for
 $\theta _0\gg {90}^{\circ }$, which may be due to the simplified contact line boundary conditions used in the B–S model (Sakakeeny & Ling Reference Sakakeeny and Ling2020). The C–K model predicts the frequency by a different approach. The shape oscillation of the drop is modelled as a harmonic oscillator, so the frequency is
 $\omega =\sqrt {k/m_d}$, where
 $m_d$ is the drop mass. The effective spring constant
 $k$ is related to surface tension, which serves as a restoring force to bring the drop back to its equilibrium state. The C–K model is more convenient to use since an explicit expression of
 $\omega$ is given, but it significantly under-predicts the frequencies, as shown in figure 4 and also in the original paper of C–K.
3.2. An inviscid model to predict oscillation frequency
A new inviscid model is developed in this study. The goal is to achieve an explicit expression to accurately predict the oscillation frequency. Furthermore, the new model incorporates the effect of finite  $Bo$, which is ignored in B–S and C–K models. We take the equilibrium state for
 $Bo=0$ as the reference state, where the
 $y$-coordinate of the centroid and the drop surface area are
 $y_c= y_{c0}=0$ and
 $S=S_0$, respectively. The surface energy of the drop is
 $E_s=\sigma (S-S_0)$. The surface area
 $S-S_0$ can be expanded as a function of
 $y_c-y_{c0}$
 \begin{equation} \frac{S-S_0}{S_0} = \eta\left(\frac{y_c-y_{c0}}{R_0}\right)^2 + \xi\left(\frac{y_c-y_{c0}}{R_0}\right)^4. \end{equation}
Due to symmetry, only the even-order terms remain and the terms higher than fourth order are truncated, assuming small oscillation amplitudes. The relation between  $S$ and
 $y_c$ during oscillation is assumed to be similar to that for a static equilibrium drop under different body forces (Celestini & Kofman Reference Celestini and Kofman2006). As a result, the parameters
 $\eta$ and
 $\xi$ depend only on
 $\theta _0$ and can be obtained from the solution for static drops. The Surface Evolver code was used to obtain the static solutions for different body forces for a given
 $\theta _0$, which are then used to measure
 $\eta$ and
 $\xi$ following (3.1). The procedures are similar to our previous study (Sakakeeny & Ling Reference Sakakeeny and Ling2020) and thus are not repeated here. The results for
 $\eta$ and
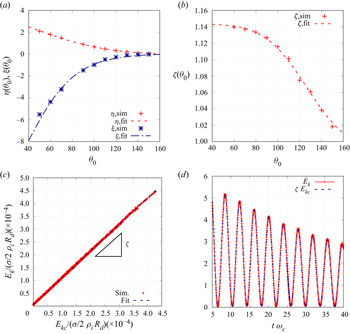
 $\xi$ are shown in figure 5(a). For convenient use of the results, fitted correlations are provided
 $$\begin{gather} \eta(\theta_0) = a_0 \left[ \exp \left(a_1 (\cos\theta_0+1) \right)-1\right] , \end{gather}$$
 $$\begin{gather}-\xi(\theta_0) = b_0 \left[ \exp \left(b_1 (\cos\theta_0+1) \right)-1\right], \end{gather}$$
where the fitting coefficients  $[a_0,a_1]=[0.52.0.99]$ and
 $[b_0,b_1]=[0.20,2.11]$. In the asymptotic limit
 $\theta _0\to {180}^{\circ }$, both
 $\eta$ and
 $\xi$ approach zero, since in that limit the lateral mode does not induce deformation. The static solutions also indicate that
 $\eta >0$ and
 $\xi <0$ for all
 $\theta _0$.
Model parameters (a)  $\eta$ and
 $\xi$ and (b)
 $\zeta$ as functions of
 $\theta _0$; (c)
 $E_k$ as a function of
 $E_{kc}$ and (d) temporal evolution of
 $E_k$ and the approximation
 $\zeta E_{kc}$ for
 $\theta _0={140}^{\circ }$ and
 $Bo =0$.

The gravitational potential energy is expressed as  $E_g=m_d g(y_c-y_{c0})$, and the overall potential energy is
 $E_p=E_s+E_g$. The equilibrium state is located at the minimum of
 $E_p$, namely
 $\textrm {d}E_p/\textrm {d}y_c=0$, which yields
 \begin{equation} 2\eta(y_{c1}/R_0) + 4\xi(y_{c1}/R_0)^3 + Bo _1=0, \end{equation}
where  $Bo _1 = mgR_0/\sigma S_0=0.42(2 + \cos \theta _0)^{1/3} (1-\cos \theta _0)^{-1/3} Bo$. The cubic equation can be solved for the equilibrium centroid position
 $y_{c1}$, near which
 $E_p$ can be expanded as
 \begin{equation} E_p=\frac{1}{2}\frac{\textrm{d}^2 E_p}{\textrm{d}y_c^2}(y_c-y_{c1})^2=\sigma S_0 \eta_1\left(\frac{y_c-y_{c1}}{R_0}\right)^2, \end{equation}
where  $\eta _1=\eta + 6 \xi (y_{c1}/R_0)^2$. Although the exact solution exists for (3.4), we use the approximation
 $y_{c1} \approx -{ Bo _1}/{2\eta }$ by neglecting the cubic term. Then we get the approximation
 \begin{equation} \eta_1\approx\eta + \frac{3\xi}{2\eta^2} Bo_1^2. \end{equation}
The kinetic energy of the drop fluid is  $E_k=\rho _l \int _{V_d} |\boldsymbol {u}|^2/2\, \textrm {d}V$, which is evaluated in the simulation by the integral over the domain
 $E_k = \rho _l \int f (u^2 + v ^2 + w^2)\, \textrm {d}V$, where
 $f$ is the liquid volume fraction, and
 $u$,
 $v$ and
 $w$ are the velocity components. If the drop moves as a rigid body, the kinetic energy would be
 $E_{kc}=m_d v_c^2/2$, where
 $v_c=\textrm {d}y_c/\textrm {d}t$ is the
 $y$-component of the centroid velocity. Due to the internal flow with respect to the centroid induced by the shape oscillation,
 $E_k>E_{kc}$ (Sakakeeny & Ling Reference Sakakeeny and Ling2021). Furthermore, as shown in figure 5(c),
 $E_k$ is approximately a linear function of
 $E_{kc}$ when the drop oscillates. This is due to the fact that the temporal evolutions of energy of the internal flow and the magnitude of
 $v_c$ are in phase. As a result, the kinetic energy correction factor, defined as
 $\zeta =E_k/E_{kc}$, is approximately a constant in time and can be measured from the simulation results as shown in figure 5(c). Then we can approximate
 \begin{equation} E_k\approx \zeta E_{kc} = \zeta m_d v_c^2/2. \end{equation}
The temporal evolutions of  $E_k$ and
 $\zeta E_{kc}$ are plotted in figure 5(b) and the latter is affirmed to be generally a good approximation for all time. Further tests show that
 $\zeta$ varies little over
 $Bo$ and is only a function of
 $\theta _0$, see figure 5(b). The fitted function for
 $\zeta$ is given as
 \begin{equation} \zeta(\theta_0) = c_1\mathrm{erf}\left[(\cos\theta_0+1)/c_2\right]+1, \end{equation}
where the fitting coefficients  $[c_1,c_2]=[0.14,0.93]$. In the asymptotic limit
 $\theta _0\to {180}^{\circ }$,
 $\zeta \to 1$ since there is no shape oscillation and the lateral mode corresponds to rigid-body translation of the drop.
The total energy  $E=E_p+E_k$ is constant in time, so
 $\textrm {d}E/\textrm {d}t=0$. With (3.5) and (3.7) we obtain
 \begin{equation} k(y_c-y_{c1})+m_d \frac{\textrm{d}^2 (y_c-y_{c1})}{\textrm{d}t^2} = 0 , \end{equation}
where  $k=2\sigma S_0 \eta _1/(\zeta R_0^2)$. The oscillation frequency
 $\omega =\sqrt {k/m_d}$ can be expressed as
 \begin{equation} \frac{\omega^2}{\omega_c^2} = \frac{12 \left( \eta + \dfrac{3\xi}{2\eta^2} Bo _1^2\right)}{\zeta(2+\cos\theta_0)(1-\cos\theta_0)} . \end{equation}
In the limit of  $Bo =0$, (3.10) reduces to
 \begin{equation} \frac{\omega^2}{\omega_c^2} = \frac{12 \eta}{\zeta(2+\cos\theta_0)(1-\cos\theta_0)} . \end{equation}
The results of (3.11) are plotted in figure 4, which are shown to agree remarkably well with the simulation results. The C–K model for  $Bo=0$ can be written as
 \begin{equation} \frac{\omega_{CK}^2}{\omega_c^2} = \frac{6 \eta}{(2+\cos\theta_0)(1-\cos\theta_0)} . \end{equation}
Comparing the (3.11) and (3.12) for  $Bo=0$, it is shown that the present model yields better predictions due to the incorporation of the contribution of the kinetic energy of the internal flow through
 $\zeta$.
3.3. Model predictions for finite Bond numbers
Since numerical solutions are required for the model parameters  $\eta$,
 $\xi$ and
 $\zeta$, the present model, similar to the C–K model, is semi-analytical. Nevertheless, once these parameters are established, as shown in (3.2), (3.3), (3.8), the explicit expression (3.10) is ready to predict the natural frequencies for the lateral oscillation of drops pinned on a vertical surface with different
 $\theta _0$ and
 $Bo$.
The predictions of  $\omega /\omega _c$ by the present, B–S and C–K models are compared with the present experimental results for finite
 $Bo$ in table 3. The results are also plotted in figure 6. Since the C–K model neglects the effect of kinetic energy of the fluid motion within the drop, it significantly under-predicts the frequency, by up to 21 %. In contrast, the B–S model, which neglects the effect of
 $Bo$, over-predicts the frequency, by up to 17 %. As shown in figure 4, the present model yields very similar results to the B–S model for
 $Bo =0$ in the range of
 $\theta _0$ considered in the present experiments. By incorporating the contribution of
 $Bo$, the present model yields more accurate predictions than the other two models for all cases. The relative errors are less than 12 % for all cases. Excluding the cases for copper, the errors are less than 9 %.
Comparison between experimental results of the normalized frequency  $\omega /\omega _c$ and model predictions with the present, B–S and C–K models.

Comparison between experimental results of the normalized frequency  $\omega /\omega _c$ and model predictions with the present, B–S and C–K models.

The present model over-predicts the frequency for all cases, compared with the experimental results. There are a couple of potential reasons that contribute to the discrepancy between the model and experimental results. Similar to the B–S and C–K models, the contact area is taken to be a circle with radius as  $R_c=R_0\sin {\theta _0}$ in the present model. This ideal contact area corresponds to the spherical-cap shape of the drop when gravity is absent. The contact area is then fixed during oscillation, since the contact line is pinned. In the experiment, the contact area may be slightly smaller than the ideal contact area considered in the model, since gravity is present when the drop is deposited on the surface. The smaller contact area will result in a weaker constraint on the drop and a lower oscillation frequency. Furthermore, although in the experiment the oscillation amplitude is controlled to be very small, the contact line may still not be fully pinned and may have oscillated with a very small amplitude near the equilibrium position. In contrast, the contact line is perfectly pinned in the model and simulation. The mobility of the contact line will result in a reduction of the oscillation frequency for the same
 $\theta _0$ and
 $Bo$, according to our previous study (Sakakeeny & Ling Reference Sakakeeny and Ling2021).
In the experiment,  $Bo$ is varied only in a very small range (
 $0.12< Bo < 0.15$). Drops with larger
 $Bo$ are very unstable and may slide even when the surface vibration amplitude is very small. To better pin the contact line and to enable experiments for larger
 $Bo$, a more sophisticated surface treatment, such as that by Chang et al. (Reference Chang, Bostwick, Daniel and Steen2015), is required, which will be relegated to future work. In order to validate the model for higher
 $Bo$, the model predictions are compared with the fully resolved simulation results.
The model and simulation results of the normalized frequency  $\omega /\omega _c$ as a function of
 $Bo$ for
 $\theta _0=100^{\circ }$ are shown in figure 7(a). It is seen that
 $\omega /\omega _c$ decreases with
 $Bo$ and excellent agreement between the present model and the simulation results is observed. It is conventionally considered that the effect of gravity on the the supported drop oscillation is negligible if
 $Bo <1$, namely when the drop radius is smaller than the capillary length (Chang et al. Reference Chang, Bostwick, Daniel and Steen2015). However, it can be seen that the frequency decreases for more than 25 % when
 $Bo$ increases from 0 to 0.62.
Comparison between the model and simulation results for oscillation frequency as a function of  $Bo$ and
 $\theta _0$.

The variation of  $\omega /\omega _c$ over
 $Bo$ can be better depicted if
 $\omega$ is normalized by its
 $Bo =0$ counterpart
 $\omega _{ Bo =0}$. From (3.10), it can be shown that
 \begin{equation} {\omega^2}/{\omega_{ Bo =0}^2} = 1+ ({3\xi}/{2\eta^3}) Bo _1^2. \end{equation}
The equilibrium drop results show that  $\xi <0$ for all
 $\theta _0$ (see figure 5a), indicating that that the curvature of the
 $S$–
 $y_c$ curve (3.1) decreases as
 $y_c$ increases. As a result,
 $\omega /\omega _c$ decreases with
 $Bo$, see figure 7(a). Furthermore, the leading correction term for
 ${\omega ^2/\omega _{ Bo =0}^2}$ scales with
 $Bo ^2$. Therefore, for finite and small
 $Bo$,
 $\omega /\omega _c$ decreases quadratically with
 $Bo$. It is difficult to vary
 $Bo$ over a wide range in experiments to examine the scaling relation, but that can be done in the simulations. We have change
 $g$ from 0 to 0.9
 $\textrm {m }\,\textrm {s}^{-2}$, yielding
 $0\le Bo \le 0.78$. The model and simulation results for
 $\theta _0={70}^{\circ }, 100^{\circ }$ and
 ${130}^{\circ }$ are plotted in figure 7(b). Since drops with large
 $\theta _0$ become unstable for large
 $Bo$, the range of
 $Bo$ for
 $\theta _0={130}^{\circ }$ is smaller than other cases. The model predictions (3.13) agree very well with the simulation results, validating the quadratic scaling law revealed in the model.
In the present study,  $Bo$ is varied by changing the gravity
 $g$. Therefore, the results imply that the natural frequency of the lateral oscillation mode will increase if the drops oscillations occur in a reduced gravity environment. This knowledge is important to the surface vibration dropwise condensation applications in the space station.
The present model can also be used to estimate the frequencies for the drops of different volume. For a given gravity,  $Bo$ increases with
 $V_d$. As a result,
 $\omega /\omega _c$ decreases as
 $V_d$ increases. Since the model is based on an inviscid assumption and the viscous effect on the oscillation frequency (Lamb Reference Lamb1932; Prosperetti Reference Prosperetti1980) is not accounted, it is valid only for
 $Oh\ll 1$. For low-viscosity liquids like water,
 $Oh$ for millimetre drops is generally small. Yet, as
 $Oh$ increases as the drop size decreases, caution is required if the model is applied to very small drops.
Acknowledgement
The authors also thank Professor S. Zaleski for the helpful discussions on numerical model of pinned contact lines.
Funding
This work was supported by the startup fund at Baylor University and the National Science Foundation (1942324). The Baylor High Performance and Research Computing Services (HPRCS) have provided the computational resources that have contributed to the research results reported.
Declaration of interests
The authors report no conflict of interest.