Social security systems in many countries face problems of high and escalating disability costs. This has been ascribed, alternatively, to demand-side responses to unemployment rate and generous benefits, supply-side factors such as easy eligibility rules and exogenous forces such as population aging. The impact of alternative assessment procedures has also been a much-debated issue (see, for example, Rupp and Stapleton, Reference Rupp and Stapleton1995 and Reference Rupp and Stapleton1998; Gruber, Reference Gruber2000; Autor and Duggan, Reference Autor and Duggan2003; Duggan and Imberman, Reference Duggan, Imberman, David and David2006; Autor and Duggan, Reference Autor and Duggan2006; von Wachter et al., Reference Von Wachter, Till and Manchester2007). This paper analyzes the impact of a radical change in disability assessment procedures and incentives implemented in Chile as part of its new pension system.
When Chile's new retirement system was introduced in 1981, workers then in the labor force had a choice between staying in the old system or switching to the new system. New entrants to the labor force had to join the new system. Thus, after 1981 the two systems co-existed, although the old system is gradually being phased out. Those who switched were subject to a new disability system as well as a new pension system. The disability part is less well known than the old age pension part, but it is equally innovative. It differs from traditional public disability insurance in two ways: (1) it is largely pre-funded through accumulation in the retirement account and later through an insurance payment made when the person becomes permanently disabled, sufficient to cover a lifetime defined benefit annuity; and (2) the disability assessment procedure includes participation by private pension funds (AFPs) and life insurance companies, who help define and apply the criteria for disability, finance the benefit, and have a direct pecuniary interest in controlling costs. Survivors' insurance for working affiliates is handled in the same way – it provides a pre-funded defined benefit for survivors. Both are financed through a combined disability and survivors' (D&S) insurance fee.
These fees are strikingly lower in Chile's new system than in countries with pure public PAYG systems. The insurance fee is currently about 1% of wages, with two-thirds of this – approximately 0.7% of wages – for lifetime disability benefits. D&S insurance fees are 0.9%–1.7% of wages in other Latin American countries that adopted features of the Chilean model (AIOS, 2005). For comparison, the disability cost is 1.8% of wages in the US and is running into financial difficulties; it is over 3% in most other industrialized countries and up to 10% in some European countries (Andrews, Reference Andrews1999; US Social Security Advisory Board, 2001).Footnote 1 Costs and age-specific inflow of newly disabled are also much lower than in Chile's old system.
In this paper we focus on differences between the new and old systems, mainly during the period when they co-existed. Section 1 describes the Chilean procedures. We hypothesize that the participation of private organizations in the assessment procedure of the new system, with incentives to keep costs low and the power to provide countervailing information and appeal, has cut the incidence of successful disability claims. Section 2 tests this hypothesis, applying the Cox proportional hazard model to a recent retrospective sample of old- and new-system affiliates (EPS, 2002). We find that the risk of workers becoming disability pensioners in the new system is only 20–35% of that of workers in the old system, after controlling for age, gender, and unemployment rates. Tests for selection bias rule that out as the major explanation. Further, the new system accurately targets the disabled with more severe medical problems, as measured by their higher mortality rates, while the old system does not sort between those with high versus low mortality rates. The Conclusion considers social cost–benefit trade-offs and policy implications for other countries.
Designing social policy regarding disability is especially complex because of the impossibility of avoiding subjective evaluations and value judgments. Insurable disability can be defined as an objective medically determined condition or as a more subjective inability to work at one's normal job or at any job. The latter definition may be the raison d'etre for insurance but the former is more clear-cut to apply and less subject to moral hazard. Given the ambiguities, both type 1 errors (false positives) and type 2 errors (false negatives) are inevitable; the latter fails to protect claimants who are truly disabled, while the former imposes potentially high costs on workers. For efficiency, systems should strive to be on the frontier, giving the least false negatives for any given number of false positives, but value judgments must be made to determine the preferred point on this frontier. The Chilean system places a heavy weight on objective medical conditions and on minimizing false positives, thereby economizing on costs. This paper analyzes the procedures used to accomplish this and presents some outcomes. We do not take a normative position on whether this is the ‘right’ choice of objectives and criteria since, in fact, the right choice probably varies according to a country's values, capacities, and resources.
1 Cost controls by private pension funds in the Chilean schemeFootnote 2
1.1 Procedures in Chile's old vs. new systems
Prior to 1981, Chile's disability system was like traditional publicly managed schemes in other countries. Multiple programs existed and they were run on a pay-as-you-go basis, although with a projected long-term deficit. This is still the case today in the old system. Disability claims are filed by individuals with the help of their doctors. They are assessed by regional Medical Commissions that are part of the public health system and they have no financial incentive to limit successful claims. Each regional Commission acts independently, at the provincial level, without a technical commission to set medical protocols or a central commission to assure uniform standards. Although each Commission applies its own criteria, typically the Commissions define disability as a condition that prevents the worker from doing his or her habitual work. The pension system, which pays the bills, does not participate in this procedure. Technically, it can appeal approved claims, but it virtually never does. Data are not publicly available on acceptance and rejection rates on claims, although anecdotal evidence indicates that a large majority are approved.
In contrast, Chile's new disability system defines disability as a medical inability to do any work. Regional Medical Boards are set up specifically to assess disability claims but criteria are spelled out in a detailed technical manual that is used by each Medical Board. AFPs and insurance companies regularly present information and frequently appeal approved claims. The Association of AFPs keeps track of decisions and their variations over time and regions. Thus, decision-making power remains vested in public gatekeepers but this is balanced with countervailing information from private companies that have strong financial incentives to contain costs.
1.2 How disability insurance works: incentives to contain costs
Disability insurance in Chile's new system starts with the mandatory retirement accounts, to which each individual must contribute 10% of wages. This contribution is invested in the pension fund company (AFP) of his choice. Old age pensions depend on this defined contribution plus investment earnings. In contrast, if a worker becomes disabled before retiring, he receives a defined benefit. This is accomplished through the private insurance market, with government providing detailed regulations and guarantees.
Specifically, each insured worker is guaranteed a benefit that is 70% of his average wage if he is totally disabled, 50% if partially disabled, indexed to inflation. During an initial three-year period of temporary disability, this benefit is paid by the AFP. After the provisional period, if the worker is certified as permanently disabled, the entire lifetime benefit is fully pre-funded. Part of this benefit is covered by his or her own retirement account. The remainder is covered by a top-up (the ‘additional payment’) needed to finance an annuity that equals the specified defined benefit. The disabled worker uses these funds to purchase a lifetime annuity or a programmed withdrawal pension that follows a formula set by the regulator.Footnote 3
Each AFP is required to purchase a term group insurance policy that covers the additional payment for its affiliates. The typical contract shares the risk: the AFP pays a provisional rate that covers costs up to a maximum and keeps most of the savings beneath that maximum, while the insurance company takes over after the maximum rate has been reached and keeps most of the investment earnings on the provisional premiums. The provisional and maximum rates for future contracts, of course, depend on experience in past contracts. Survivors' insurance for workers is covered in the same way, in exchange for a combined D&S insurance fee that is passed on to workers by the AFP.
The D&S insurance fee is included in the general administrative charge that each worker pays the AFP. Each AFP sets its own fees and, apart from a small flat component, is required to charge all its affiliates the same percentage of their wage – regardless of age, gender, occupation, health status. or account size.Footnote 4 For any given total fee the AFP charges, part is spent on disability and survivors insurance and part on administration, so lower disability costs mean greater profits. AFP fees currently average around 2.4% of wages, of which the disability insurance portion is about 0.7% and the survivors' insurance portion is 0.3% (authors' estimates). Suppose that profits comprise 0.4% for a typical AFP. Then if it cuts the combined insurance cost from 1% to 0.8% and continues charging the same market-determined fee, its profits increase by 0.2% of wages, or 50% of the initial profit amount. AFPs are therefore highly motivated to keep disability probabilities low, and they are given a role in the evaluation procedure that allows them to pursue this goal. We hypothesize that these procedures and incentives will produce lower age-specific disability rates than would have obtained in the old system.
Assessment for temporary and permanent disability
Initial claims are evaluated by 21 Regional Medical Boards, each made up of three doctors hired by the public Superintendencia of AFPs (SAFP). The member may present his/her own medical tests and invite his/her personal doctor to take part in the discussions (but not the vote). The AFPs and life insurance companies also have a non-voting representative – their Associations have organized a group of medical observers, who regularly attend Board meetings, raise questions, and monitor its work. Thus, the decision-makers are still medical and public but information and arguments are provided by private representatives. According to data from the Association of AFPs, about 60% of all claims are approved at the first assessment, for a temporary disability benefit.
Three years later, the member is re-assessed. AFPs also participate in this second assessment. Approximately 70% of those who are provisionally disabled eventually come up for a second reassessment. About 94% of these are approved as permanently disabled (Association of AFPs, 2004, 2005, and 2006). The additional payment to cover the cost of the defined benefit is put into the account of the individual at the point when he is certified as permanently disabled. He receives a lifetime benefit even if he returns to work; hence work by disabled beneficiaries is not penalized, as it is in many countries that base benefits on incapacity to hold a job. (In this sense, the Chilean disability system rewards work, as does the old age system; see Edwards and James, Reference Edwards and James2005.)
Appeals by AFPs and life insurance companies
Traditional public systems usually do not allow agencies to appeal against approved claims; they only allow workers to appeal denials of disability status. And workers who appeal are, in some countries, allowed to be represented by attorneys. As a result, the appeals process invariably raises successful claims and costs. In the US, for example, appeals raise successful claims by 15–20 percentage points.Footnote 5 In Chile, the process is more symmetrical – AFPs, life insurance companies, and workers can all appeal the decisions of the Regional Boards to a Central Board. The Central Medical Board is also made up of three physicians appointed and paid by the SAFP. Some AFPs and insurance companies hire their own doctors to try to build strong appeals. Overall, in 2004–06, AFPs and life insurance companies appealed 17–20% of insured approved claims and one-third of these appeals were successful. This roughly offset the successful appeals by workers, so the net impact of appeals was close to zero (Association of AFPs, 2004, 2005, and 2006).
AFP role in shaping criteria for total and partial disability
A Technical Commission meets periodically to determine the medical criteria for granting partial and total disability. These criteria are spelled out in a lengthy protocol manual that is used by all decision-making groups. Representatives of the AFPs and the insurance companies, as well as three public representatives, sit on this commission, with a vote. For each medically defined handicap presented by the member, the rules allot a certain percentage of disability, which are summed to produce the total degree of disability. The Medical Boards may increase this percentage discretionarily according to specified ‘complementary factors’ in the case of older members with low levels of education, which make it difficult to retrain for a new line of work. If the degree of disability exceeds 67%, the member is considered totally disabled, whether or not he has continued to work, and is granted a 70% defined benefit. If the degree of disability is 50–67%, he is partially disabled and gets a 50% defined benefit. If degree of disability is less than 50%, he is not considered disabled. During 2004–06, almost 25% of approved claims were for partial disability. This proportion has been increasing over time.
Eligibility for insurance: avoiding adverse selection
Adverse selection could potentially be a big problem in an economy like Chile's, with a high degree of informality and self-employment. Self-employed individuals and independent contractors are not required to contribute to the system but may voluntarily do so. A healthy individual could work as an independent contractor or in the informal sector, thereby avoiding contributions, but start contributing or move to formal sector employment if he develops a complaint and anticipates filing a disability claim. Individuals who are approaching old age with small accounts, because they have worked in the informal sector or self-employment for part of their lives, also have a strong incentive to enter the system and apply for disability, because their defined benefit would be greater than the old age benefit based on their own accumulation. This would require a large ‘additional payment’ by the AFP or insurance company. Thus, adverse selection based on size of contingent top-up as well as probability of disability might raise the rate of disability applications among contributors and insurance costs for the system as a whole.
However, insurance eligibility rules, monitoring, and marketing strategies by AFPs reduce the likelihood that this will happen in Chile. AFPs market aggressively to individuals who fall into low-risk groups but pay small or zero commissions to sales agents for new members who are high risk or become disabled shortly after joining (James and Iglesias, Reference James and Iglesias2006). More important, eligibility for the defined benefit and the insurance top-up depends on recent work history. In general, an individual must have worked and contributed within the past 12 months in order to be insured and get the additional payment.Footnote 6 AFPs keep the contribution records of affiliated workers and thus can check whether they have contributed long and recently enough to be eligible.Footnote 7 In 2004–06 about 40% of all approved claims at the first stage and 30% at the second stage were deemed ineligible for insurance (Association of AFPs, 2004). They get access to the balance in their own accounts but they do not get the additional payment that would cover a 70% replacement rate. (Some of these are eligible for the government's minimum pension guarantee – see below.) The AFPs then concentrate their medical challenges on the insured.
Combating strategic behavior by monitoring the reference wage
Another way to discourage strategic behavior by workers with irregular contribution histories is to set a low reference wage for such people. The reference wage used to determine the defined benefit is the simple average of earnings during the prior ten years, expressed in the price-indexed Chilean currency, the UF (Unidad de Fomento), and with a ceiling. Workers who have been in the informal sector, unemployed, or out of the labor force for part of the last ten years will have zeros averaged in and will therefore have a low reference wage and benefit, even if they are insured.Footnote 8 AFPs use their records to ensure that these rules for defining the reference wage are strictly applied, thereby diminishing adverse selection and disability costs.
Consequently, during 2004–06, only 28% of original claimants ended up permanently disabled and insured, a proportion that is quite low by international standards (in the US, for example, acceptance rates are more than double). One quarter of these were considered partially disabled and many get a benefit that is far less than 70% (or 50%) of their full working wage (calculations by authors based on data in Association of AFPs, 2004, 2005, 2006). We argue that a major role in containing these costs was played by the AFPs and life insurance companies who actively participate in the assessment procedure and have a vested interest in containing costs.
1.3 The government's minimum pension guarantee
Underpinning these privately financed arrangements is the government's minimum pension guarantee (MPG), which sets a floor – currently 25–29% of the average wage – to disability and old age pensions (see James et al., Reference James, Martinez and Iglesias2006; Edwards and James, Reference Edwards and James2006). Twenty years of contributions are needed for MPG eligibility among old age pensioners, but only ten years (or less) are needed among disability pensioners.Footnote 9 If the pensioner's accumulation (including the additional payment) is not large enough to cover an annuity above the MPG level, he or she must keep the money in the account and withdraw monthly benefits equal to the MPG. When the account balance becomes zero, the government steps in to pay the pension, if the pensioner is eligible for the MPG. Presently, about half of all disabled pensioners have benefits at the MPG level and in one third of these cases the benefits are already financed by the public treasury. This proportion will probably grow over time as more accounts are depleted. Most likely to receive the MPG are the disabled who are not insured, insured individuals with a small reference wage, those who are only partially disabled, and surviving widows of disabled men. For each of these categories, policy choices reduce the cost of the private insurance but increase the cost of the public contingent liability. Thus, the MPG serves as an escape valve for a cost-conscious private disability insurance system, but its own future costs are uncertain.
1.4 Disability inflow rates in Chile vs. other countries
We expect these procedures to lead to a low inflow of age-specific newly disabled beneficiaries relative to insured population in Chile compared with other countries, and, indeed, this is the case. For example, in 1999, for age group 45–54, 2.9 per thousand insured members were accepted to newly disabled status in Chile, compared with 7.8 per thousand people in that age group in the US and 8.6 in Organization for Economic Cooperation and Development (OECD) countries as a whole (OECD, 2003 and Table 1). Over all ages, one per thousand insured members were accepted to newly disabled status in Chile in 2004, compared with three to five per thousand in the US over the past two decades (US Social Security Board of Trustees, 2005; US Social Security Bulletin, various years). These low incidence rates lead to low insurance fees. Of course, many factors besides system incentives enter into these incidence differentials – in particular, the definition of disability, the existence of other programs that cover certain groups of disabled, and the safety conditions in occupations covered by the system (also see note 1). However, it seems likely that the participation of private pension funds and insurance companies in the assessment procedure and the incentives facing these organizations is an important part of the story. We test this hypothesis, while holding country-specific factors constant, by comparing disability hazard rates in the new Chilean system with the old one, which was broadly similar to public systems in other countries.
Inflow to disability benefit status, Chile vs. US and OECD, 1999
(new inflow, per thousand in insured population).

Notes: Chilean data calculated by authors from claims and assessment data supplied by Association of AFPs, contributor and member data supplied by SAFP. Only disabled who are insured are included here – in 1999 this was about 70% of those who were granted disabled status in Chile. Inflow to temporary disability status is given; inflow to permanent disability status would be about 75%, depending on age. Ratios are given as % of [(members+contributors)/2] since insured population includes some affiliates who are not currently contributing.
OECD numbers are newly disabled beneficiaries as % of (population in the relevant age group, minus the stock of people in that age group who are already on disability benefits). The denominator includes some people who are not eligible for insurance. If this definition were used for Chile, Chile's disability rate would be lower than given here.
Source: OECD data from OECD (2003: 81).
2 Testing the new-system impact
2.1 The sample
To isolate the impact of system procedures and incentives, we apply the Cox proportional hazard model to a recent sample survey of new- and old-system affiliates (EPS, 2002). EPS is a large retrospective survey, with about 17,000 observations, that was conducted in 2002 and is representative of the universe of people who were affiliated with the new or old systems at some point between 1982 and 2001. We know each individual's system affiliation and age in 2002, work history, age of death, disability or old age pension (if relevant), schooling, sex and marital status. We are interested in the propensity of these affiliates to become disabled pensioners and whether this propensity is different under the new and old systems, after controlling for other factors that might affect the disability hazard.
To carry out this analysis, from this large sample we constructed a sub-sample of individuals who were born between 1932 and 1962. Individuals born before 1932 pose potential survival bias and memory problems, discussed later. We focus our analysis on the hazard of disability pensioning between ages 40 and 64, because disability pensions below age 40 are a very low probability occurrence, and eligibility stops at age 65 for men, 60 for women. Effectively, this means that we omit cohorts who were born after 1962, who were under 40 by 2002.
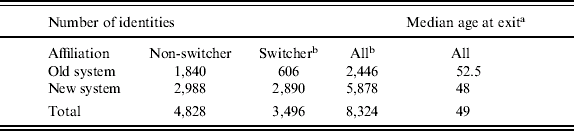
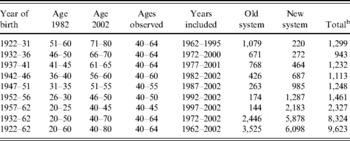
Applying these cohort cut-off criteria, we create a sub-sample consisting of 1,840 individuals born 1932–62 who were old-system affiliates throughout their working lives, 2,988 who were new-system affiliates throughout their working lives, and 2,890 who were old-system affiliates initially but switched to new-system affiliation. We construct the retrospective work histories of these individuals, going back to age 40 in the old system, age 40 (or age in 1982, if greater than 40) in the new system. Of course, old-system members come disproportionately from earlier cohorts and are observed disproportionately at older ages than new-system members. Nevertheless, there is substantial overlap in cohorts, ages, and years observed in the old and new systems (Tables 2, 3, and 4).
Main sample composition by old vs. new systems, 1932–62 cohorts >age 40

Notes:a In 2002 or year of pension or death if sooner, or 1982 for old-system switchers.
b Includes duplicate identities for 606 individuals >age 40 who were in old system pre-1982 but switched to new system in 1982; they are considered switchers in both systems.
Sample composition by birth cohorts, 1922–62Footnote a

Notes:a Main sample contains 1932–62 cohorts. Expanded sample adds 1922–31 cohorts.
b Includes duplicate identities for individuals >age 40 who were in old system pre-1982 but switched to new system: 606 for 1932–62 sample and 765 for 1922–62 sample.
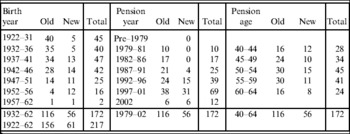
Sample of disability pensioners by birth year, pension year and pension ageFootnote a

Note:a Numbers by pension year and pension age are given for 1932–62 cohorts (main sample).
Workers who switched systems posed a special problem – they are treated as if they were in the old-system sample before 1982 and the new-system sample afterwards.Footnote 10 By definition, they all appear in our analysis of new-system hazards. However, they appear in our old-system analysis only if they were at least 40 years old in 1982. In reality, most switchers were younger than 40 in 1982, leaving just 606 switchers to be included in our old-system sub-sample. We create a double identity for these 606 switchers – one in the old system prior to 1982 and one in the new system afterwards; they are identical except for system affiliation, ages and years observed.
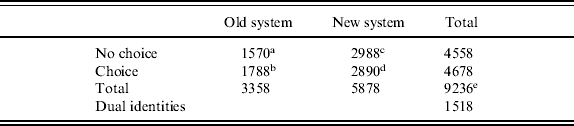
Therefore, we end up with 8,324 identities (1,840+2,988+2,890+606), of whom 70% are in the new system (Table 2). Disability pensioners comprise about 2% of the total, or 172 individuals, one-third of whom are in the new system (Table 4).Footnote 11 For our analysis of selection bias in a later section, we divide this sample into groups that had choice of system versus those who were assigned and had no choice (Tables 5 and 6).
Main sample composition by choice vs. no choice, 1932–62 cohorts >age 40

Notes:a Includes all old-system members >age 40 before 1982: 964 who remained in old system plus 606 who switched to new system after 1982. Dual identities were created in choice groups post-1982 for these individuals minus 52 who remained in old system because they became pensioners before 1982. (An additional 876+2,284=3,160 old-system members pre-1982 were <age 40 in 1982 and appear only in the post-82 choice group sample; see notes b and d.)
b Includes 964 members >40 in 1982 who remained in old system post-1982 +876 members <age 40 in 1982 who remained in old system −52 who pensioned pre-1982.
c Corresponds to all lifetime new-system members (entered labor force after 1982).
d Corresponds to all who switched out of old system into new system in 1982; this includes 606 who were >40 in 1982+2,284 who were <40 in 1982.
e This total is greater than total in Table 2 because dual identity is created for 912 old-system members who were in no-choice group before 1982, choice group after 1982 (912=962 members−52 pensioners pre-1982).
New- and old-system disability pensioners by choice vs. no-choice, 1932–2002 cohorts >age 40

2.2 Kaplan–Meier survival functions for new and old systems
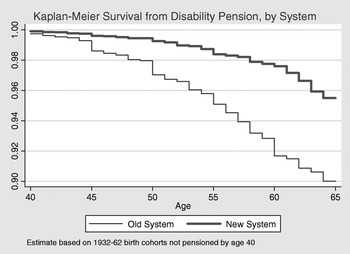
We start by examining Kaplan–Meier survival functions, separately for the new and old systems (Figure 1), for ages 40–64. This shows us the cumulative probability (CumS aget) that an individual who is a member of the ‘at risk group’ will remain without a disability pension up to a given age, t. It is obtained by multiplying the single-year survival rates (S aget) for all preceding ages, up to and including age t. We define the ‘at risk’ group at a given age as all individuals who reach that age without a disability or old age pension, and the hazard of dropping out as a disability pensioner is the proportion of the at-risk group who become a new disabled pensioner at that age. These are the ‘failures’ and the rest are ‘survivors’.Footnote 12

where:
S aget=% atriskt who survived through age t=1−(failurest/atriskt)
atriskt=atrisk t−1−failures t−1−dropoutst+newentrants t
failures t=number of newly disabled during age t
dropoutst=number atrisk t−1who died or became old age pensioners by t
newentrantst=number of new entrants to system between age t−1 and t
atrisk 40=all non-pensioner affiliates at start of age 40
S age40=% atrisk 40who survived through age 40=1−(failures 40/atrisk 40)
Kaplan–Meier survival as non-disability-pensioner, by system

It is immediately apparent from the K-M curve in Figure 1 that new-system affiliates have a substantially higher probability of surviving as non-disability-pensioners than old-system affiliates. For example, among old-system affiliates at age 40, 4.9% were likely to become disability pensioners by age 55, against just 1.6% of new-system affiliates. We proceed to estimate the Cox proportional hazard model, which allows us to control for other factors and to establish whether these differences are statistically significant.
2.3 Cox proportional hazard model
The Cox proportional hazard model estimates a baseline hazard function (in which the values of co-variates are fixed) and the impact of co-variate variation on this hazard. It enables us to estimate age-specific hazards and the statistical significance of differences due to co-variates. It is based on the assumption that the hazard, h(t) (i.e. the proportion of the population at risk that becomes a newly disabled pensioner at age t), is

where:
h(t) is the hazard, given the values of co-variates
h 0(t) is the baseline hazard, setting co-variates to zero or other fixed value
Xi is a vector of covariates
β is a vector of parameters to be estimated.
Dividing both sides of the equation by h0(t) we obtain

That is, the model assumes that the effect of Xiβ is proportional over all ages covered by the baseline hazard, hence the term proportional hazard function. Our main object is to measure the impact of the co-variate ‘new system’, which we represent by a dummy variable equal to 1 for those affiliated to the new system. The baseline hazard applies to old-system affiliates. A β different from zero (or an exponentiated β different from 1) would lead us to reject the hypothesis that individuals of the same age have the same disability hazard in the two systems. In that case, estimated coefficients give the amount by which the baseline hazard must be multiplied to obtain the new-system hazard. We include a second co-variate, unemployment rate, which may have direct effects on the hazard of disability that might affect the measured system impact. In the baseline, this is set at 10%, which is about average for the period. In some specifications we include education as a co-variate but this did not significantly affect the baseline hazard or the reform effect, so we present most of our results without education – see below.
A proportional effect over all ages would imply that the ratio of hazards with and without co-variates is constant for all ages. Initial estimates for our data indicated that the proportionality assumption does not hold for the entire baseline. Therefore, we split the baseline into five sections (40–44, 45–49, 50–54, 55–59, and 60–64) to make the proportionality rule applicable over pre-established sections. Instead of estimating one coefficient for the effect of new system and unemployment rate, we estimate five coefficients, one for each age group.
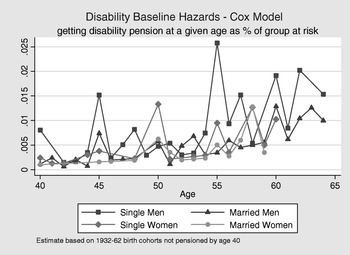
Tests further showed that baseline disability hazards vary by individual characteristics such as sex and marital status, so we estimate the Cox model stratified by these two variables. In other words, we allow for differences in the baseline hazard between men and women, married and singles, while constraining the proportionate impact of the co-variates to be the same for both genders and marriage groups. The estimated baseline hazards are lower for women than men and for married over single individuals (Figure 2). Baseline hazards are zero for women in the age range 60–64, since disability pensioning is ruled out after normal retirement age, which is 60 for women, 65 for men. Baseline hazards generally increase with age and peak at five-year intervals (ages 50, 55, 60).
Baseline disability hazards by gender and marital status
(getting disability pension at a given age as % of group at risk).

2.4 The new-system impact
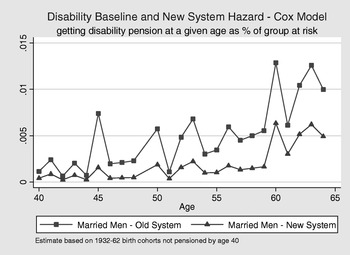
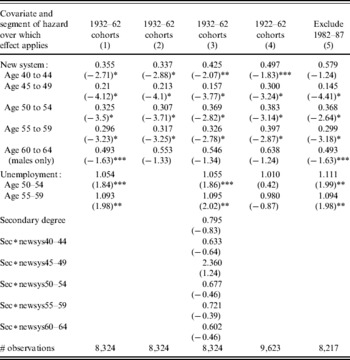
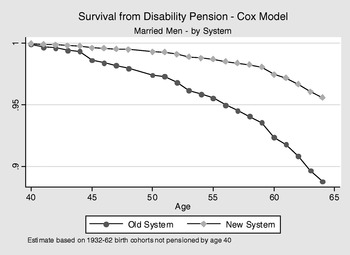
Applying the Cox model, the exponentiated coefficients for the ‘new-system’ dummies are far smaller than one and significant at the 1% level in all the age ranges between 40 and 59. Over most ages, workers in the new system are only 21–35% as likely to start a disability pension as they were in the old system. The largest new-system decline occurs at ages 45–49, while the smallest is for ages 60–64 (the latter was tested for men only and was only marginally significant) (Table 7, col. 1). These differences in hazard rates are similar to the difference in stock of disability pensioners (relative to retirement pensioners) in the new and old systems in Chile.Footnote 13 They are also roughly similar to the observed differences in incidence between Chile and other countries with traditional systems. Figure 3 compares the old-system (baseline) hazard and the new-system hazard (baseline∗estimated coefficients for each age range) for married men.
New vs. old-system disability hazards for married men
(getting disability pension at a given age as % of group at risk).

Determinants of hazard of disability pension for 1932–62 cohorts
(Cox proportional hazard stratified by sex and marital status; numbers given are hazard ratios relative to baseline).

Notes: *Significant at 1% level or less.
** Significant at greater than 1% but less than 5% level.
*** Marginally significant at less than 10% level.
Baseline differs by sex and marital status, but impact of co-variates relative to baseline is same for all. Numbers in parentheses are z-statistics.
To obtain the Cox model survival function we calculate (1-hazard rate) cumulatively for the old system and (1-baseline hazard∗estimated coefficient) for the new system, separately for married and single men and women, holding unemployment constant at 10% (Figure 4). As expected, in each case the estimated new-system survival functions are far above the old-system estimates. Although the single-age hazard rates become closer after age 60, the cumulative survival function remains higher in the new system through age 65, because of the larger number of survivals from earlier ages. These results are consistent with the hypothesis that the assessment procedure in the new system has had a strong negative impact on the rate of successful disability claims, compared with the old public disability insurance system.Footnote 14
Survival as non-disability pensioner, married men – Cox model
(married men – by system).

2.5 Effect of changing unemployment rates on disability hazard and new-system effect
It is often observed, in the US and other countries, that disability claims rise during periods of unemployment, as individuals lose their jobs, can't find new ones, and may try to avail themselves of disability benefits (see Rupp and Stapleton, Reference Rupp and Stapleton1995 and Reference Rupp and Stapleton1998; Gruber, Reference Gruber2000; Autor and Duggan, Reference Autor and Duggan2003; Duggan and Imberman, Reference Duggan, Imberman, David and David2006; Autor and Duggan, Reference Autor and Duggan2006; von Wachter et al., Reference Von Wachter, Till and Manchester2007; also see Castro, Reference Castro2005). Then, if unemployment rates were higher during earlier periods in Chile, this could help explain the higher disability rates observed for the old system.
We were able to disentangle the effects of new system and unemployment because there is a fair degree of overlap in the years at risk and years of pensioning of old- and new-system affiliates (see Tables 3 and 4). Additionally, the Chilean economy went through cyclical upturns and downturns both before and after the reform. Unemployment was low through the 1960s, reaching 3% in 1973, then rose sharply to 23% by 1982, during a period of economic chaos and hyper-inflation. Post-reform, the economy went through a period of prolonged growth during which unemployment fell to 6% by 1995 but then rose during a cyclical downturn, reaching 14% by 2002.
In earlier work on old age pension probabilities, we found that age-specific probabilities of pensioning rose during periods of high unemployment – but this did not change the reform effect (Edwards and James, Reference Edwards and James2005). That is exactly what we found here, for disability pensioning. Individuals at risk in periods of higher unemployment have a higher risk of becoming a disability pensioner. Specifically, in our main specification this probability rises 5–9 percentage points for each one percentage point increase in the unemployment rate for individuals in their 50s (but in the specification that includes earlier cohorts the unemployment rate becomes insignificant; apparently this variable is sensitive to choice of cohorts and time periods). However, the new-system effect barely changes when unemployment is in the equation – in fact, it become stronger for some ages (compare columns 1, 2, and 4 in Table 7).
2.6 Impact of education on hazards and system effects
Low income and education levels may also increase disability risk. Blue-collar workers may have a higher probability of injury than white-collar workers and high earners may have better access to preventative and remedial medical care that prevents long-lasting disability. Additionally, high earners may be less likely to file for disability benefits as their wage rates are higher, and their accounts may be larger due to more sustained work, hence gains from the insurance top-up are smaller. If high earners with white-collar jobs were more likely to switch to the new system, this could result in an overestimate of the new-system effect on hazard rates.
We do not know the previous wage levels of pensioners, most of whom no longer work. However, we use education as a proxy for permanent earning capacity. We experimented with several specifications, to test if differences in schooling levels are driving the new-system effect. First, we ran the hazard model with years of education as a co-variate and this turned out to be insignificant. Second, we estimated the model with a dummy for those who had a secondary degree or higher. This depresses hazard rates, as expected, but the effect is not significant and the other coefficients do not change. Third, we added an interaction term between secondary and system, and found that the new-system effect is stronger for those with secondary degrees. However, this effect, too, is insignificant, while the main new-system effect remains strong and significant (col. 3, Table 7). Fourth, given that most disability pensioners in our sample (143 out of 172) do not have a secondary degree, we reran the model for the sub-sample with lower education, and again obtained the same results – a highly significant reform impact. We conclude that education, and selection based on education, are not driving these results.
2.7 Survivor bias and results with enlarged sub-sample
To see if these results are sensitive to our definition of sub-sample, we add cohorts born 1922–31, most of whom were in the old system (see Tables 3 and 4). The trade-off for the gains from sample enlargement is greater potential memory error by individuals about events from the distant past, missing time-specific variables that may be responsible for some of the change in disability rates, and survivor bias, which may lead to an underestimate of old-system hazards and hazard reductions in the new system. If underlying health and safety conditions were worse in earlier years, the new-system advantage might appear to grow as earlier cohorts are added, but this would be an overestimate of the true advantage. However, this potential overestimate is offset by the fact that medical reasons for disability changed over time to include broader diagnoses such as psychiatric problems and back pains, which constitute an increasing proportion of the total and would be expected to add to total disability hazards, ceteris paribus.Footnote 15
On survivor bias, the EPS is a retrospective survey, representative of the universe of affiliates in the new and old systems between 1982 and 2001. But affiliates who died before 1982 were not included. Disabled pensioners are likely to have higher death rates than non-disabled. In the US, for example, mortality rates for disabled pensioners aged 35–55 after ten years of disability status are three times higher than for those who applied but were denied disability status (30% vs. 10%, Von Wachter et al., Reference Von Wachter, Till and Manchester2007). If that is the case in Chile, the proportionate exclusion of the disabled due to death before 1982 would far exceed the proportionate exclusion of the at-risk group. All of these individuals were in the old system. Therefore, survivor bias would understate the size of the disability hazard in the old system and the hazard reduction in the new system. This understatement would apply particularly to cohorts born before 1932, whose members were more likely to die before 1982. Survivor bias is further compounded by the possibility that individuals who died after 1982 may also have been undercounted, as a result of practical difficulties in getting information about them in 2002.Footnote 16 To estimate these effects, we use mortality tables (RV98) from Chile to calculate the proportion of affiliates from various cohorts, alive at age 40, who were expected to die before 1982 and therefore never appeared in the sample frame, as well as those who died after 1982 but were unreported. The numbers are consistent with our expectation that understatement of disability hazards in the old system and hazard reduction from the new system are likely to be small in the main sample but much larger in the expanded sample.Footnote 17
Indeed, when we ran the Cox model we found that baseline hazards obtained from the enlarged sample are lower than those obtained from the main sample. The impact of the reform also falls slightly. Nevertheless, it remains highly significant. The new system reduces disability hazards by 60–70% at the 1% significance level for ages 45–59 (marginally significant for ages 40–44) in the expanded sample, compared with a 65–80% reduction in our main analysis (Table 7, col. 4).
2.8 Testing for selection bias: choice versus no-choice groups
The biggest challenge to these results is the possibility of selection bias. Since many members of our sample chose their system, rather than being randomly assigned, it is possible that selection bias is present. Those who thought they had a higher probability of applying for disability benefits may have stayed in the old system because of the greater likelihood that their claim would be approved and the greater uncertainty about how the new system would operate. Additionally, AFPs may have discouraged from membership those who they considered to be more prone to disability (James and Iglesias, Reference James, Martinez and Iglesias2006). In that case, the observed reduction in disability hazards might be due to the fact that the new system attracted individuals who had a low risk a priori rather than to new-system procedures that cut hazards.Footnote 18
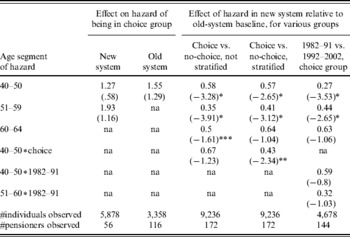
We carried out several tests to investigate this possibility. Our negative findings for selection based on education were already discussed above. In this section, we draw upon the fact that our sample includes groups who had choice as well as some (pre-1982 observations and new entrants to the labor market post-1982) who had no-choice. We derive hypotheses about what the relative disability hazards would be between the choice and no-choice groups in the old versus new systems if selection bias were driving our results. Tests of these hypotheses indicate that selection bias between systems is not a major factor; it does not invalidate our initial results.
We start by dividing our subjects into four groups: no-choice in old system (observed 1972–81), with choice in old system (observed in old system 1982–2002 but with some prior employment before 1982), with choice in new system (observed in new system 1982–2002 but with some prior employment before 1982), and no-choice in new system (entered labor market after 1982 and observed up to 2002) (see Tables 5 and 6).Footnote 19 Members of the no-choice groups were assigned to their respective systems, therefore pose no selection issues. By contrast, members of the choice groups chose their systems and therefore pose potential selection bias.
This disaggregation of our sample presents some problems. As we disaggregate by choice, we end up with a small number of disability pensioners in each group, especially in the no-choice group, which has only 28 pensioners between the two systems. In addition, we only observe ages 40–50 for the old-system no-choice group; by the time they exceed age 50 it was already post-1982 and they had choice. Furthermore, members of the new-system no-choice group, who entered the labor market after 1982, are relatively young; this helps account for the small number of disability pensioners – most disability occurs after age 50. Finally, the no-choice people in the old system were born 1932–41 and are observed in the years 1972–81, in contrast to the no-choice people in the new system who were (almost) all born after 1941 and are observed after 1982. The absence of overlap in birth and observation years of the two systems means that a comparison of the two no-choice groups is more subject to survivor bias and other time-specific forces than is a comparison of the two systems as a whole. Indeed, these are the reasons why we didn't confine our entire analysis to the no-choice groups.
We proceed with hypotheses about the impact of selection bias. If individuals with higher disability propensities chose to stay in the old system after 1982, we should observe differences in disability hazards for the choice vs. no-choice groups in both systems, as well as differences in the new-system impact on these groups and over time.
1. In the new system, age-specific disability hazards will be higher for individuals who entered the labor market after 1982 (no-choice), compared with individuals who voluntarily switched to the new system in 1982
To test this hypothesis we apply the Cox model to new-system observations, derive the baseline hazard for the no-choice group, and estimate the impact of the co-variate, membership in the choice group. As in our previous regressions, we stratify by gender and marital status and control for unemployment rate. Contrary to the selection hypothesis, we find no difference in disability hazards between the choice and no-choice groups in the new system (Table 8, column 1).
Disability hazards: selection bias tests based on choice and no-choice groups

Notes: Column 1 gives effect of co-variate – being in choice group – relative to baseline hazards for no-choice group (for new-system members only).
Column 2 gives same for old-system members only.
Column 3 gives effect of co-variate – being in new system – relative to baseline hazards for old system (with interaction term for choice group, not stratified by choice). Ages 51–64 applies to choice group only, since we do not have old-system no-choice observations in this age range. Ages 40–50 apply to both groups. 40–50∗choice interacts this age group with choice.
Column 4 gives same, stratified by choice. Since interaction term is significant, coefficient for choice group ages 40–50=0.57∗0.43=0.25.
Column 5 gives effect of co-variate – being in new system – relative to baseline hazards for old system (with interaction term for early period, 1982–91, stratified by period).
* Significant at 1% level or less.
** Significant at greater than 1% but less than 5% level.
*** Marginally significant at less than 11% level.
All regressions include unemployment rates. Baseline differs by sex and marital status, but impact of co-variate relative to baseline does not vary by gender or marital status. Numbers in parentheses are z-statistics.
2. In the old system, age-specific disability hazards will be lower for no-choice individuals who were in the old system before 1982, compared with those who voluntarily stayed in the old system after 1982
To test this, we apply the Cox model to old-system observations, derive the baseline hazard for the no-choice group and estimate the impact of the co-variate, membership in the choice group. We carry out this analysis only for ages 40–50, since we have no observations beyond age 50. Although the hazard is higher for the choice group, this difference is not statistically significant (Table 8, column 2).
3. Differential new-system effects for choice vs. no-choice groups
If selection bias is important, the reduction in disability hazards for new-system members should appear greater for the choice groups than the no-choice groups – but this would be, in part, a consequence of selection rather than real cost reduction. If the entire result is due to selection, the new-system effect would disappear for the no-choice groups.
The results just depicted for tests #1 and #2 suggest that we will not find this differentiated new-system effect, but we test this hypothesis directly, using the Cox model to estimate the old-system baseline and new-system effect, interacting new system with choice and thereby allowing the new-system effect to vary between the two groups. Since we don't have observations in the old-system no-choice group beyond age 50, the main terms after that age apply to the choice group only. The main term for ages 40–50 applies to both groups, and the interaction term modifies this for the choice group.
Results from test #2 suggest that we should not stratify the baseline by choice. In this case, the main new-system effect is highly significant, reducing disability hazards by 40–65% for both groups for ages 40–59, and the interaction term is insignificant – contrary to the selection hypothesis. If, in contrast, we do stratify the baseline by choice, the main terms remain significant and of roughly the same magnitude, but the interaction coefficient also becomes significant (apparently due to the insignificantly higher disability hazard for the choice group in the old system). For the choice group, disability hazards are reduced by 76% (=1–0.57*0.43) for ages 40–50 and by 60% for ages 51–59. The new-system coefficient is smaller but still significant for the no-choice group, reducing disability hazards by 43% in the observed age range of 40–50. This suggests that some selection may be present, but selection does not account for the entire new-system effect, which remains strong both in the choice and no-choice groups (Table 8, cols. 3 and 4).
4. New-system effect in early versus late periods for choice group
Workers are likely to have more information about their near-future disability propensities than their far-future propensities. Then, if selection created the reduced disability hazards, we would expect the new-system effect to be concentrated in years closer to 1982. To test this hypothesis, we divide the period 1982–2002 into two sub-periods, 1982–91 and 1992–2002, and compare the old-system baseline and new-system coefficient for the choice group for these two sub-periods. For this analysis we exclude all observations prior to 1982 so the two systems co-exist throughout the years observed, and we include all individuals who were age 40 or over at some point within their respective periods. We ran the Cox model for these observations, stratifying by period to allow the baseline to vary and interacting with period to allow the new-system effect to vary. The main terms are highly significant for ages 40–59, indicating hazard reductions of 56–73% for both periods, and the interaction terms are insignificant – contrary to the selection hypothesis (Table 8, col. 5). We also re-ran our main regression omitting all observations during years 1982–87, which were most likely to be sensitive to selection bias. We got very similar results to those for the full set of years (Table 7, column 5).
Overall, these tests indicate that some selection bias may be present but it does not account for most of the new-system effect on disability hazards.
2.9 Mortality rates as an indicator of system stringency and accuracy
To further determine whether differential assessment standards and countervailing information are responsible for the lower hazard rates, we sought direct evidence on severity of approved disability claims. If the new system got its lower hazard rates though selection of healthier workers as members, disabled pensioners in both systems would have a similar severity of disability but would simply be scarcer in the new system. In contrast, if the reduction in hazard rates were due to more stringent assessment procedures, disabled pensioners in the new system would tend to have more severe disabilities.
We use comparative mortality rates among pensioners in the new versus old systems as a test of whether the new procedures are causing the lower hazard rates and also as a test of the accuracy of the assessment standards (see von Wachter et al., Reference Von Wachter, Till and Manchester2007, for use of mortality rates as a test of accuracy in the US system). Of course, mortality rates are only one dimension of disability severity. If a constant standard of severity were being applied, we might find lower aggregate mortality rates among new-system pensioners because of the shift in diagnoses toward psychiatric and other chronic conditions and away from cardiac conditions.Footnote 20 If, instead, mortality rates are higher in the new system, this suggests that the severity bar has been raised substantially, that benefits have been targeted toward the more medically disabled, and hazard rates have been cut by rejecting the lesser end of the medically disabled distribution.
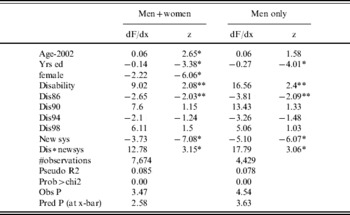
We start by using probit models to estimate the probability of death by 2002 of disabled pensioners and non-disabled affiliates in the old and new systems, controlling for age, gender, years of education, and period of exposure to disabled status. Because those who died before 1982 are not included in the sample frame, we confine the analysis to those who pensioned after 1982. (This means that we omit members of the old-system no-choice group from the mortality analysis and that years observed in the new and old system years are all overlapping.) We caution that these results should be regarded as preliminary since the number of dead disability pensioners is small.
Not surprisingly, the probits show that the disabled have a (9 percentage point) higher probability of death by 2002 than the non-disabled. Every year of age increases the probability of death, women have lower mortality rates than men, and more education means lower death rates. Those who pensioned after 1986 are less likely to have died by 2002 than the others because they have fewer years of exposure.Footnote 21 These effects are all significant at the 5% level or less (Table 9). Most important for our purposes, the dummy variable for new system has a negative (almost 4 percentage points) effect on mortality rates but the interaction between new-system and disability pensioners has a large (13 percentage point) positive coefficient, significant at the 1% level, after controlling for these other factors. In other words, life survival for the non-disabled increases in the new system, possibly due to health improvements for later cohorts. However, life survival for disabled pensioners drops dramatically. The new-system coefficient for disability deaths is even larger (18 percentage points) when we run the same regression for men only.
Probit analysis of mortality rates in new vs. old systems
(change in probability of dying by 2002 in percentage points). Probit regression, reporting marginal effects.

Notes:* Significant at 1% level or less.
** Significant at greater than 1% but less than 5% level.
Dis86=started disability pension 1986 or after, relative to 1982–85.
Dis90=incremental effect of starting disability pension 1990 or after; this is added to Dis86 to get total effect for pensioning 1990 or after relative to 1982–85. And so on.
New sys=new-system affiliate.
Dis∗newsys= disability pensioner in new system.
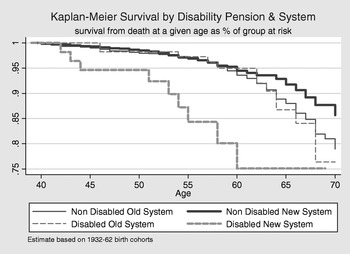
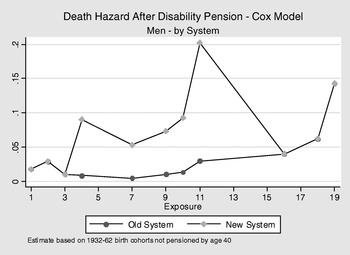
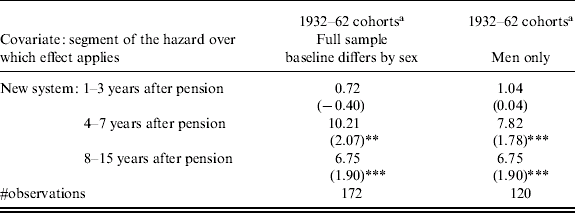
To investigate this issue further, we develop Kaplan–Meier life-survival curves by age and Cox proportional hazard regressions of the hazard of dying, by year of exposure to the disability pensioner state. In this case, those ‘at risk’ are all disability pensioners (disabled) or all other affiliates (non-disabled), the ‘failures’ are those who die and the ‘survivors’ are those who live. It turns out that, in the old system, age-specific Kaplan–Meier survival probabilities are practically the same for disability pensioners and other affiliates (Figure 5). Apparently ‘disability’ does not target those with higher expected mortality rates in the old system. In contrast, a wide disparity opens up between survival rates of disabled and other affiliates in the new system. Apparently, the new system does an effective job of sorting between disabled and non-disabled. The Cox model further shows that the hazard of dying within three years of disability pensioning is the same for the two systems, but the hazard of dying within the next 12 years is much greater for the new system, implying far lower life-survival probabilities (Table 10 and Figure 6).
Kaplan–Meier: Survival rates (not dying) by disability status and system
(survival from death at a given ages as % of group at risk).

Cox model: death hazard among disability pensioners, by system
(men – by system).

Estimates of determinants of hazard of death after disability pension
(Cox proportional hazard model; hazard ratios relative to old-system baseline).

Notes:a For group that started pension 1982 or afterwards.
* Significant at 1% level or less.
** Significant at greater than 1% but less than 5% level.
*** Marginally significant at less than 10% level.
Numbers in parentheses are z-statistics.
Thus, the new system seems to reduce the incidence of successful disability claims by targeting those individuals with the most severe medical problems, who have much higher mortality rates than disabled pensioners in the old system or non-disabled affiliates in the new system.Footnote 22
3 What can other countries learn from the Chilean experiment?
Countries around the world are faced with rising costs of old age security programs. In many countries, disability expenditures are a high proportion of total social security costs and have been rising even faster than old age expenditures. The Chilean experience shows that costs can be contained, quite drastically, by adopting procedures and incentives that favor this goal. But it also raises questions about the degree to which this is socially desirable.
The Chilean system for disability insurance has two innovative features that help contain costs: it is pre-funded (which reduces fees in the long run; see James and Iglesias, Reference James, Martinez and Iglesias2006) and it utilizes private pecuniary incentives to dampen successful claims (on which this paper has focused). Pre-funding takes place in two stages: first, building the retirement accounts through the worker's career and, second, using an ‘additional payment’ when he becomes disabled to enable the purchase of a lifetime defined benefit. AFPs charge an insurance fee that covers the ‘additional payment’ and have an incentive to keep costs low by controlling successful claims.
The assessment process includes participation by private AFPs and insurance companies and enables them to pursue this objective. We hypothesize that the pressure they create toward strict medical criteria and tight application of these criteria, as well as their right to present countervailing information and appeal initial evaluations, have the effect of reducing the incidence of approved disability cases. Our calculations of hazard and survival rates, using the Cox proportional hazard model and a retrospective data set of new- and old-system affiliates (EPS, 2002) show significantly lower hazards of becoming disability pensioners in the new system. These hazards are cut by 65–80% compared with the old system, after controlling for other variables that might affect outcomes. Tests for selection bias, largely based on analysis of choice versus no-choice groups in the two systems, rule this out as the major explanation. Comparisons of mortality rates among new- and old-system disability pensioners suggest that this reduction in disability hazard is achieved by targeting those with the most severe medical conditions: life survival rises in the new system for non-disabled affiliates, but falls for the disabled.
A reduction in approved disability claims would not be socially desirable if those who are rejected are indeed disabled. Similarly, an increase in approved claims would not be socially desirable if those who receive benefits are not disabled. Our analysis indicates that the new system has cut costs by effectively sorting between those who are more versus less disabled, as measured by relative mortality rates, whereas the old system did not. However, in reality disability is hard to define and probably consists of a continuum with many dimensions other than expected mortality rates. Value judgments are involved in where to draw the line and by which definition of disability. The very low hazard rates in Chile's new system suggest it has chosen to emphasize hard conditions and to minimize type 1 errors (false positives) at the possible expense of more type 2 errors (false negatives), while the old system made the opposite choices.
To avoid the false negatives, some societies might wish to grant disability insurance benefits more liberally, even though this will cost more and may involve more false positives. In fact, Chile has made a move in that direction in its 2008 reforms.Footnote 23 Other countries, however, consider their current disability hazard rates and costs excessive, in the sense that they impose heavy insurance fees on non-disabled workers. The main lesson they might learn from Chile is that costs can be contained by introducing stringent procedures, countervailing information, and incentives with this goal. These include the development of careful definitions of disability that are uniformly followed, the possible participation of private organizations, allowing private organizations and public agencies to appeal, and permitting them to be represented by third parties (such as lawyers) who have a financial interest in winning.Footnote 24 This would increase the probability that information favoring both sides would be forcefully presented, which might save money and lead to greater accuracy at the same time.