I. INTRODUCTION
Solid-state heat transfer plays a vital role in a variety of high-technology applications including microelectronics, power electronics, and high-power lasers. Efficient transport of heat from an operating device prolongs its lifetime and reduces system operating costs. In particular, effective thermal management is a critical technology requirement for wide bandgap semiconductor (primarily SiC and GaN) power electronics and solid-state lighting. High current densities in power devices generate a significant amount of heat, which needs to be rapidly dissipated to prevent device degradation and failure. An additional consequence of efficient thermal management is that devices can be operated at higher ambient temperatures leading to systems that will be compact, lightweight, energy efficient, and cost effective. Therefore, there is a critical need to develop effective thermal management materials and technologies for a wide variety of applications.
The very high thermal conductivity of diamond (>20 W/cm K for single-crystal diamond) has attracted significant attention in recent years for thermal management applications.Reference Eden1–Reference Seal5 In particular, microwave plasma chemical vapor deposition (MPCVD) of diamond has enabled large-area conformal coatings of this material on a variety of substrates. Diamond thin films can be broadly classified into microcrystalline and nanocrystalline forms. MPCVD using H2-rich plasmas results in microcrystalline diamond (MCD) films. Although thick MCD (>50 μm) films exhibit high thermal conductivities (>15 W/cm K),Reference Graebner, Jin, Kammlott, Herb and Gardinier6 the surfaces of these films are very rough. The high surface roughness can be detrimental to effective heat transfer across interfaces because it can lead to significant scattering. Also, the columnar structure of MCD films can lead to highly anisotropic thermal properties, which may not be desirable in certain applications. On the other hand, nanocrystalline diamond (NCD) films, synthesized using Ar-rich plasmas, exhibit smooth surfaces but result in low thermal conductivity.Reference Ralchenko, Pimenov, Konov, Khomich, Saveliev, Popovich, Vlasov, Zavedeev, Bozhko, Loubnin and Khmelnitskii7, Reference Liu, Shamsa, Calizo, Balandin, Ralchenko, Popovich and Saveliev8
To date, diamond-based thermal management research has focused on either microcrystalline or nanocrystalline morphologies. However, due to the drawbacks discussed above, MCD or NCD films have found limited use in thermal management applications. In this context, we believe that there exists a unique opportunity to combine the smoothness of NCD films with the high thermal conductivity of MCD films by depositing multilayered MCD/NCD films for thermal management applications.
To date, the majority of published literatureReference Catledge, Baker, Tarvin and Vohra9–Reference Zhang, Tanaka, Xu and Koga17 has dealt with the use of multilayered diamond and diamond-like carbon coatings for wear resistance applications. Further, all the references quoted above do not use Ar-based plasma chemistries for diamond synthesis. For instance, Catledge et al.Reference Catledge, Baker, Tarvin and Vohra9 changed the morphology of the films by turning the N2 flow into a H2 plasma on and off. Although some data were presented on the quality of the films, the main emphasis of the article was on in situ measurements of surface roughness and growth rate using laser-based interferometry. In essence, there is no published study that provides information on the development of MPCVD process conditions for multilayered MCD/NCD films using Ar-rich plasma chemistries.
In this article, we discuss the development of process conditions for multilayered diamond films. The fundamental assumptions in carrying out the studies described in the article are (a) there is direct correlation between the Ar concentration in the gas phase and the morphology and phase purity of “single layers” of diamond thin films, and (b) it is possible (although, to the authors knowledge, not demonstrated prior to the work presented herein) to control the morphology and phase purity of “multilayered” diamond films by varying the process conditions of individual layers in the multilayer diamond film. In particular, the primary goals of this article are
(i) To establish a process parameter space that leads to multilayer diamond deposition using Ar-rich MPCVD gas chemistries.
(ii) To study the correlation of diamond film quality, in single and multilayer form, with the process conditions.
(iii) To demonstrate the feasibility of synthesizing multilayered diamond thin films using Ar-rich plasma chemistries.
It will be demonstrated in the following sections that the above goals have been realized to result in what we believe to be the first reported study on developing process conditions for multilayered diamond thin films using Ar-rich plasmas.
II. EXPERIMENTAL METHOD
To achieve successful multilayered diamond film deposition, it was first necessary to study the properties of the individual layers in detail. The idea behind such a study was to establish the correlation between process conditions and film quality for individual layers. Having established such a correlation, subsequent steps would involve transferring the conditions for individual layers to multilayered films and to study any effects peculiar to the multilayered structures. To realize these ends, the following strategy was used.
Previous studyReference Govindaraju, Das, Singh and Kosel18 has indicated that diamond films synthesized with gas ratios of 60:39:1 (Ar:H2:CH4) yielded good quality films with microcrystalline morphology, while higher Ar content (86%) resulted in diamond films with higher sp2 carbon content and a nanocrystalline morphology. These results are consistent with other studies reported in literature,Reference Das, Jayaseelan, Ramamurti, Kukreja, Guo and Singh19–Reference Gruen21 which show that increased Ar concentration in the gas phase resulted in lower diamond content in the film. A brief discussion is provided below about the correlation between Ar-content in the gas phase and the resultant film quality.Reference Gruen21
Traditional diamond thin film synthesis relies on CH4–H2 plasmas with high H2 content (99% for high-quality films). Under these conditions, diamond nucleates on the substrate surface and the morphology of the films evolves due to competitive growth between individual grains leading to a well-faceted grain structure. The main growth species under these conditions is thought to be the methyl (CH3) radical.Reference Gruen21 However, as Ar is added into the gas mixture by displacing H2 (CH4 constant at 1%), the predominant growth species changes to acetylene (C2H2; for H2 concentrations between 20 and 70%) and finally to the C2 dimer at high Ar concentrations (H2 < 10%).Reference Gruen21 When the predominant growth species is the C2 dimer (at high Ar content), the growth mechanisms drastically change resulting in significant renucleation of diamond.Reference Gruen21 This, in effect, results in the elimination of the faceted morphology. Further, since H2 plays a critical role in etching nondiamond carbon from the films, under high Ar concentrations there is a concomitant increase in nondiamond carbon content in the films.
The above observations provided the basis for the experimental strategy discussed below. A series of experiments were performed to determine the variation in diamond quality with increasing Ar content. The lower bound in Ar percentage in the gas phase was set to 90% for two reasons. First, as mentioned above, high Ar content in the gas phase results in nanocrystalline morphology. Second, the 60:39:1 (Ar:CH4:H2) gas ratio was chosen for one of the layers in the multilayered film, since this particular gas composition resulted in films with good phase purity and crystal quality.Reference Govindaraju, Das, Singh and Kosel18 Therefore, it was necessary to explore the process parameter space at high Ar contents in the gas phase. In the interests of brevity, in all subsequent discussions, only the gas phase ratios will be given without listing the corresponding gases. For example, a gas ratio of 60:39:1 would correspond to 60% Ar, 39% H2, and 1% CH4 in the gas ambient during deposition.
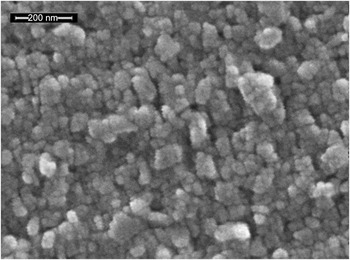
A MPCVD system (ASTEX 1.5 kW, 2.45 GHz, Woburn, MA) was used to deposit diamond on Si (100) substrates (p-type; 1–20 Ω cm). In general, the sample size was 1″ × 0.5″, which facilitated the placement of two samples for deposition over a 1″ × 1″ area. In case of the multilayered depositions with two different seeding layers (Section III.C), four ¼″ × ¼″ samples were used with two samples seeded with the same nucleation layer. The purpose of incorporating duplicate samples for all deposition runs was to ensure the characterization of the effect of every run on the diamond film quality and morphology. The sample stage in this system utilizes a radiofrequency heater to actively heat the substrate during film growth. The stage incorporates a thermocouple to measure the growth temperature. The thermocouple is located directly below the sample and is separated from it by an approximately ¼ in. thick graphite susceptor. An infrared pyrometer was also used to measure the surface temperature of the samples during growth. A novel seeding technique was developed to provide uniform diamond nucleation layers (average nuclei size: 25 nm). The purpose of developing the novel seeding technique was 2-fold. First, a uniform dense seeding layer will ensure the same starting conditions for all diamond deposition experiments. In other words, using an optimized seeding process will eliminate any experimental bias due variations in seeding technique. Second, in contrast to other seeding techniques such as ultrasonic agitation and bias enhanced nucleation, our seeding technique does not result in damage to the underlying substrate. Figure 1 shows a scanning electron microscope (SEM) micrograph of a Si(100) substrate seeded with NCD. The nucleation layer was found to be uniform over the entire substrate area. The substrate temperature was fixed at 850 °C (thermocouple temperature), and deposition pressures were between 50 and 60 Torr. These conditions were chosen as the starting point for this work. Once it is established that multilayer diamond deposition is feasible using Ar-based plasma chemistry, further research will be targeted to optimize the process conditions for specific thermal management applications.
Scanning electron microscope (SEM) micrograph of uniform nucleation on a Si substrate. The average particle size was 25 nm (100 kX; scale bar: 200 nm).

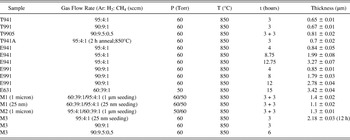
The growth conditions, sample designations, and thicknesses are presented in Table I. To reduce clutter and improve clarity, the temperatures listed in Table I refer to the thermocouple readings. Diamond thicknesses were calculated based on weight-gain measurements before and after diamond deposition. The weight-gain measurements were performed using a precision microbalance from Mettler-Toledo AG (Model: XS025DU; Greifensee, Switzerland) with a rated repeatability of 50 μg.
Process conditions for diamond deposition experiments.

III. RESULTS AND DISCUSSION
A. Individual layers: Short-duration deposition
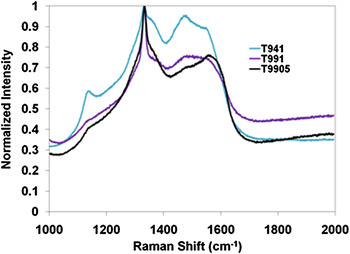
Three thin film diamond samples were synthesized under the conditions described above: T941, T991, and T9905. The corresponding gas ratios were 95:4:1, 90:9:1, and 90:9.5:0.5. Two gas compositions were chosen with varying Ar content (CH4: 1%), while the third gas composition halved the CH4 concentration for a fixed Ar content of 90%. The lower CH4 composition was chosen to check for the effect of reduced carbon precursor content on the growth rate and overall film quality. Three-hour depositions were initially performed because the resultant film thicknesses were close to a micron, which was the approximate value deemed appropriate for a single diamond layer in a multilayered diamond film. Figure 2 shows the micro-Raman spectra for the three samples after 3 h of deposition. The spectra were obtained using micro-Raman spectrometer (Nicolet Almega from Thermo Electron Corp., Madison, WI) equipped with a 532-nm laser (Nd:YVO4 DPSS; nominal power 25 mW; 50X objective). For ease of comparison, the spectra have been normalized with respect to the 1332 cm−1 first-order Raman peak attributed to diamond. It can be seen clearly from the plots that high Ar content in the gas phase results in broadening of the first-order Raman peak for diamond. Further, other features in the Raman spectra clearly indicate the presence of nondiamond carbon phases in the films.
Raman spectra plots of samples with Ar content at or above 90% in the gas phase. The spectra have been normalized with respect to the 1332 cm−1 diamond peak for ease of comparison. The improvement in film quality, with lower Ar content in the gas phase, is clearly apparent. Legend key: T941—95:4:1; T991—90:9:1; T9905—90:9.5:0.5 (see Table I).

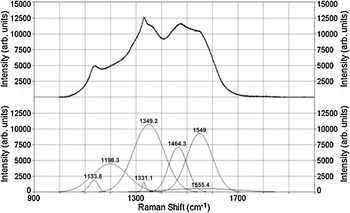
To evaluate the spectra in further detail and to quantify the diamond content in the films, the PeakFit software (Systat Software Inc., San Jose, CA) was used to deconvolute the spectra and to identify individual features within the same. A comprehensive referenceReference Zaitsev22 on optical properties of diamond was used to identify the individual features within a given spectrum. The result of such an analysis on sample T941 is presented in Fig. 3. The upper half of the figure presents the raw data, while the lower half shows the deconvoluted spectrum. It can be seen from this analysis that the 1332 cm−1 peak due to diamond is shifted to a lower value of 1331.1 cm−1. This shift is marginal and can be attributed to the lattice mismatch stress between the Si substrate and the diamond film. Other features evident in the deconvoluted spectra include a peak centered between 1120 and 1150 cm−1 indicative of disordered sp3 carbon in the films, peaks centered between 1180 and 1220 cm−1 and 1475 and 1564 cm−1 due to sp2-carbon and amorphous diamond, the graphite D-band (1310 and 1450 cm−1) and the graphite G-band (1520 and 1610 cm−1). It was clear from this analysis that there was a significant amount of nondiamond carbon content in the film. The following procedureReference Govindaraju, Das, Singh and Kosel18, Reference Das, Jayaseelan, Ramamurti, Kukreja, Guo and Singh19 was used to provide a quantitative basis of comparison of the quality of all diamond films presented in this article.
Deconvoluted spectra for sample T941 (see Fig. 2) showing individual contributions to the overall spectrum. A linear baseline fit was used to subtract the background.

The integrated area for each of the peaks in the deconvoluted spectra was calculated. This area was weighted with the scattering cross section for each of the different phases of carbon as detailed in Refs. Reference Govindaraju, Das, Singh and Kosel18,Reference Das, Jayaseelan, Ramamurti, Kukreja, Guo and Singh19. The percentage of diamond in each film was then calculated using the following equation.

where A d is the integrated area for the 1332 cm−1 diamond peak, Ai (i = 1, 2, 3, … n) is the integrated area for each nondiamond carbon phase, and Si is the scattering cross section for the ith nondiamond carbon component with respect to diamond (the scattering cross section of diamond is taken to be 1). The deconvolution analysis was done consistently using the same procedure to provide a basis for relative comparisons of different films.
For the following reasons, the procedure described above provides a better estimate of the diamond content in the film as compared to taking the ratios of peak intensities. The ratio of peak intensities, by definition, focuses on two particular features of the spectrum of which one is the 1332 cm−1 feature due to diamond. The other number in the ratio is, therefore, restricted to a single nondiamond carbon feature in the spectrum. As discussed above, there are a large number of features associated with nondiamond carbon in the entire spectrum. Therefore, the ratio method, by being confined to a single nondiamond carbon feature, can significantly underestimate the overall nondiamond carbon content in the film. In contrast, the integrated area approach [see Eq. (1)] not only accounts for the contributions from different nondiamond carbon phases but also factors into the calculation, the differing scattering cross sections for each form of carbon. Therefore, we believe that Eq. (1) is a better reflection of the quality of diamond films as compared to the ratio method.
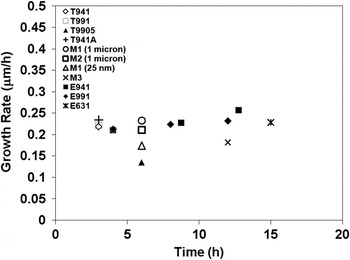
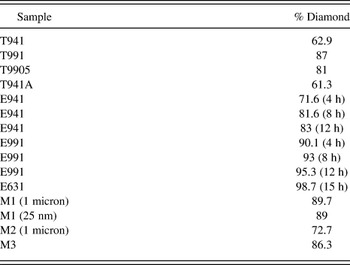
Table II summarizes the results of the diamond content analysis for all the films presented in this article. It can be seen that the diamond content in sample T941 (95% Ar) was significantly low at 62.9%. Decreasing the Ar content to 90% resulted in a significant gain in diamond content (87%; sample T991). These results are consistent with previous studies, which have shown that higher Ar content in the gas phase results in higher nondiamond carbon content in the films.Reference Govindaraju, Das, Singh and Kosel18–Reference Gruen21 The increase in nondiamond carbon content is attributed to the increase in concentration of C2 dimer in the presence of high Ar content in the plasma. High concentrations of C2 dimer in the gas phase are found to correlate with higher nondiamond carbon content in the film.Reference Gruen21 In contrast, H2-rich plasmas tend to form CH3 radicals leading to diamond growth.Reference Gruen21 It was also found that 50% reduction of the CH4 content resulted in 6% drop in diamond content (sample T9905). Although the reduction in diamond content was marginal, a more significant change was the 36% drop in growth rate of this sample as compared to the sample T991 (Fig. 4). It is to be expected that a reduction in hydrocarbon concentration in the gas phase will lead to a reduction in the film-growth rate since the gas phase CH4 is the primary source of carbon for film growth. Since there was no significant gain in diamond quality with lower CH4 content in the gas phase and because there was a substantial deterioration in growth rate under these conditions, no further experiments were performed using this gas phase composition.
Growth rate as a function of growth time for different diamond films. The lowest growth rate was for the T9905 (0.5% CH4). Legend key: T941 (95:4:1); T991 (90:9:1); T9905 (90:9.5:0.5); T941A (95:4:1, 2 h anneal at 850 °C); M1 (1 μm) (1-μm seeding layer, multilayer—60:39:1/95:4:1); M1 (25 nm) (25-nm seeding layer, multilayer—60:39:1/95:4:1); M2 (1 μm) (1-μm seeding layer, multilayer—95:4:1/60:39:1); M3 (25-nm seeding layer, multilayer—95:4:1/90:9:1/90:9.5:0.5); E941 (95:4:1; 12-h deposition); E991 (90:9:1; 12-h deposition); E631 (60:39:1; 15-h deposition). Table I provides complete information on growth conditions and thicknesses.

Calculated diamond percentage in each film (c.f. Table I)

Since sample T941 yielded a significant amount of nondiamond carbon, the next step was to evaluate the stability of this phase at elevated temperatures. This evaluation was performed by in situ annealing, for 2 h at 850 °C, of sample T941A, which was grown under the same conditions as sample T941. Table II indicates that there is no significant change in the film quality due to annealing at these temperatures. At this point in the experimental evaluation of the diamond thin films, it was found that both 95% and 90% Ar content in the gas phase resulted in diamond films with comparable material properties. Therefore, the next step was to evaluate the effect of prolonged growth on the quality of the diamond films for these two gas phase compositions.
B. Individual layers: Extended-duration deposition
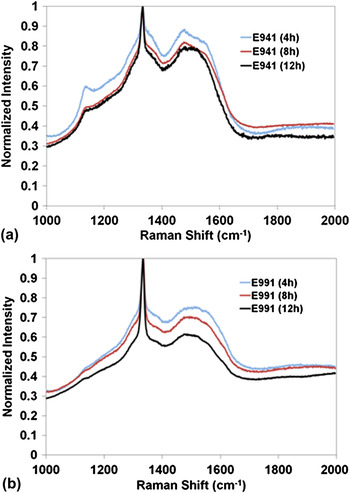
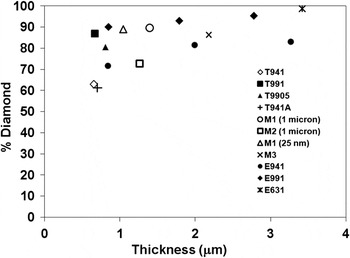
The effect of longer duration growth at gas ratios of 95:4:1 (sample E941) and 90:9:1 (sample E991) was evaluated by performing two separate extended deposition runs, at 4 h increments, for a total time of 12 h. One set of experiments replicated the growth conditions for sample T941 and the other for sample T991. At each 4-h interval, the sample thickness was evaluated and Raman spectra measurements were carried out. The results of these experiments are presented in Tables I and II and Figs. 4–6. For reference, Fig. 6 and Tables I and II include data for a sample grown for 15 h with gas ratios of 60:39:1. The data from the figures and tables indicate that with time the quality of both the diamond films improved. This improvement in quality was especially significant for the sample grown with 95% Ar (sample E941). In this case, the final diamond content in the film was 83% as compared to the 63% diamond in the film with just 3 h of deposition. In the case of the sample with 90% Ar (sample E991) in the gas phase, there was also an increase in diamond content in the film with longer growth times (95.3% after 12 h and 81% after 3 h of deposition). Further, it can be seen from Fig. 6 that for both these films, the increase in diamond content in the film appears to plateau with the thickness of the films. In particular, there is a marginal change in diamond content for these films above 2 μm. For the purposes of this article, we define this thickness to be the “constant diamond content thickness” (δd,const) for a particular gas composition.
Normalized Raman spectra for extended depositions at: (a) 95% Ar (sample E941) and (b) 90% Ar (sample E991). The improvement in film quality with time (and hence thickness) is clearly evident.

Plot of diamond content as a function of film thickness. Data indicate that the diamond content for samples E941 and E991 increases with thickness but reaches a plateau between 1 and 2 μm. These results have important implications for deciding the minimum layer thickness for multilayered diamond thin films. Legend key: T941 (95:4:1); T991 (90:9:1); T9905 (90:9.5:0.5); T941A (95:4:1, 2-h anneal at 850 °C); M1 (1 μm) (1-μm seeding layer, multilayer—60:39:1/95:4:1); M1 (25 nm) (25-nm seeding layer, multilayer—60:39:1/95:4:1); M2 (1 μm) (1-μm seeding layer, multilayer—95:4:1/60:39:1); M3 (25-nm seeding layer, multilayer—95:4:1/90:9:1/90:9.5:0.5); E941 (95:4:1; 12-h deposition); E991 (90:9:1; 12-h deposition); E631 (60:39:1; 15-h deposition). Table I provides complete information on growth conditions and thicknesses.

Since the diamond (and conversely the nondiamond carbon content) in the films will intimately influence the material properties, the above results imply that there is a narrow window (below δd,const) in the individual multilayer film thickness within which the material properties of the individual layer can be modified. Above δd,const, the material property of the single-layer film essentially remains “fixed” since the nondiamond and diamond contents remain more or less constant for a given gas composition.
These findings, therefore, open the door for two approaches to tailoring the material properties of multilayered diamond thin films. In the first approach, the thickness of the individual multilayer is kept at or above δd,const. In such a scenario, the properties of the multilayer diamond film will be a composite of the individual multilayers, with no significant change in material properties with layer thickness. In the second approach, the thickness of the multilayer will be kept below δd,const and the properties may be continuously varied as function of the layer thickness (and hence the diamond/nondiamond carbon content). The second approach can be a powerful tool for providing a wide range of continuously varying material properties.
Having investigated the growth and material properties of the individual layers, the next step involved preliminary experiments on synthesizing multilayered diamond films. To this end, the initial experiments focused on two-layer diamond deposition.
C. Multilayer diamond deposition
The multilayer deposition experiments involved diamond synthesis with gas ratios of 60:39:1 followed by a second deposition with the gas ratios set to 95:4:1 and vice versa. These two conditions were chosen since they represent the extremities of the deposition parameters explored so far. Further, the lower bound in deposition time, viz., 3 h, was chosen for these preliminary experiments. Also, to check for the effect of the nucleation layer on crystallite size, two seeding media were chosen—a 1-μm average size diamond nucleation layer and a 25-nm average size diamond nucleation layer.
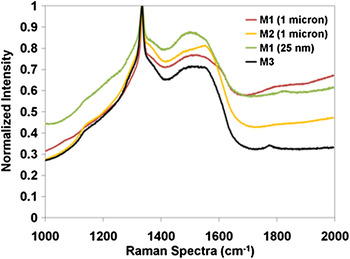
The sample designation M1 (1 μm) refers to a seeding layer of 1 μm with an initial diamond deposition carried out with gas phase ratios of 60:39:1 followed by a second deposition with a gas phase ratio of 95:4:1. M1 (25 nm) refers to a 25-nm seeding layer that was subject to the same deposition conditions as M1 (1 μm). In the case of sample M2 (1 μm), a 1-μm diamond seeding layer was subject to diamond deposition conditions with gas ratios of 95:4:1 followed by a second deposition at 60:39:1. It is to be noted here that the corresponding sample with 25-nm seeding layer was lost during processing. Figure 7 shows the normalized Raman spectra for these films. The spectra look similar, and it is difficult to gauge if there are any significant differences in diamond quality. However, quantitative analysis of the spectra (see Table II and Fig. 6) reveals some valuable insights. It can be seen from the data that for a two-layer film an initial deposition with the 60:39:1 gas phase composition resulted in better overall diamond quality as compared to the gas ratios of 95:4:1 [see M1 (1 μm) and M2 (1 μm)]. Also, for the same gas phase ratio, the 25-nm seeding layer resulted in a similar quality film as compared to the 1-μm layer. However, the 1-μm diamond nucleation layer exhibited poor adhesion as compared to the 25-nm diamond layer. These results are instructive in that they show that for a given nucleation layer, the growth sequence of 60:39:1 followed by 95:4:1 will result in better quality diamond films for two-layered diamond films.
Normalized Raman spectra plots for multilayered diamond samples. The plots for samples M1 and M2 are similar requiring quantitative analysis to glean information on diamond content. Also, the effect of multiple layer deposition on ameliorating the overall properties of the multilayered film is evident from sample M3 (see Tables I and II). Legend key: M1 (1 μm) (1-μm seeding layer, multilayer—60:39:1/95:4:1); M1 (25 nm) (25-nm seeding layer, multilayer—60:39:1/95:4:1); M2 (1 μm) (1-μm seeding layer, multilayer—95:4:1/60:39:1); M3 (25-nm seeding layer, multilayer—95:4:1/90:9:1/90:9.5:0.5).

The plots designated as sample “M3” in Figs. 4, 6, and 7 refer to a sample that was seeded with a 25-nm diamond layer and was subjected to the deposition conditions of samples T941, T991, and T9905 consecutively. In other words, this sample was placed alongside each of the above samples during their deposition runs, in effect leading to diamond depositions with gas ratios of 95:4:1, 90:9:1, and 90:9.5:0.5. This sample provides indications of some interesting research possibilities using multilayered NCD films. First, the diamond content in this film was calculated to be ∼86%, which lies at a value between that of sample T941 (95% Ar) and T991 (87% Ar) (see Table II and Fig. 6) thereby indicating that the diamond quality had improved with the growth of the multilayered film. Second, the growth rate for sample M3 was similar to that of sample M1 (25 nm) therefore substantiating the conclusion from the above discussion that the growth rate plateaus with time (and hence thickness). These results imply that it is possible to sustain a given growth rate and also improve the overall quality of the multilayered diamond film with time resulting in tailored thermal properties.
D. Morphological evaluation: SEM micrographs
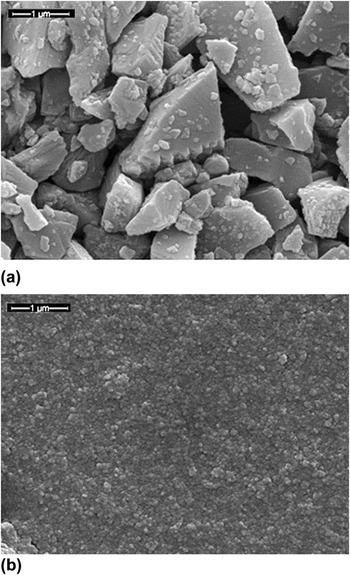
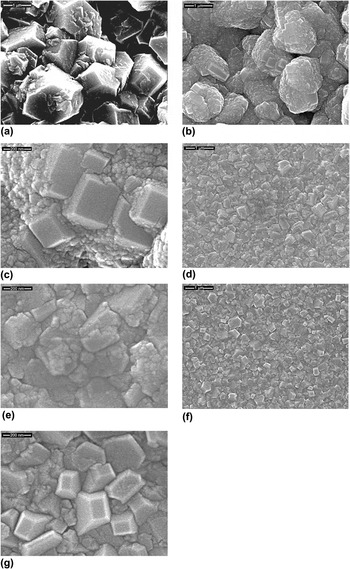
Figure 8 shows SEM micrographs (at the same magnification) for the two different nucleation layers used for the samples M1 and M2. It is clear from these micrographs that the 25-nm nucleation layer provides a smoother and denser medium for subsequent growth. Figure 9 shows SEM micrographs of samples (at 20 kX and 100 kX) after 3 h of growth with two different gas phase ratios—60:39:1 and 95:4:1. These micrographs were not obtained from samples M1 and M2 but from the characterization samples placed adjacent to them. Figures 9(a) and 9(b) show micrographs of diamond deposition on a 1-μm seeding layer with 60:39:1 and 95:4:1 gas ratios, respectively (at the same magnification). Figure 9(a) has lower brightness and contrast due to surface charging effects. Corresponding higher magnification images (at 100 kX) for Fig. 9(a) could not be recorded for the same reason. It can be clearly seen that there are significant differences in the morphology of the diamond between these two figures and also as compared to the seeding layer [Fig. 8(a)]. In the case of the gas ratio 60:39:1 [Fig. 9(a)], there is clear evidence of randomly oriented faceted diamond growth, while there is no such morphology evident in the as seeded layer. In the case of diamond growth under the 95:4:1 gas ratio, there is evidence of extensive renucleation [Figs. 9(b) and 9(c)]. More intriguingly, there is evidence of some oriented faceted growth in certain regions. Similarly, in the case of diamond deposition with gas ratios of 60:39:1 on 25-nm diamond nuclei, there is evidence of some randomly oriented faceted growth of diamond [Figs. 9(d) and 9(e)]. Once again, in the case of diamond growth on the 25-nm seeded layer with gas ratios of 95:4:1, there is evidence of oriented faceted growth [Figs. 9(f) and 9(g)]. Further, in this case, the fraction of oriented crystals is higher than that of 1-μm seeded layer [Figs. 9(b) and 9(c)] under the same growth conditions. We believe that the fraction of the oriented crystals present in a given film is a function of the nuclei size in the seeding layer. By carefully tailoring the nucleation layer diamond crystallite size, it may be possible to increase the fraction of oriented diamond crystals in a given growth layer. These results have important implications because they show that it is possible to tailor the fraction of oriented crystallites.
SEM micrographs of the diamond seeding layers used for multilayer diamond synthesis (20 kX; scale bar: 1μm): (a) 1-μm average particle size and (b) 25-nm average particle size. It is clear from the micrographs that 25-nm seeding layer provides a smoother and denser medium for subsequent growth.

SEM micrographs of samples after 3 h of diamond deposition with the following gas ratios: (a) 60:39:1 (1-μm seeding; 20 kX; 1 μm scale bar; appears dark due to surface charging effects; 100 kX not available for same reasons); (b) 95:4:1 (1-μm seeding; 20 kX; 1 μm scale bar); (c) 95:4:1 (1-μm seeding; 100 kX; 200 nm scale bar); (d) 60:39:1 (25-nm seeding; 20 kX; 1 μm scale bar); (e) 60:39:1 (25-nm seeding; 100 kX; 200 nm scale bar); (f) 95:4:1 (25-nm seeding; 20 kX; 1 μm scale bar); and (g) 95:4:1 (25-nm seeding; 100 kX; 200 nm scale bar).

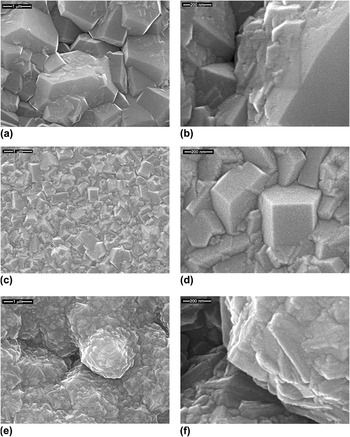
Figure 10 shows SEM micrographs (20 kX and 100 kX) for samples M1 and M2 after the bilayer diamond deposition. In the case of the sample M1 (1 μm) wherein the gas phase ratios for the two layers were 60:39:1 followed by 95:4:1, it can be clearly seen that the diamond film had coalesced even when the total thickness of the film was just over 1 μm [Figs. 10(a) and 10(b); see Table I; see Fig. 8(a) for the seeding layer]. Further, there is clear evidence of diamond renucleation due to the second, higher Ar content, deposition conditions, with an interesting variation. It appears that the initial growth with the 60:39:1 gas ratio, which promoted randomly oriented faceted diamond growth, resulted in the reduction of the number of renucleation sites leading to a more faceted overall morphology as compared to diamond deposition at higher Ar content directly on the 1-μm seeding layer [see Figs. 9(b) and 9(c)]. This is in stark contrast to sample M2 (1 μm) wherein the above deposition sequence was reversed [Figs. 10(e) and 10(f)]. In this case, it is clearly evident that the initial deposition with 95:4:1 gas phase ratios resulted in a high density of diamond renucleation. In the subsequent growth step with the 60:39:1 gas ratio, these nucleation sites are beginning to grow resulting in faceted nanoscale diamond crystallites.
SEM micrographs for samples M1 (60:39:1/95:4:1) and M2. (95:4:1/60:39:1): (a) M1 (1 μm) (20 kX; 1 μm scale bar); (b) M1 (1 μm) (100 kX; 200 nm scale bar); (c) M1 (25 nm) (20 kX; 1 μm scale bar); (d) M1 (25 nm) (100 kX; 200 nm scale bar); (e) M2 (1 μm) (20 kX; 1 μm scale bar); and (f) M2 (1 μm) (100 kX; 200 nm scale bar).

In the case of the sample M1 (25 nm) [same deposition conditions as M1 (1 μm)], the final morphology consisted of randomly oriented faceted diamond [Fig. 10(c) and 10(d)]. It was found that the number of oriented crystals was apparently reduced when the initial deposition used the gas ratio of 60:39:1. The above results have exciting implications in that they indicate that it is indeed possible to fine-tune the morphological evolution of multilayered diamond films by varying the gas composition and the nuclei size of diamond seeding layer. Such morphologically tailored diamond films can have applications in the development of thin films with tailored thermal properties that will have useful applications in thermal management technology. In this context, we would like to draw attention to the fact that previously reported measurements of thermal conductivity of MCD films deposited using 60:39:1 gas ratios resulted in values in the range of 12–17 W/cm KReference Das, Singh, Chattopadhyay and Chen23 for thick films (>20 μm).
IV. CONCLUSIONS
Experimental studies were carried out to (a) establish the feasibility of, and to develop process conditions that lead to, multilayer diamond deposition using Ar-rich MPCVD gas chemistries, and (b) study the correlation of diamond film quality with the process conditions. The following gas ratios (Ar:CH4:H2) were chosen for this study—95:4:1, 90:9:1, 90:9.5:0.5, and 60:39:1. Raman spectra and SEM were used to evaluate the diamond quality and microstructure. The following conclusions are drawn from these experiments.
(1) Short-term deposition (3 h) results indicated that decreasing Ar content in the gas phase resulted in improved diamond quality. Also, changes in methane content below 1% had a minimal effect on the film quality. Further, high-temperature (850 °C) annealing did not affect the nondiamond carbon content in the films.
(2) Extended depositions (12 h) using 95:4:1 and 90:9:1 gas ratios indicated that the diamond quality improved significantly up to a thickness of 2 μm beyond which there was no significant change.
(3) Multilayer diamond experiments were performed with the gas ratios of 60:39:1 and 95:4:1, using two different diamond seed sizes—1 and 25 nm. Results from these experiments showed that: (i) the size of the diamond seed did not affect the quality of the films, (ii) the growth rates stabilized and the film quality improved upon deposition of multiple layers, (iii) using the 60:39:1 gas phase composition for depositing the first layer resulted in better quality films and promoted the evolution of randomly oriented diamond crystallites, and (iv) the 95:4:1 gas composition resulted in high density of renucleation along with the growth of certain number of oriented crystallites. The fraction of oriented crystallites depended on the size of the diamond seeding layer and the conditions of deposition for the initial layer.
The above results are exciting in the sense that they open the door for fine tuning the morphology and diamond quality of individual diamond layers in multilayered diamond films resulting in tailored material properties. Further experiments are being carried out to evaluate the thermal properties of both single and multilayer films with lower thickness values as a function of gas composition and morphology. It is envisaged that the development of multilayered diamond thin films with tailored thermal properties can have a significant impact on thermal management technology development.
ACKNOWLEDGMENTS
The authors are grateful for the support of the National Science Foundation (NSF; Grant Nos. ECCS-0853789 and CBET-1133516) for the present work. The authors acknowledge the help of Mr. Ratandeep Kukreja for the SEM characterization.