


1. Introduction
Impact phenomena are ubiquitous in both nature and industry, and their scale ranges from the small dimensions of inkjet printing and raindrop dynamics to that of the impact of a large asteroid on a planet. Droplet impact on solid surfaces has been studied extensively ever since the pioneering work of Worthington (Reference Worthington1908). During impact, droplets spread over a solid surface, recede, splash or rebound, depending on the properties of the impactors, substrate and initial conditions, such as the impact velocity and impact angle (Clanet et al. Reference Clanet, Béguin, Richard and Quéré2004; Yarin Reference Yarin2006; Josserand & Thoroddsen Reference Josserand and Thoroddsen2016).
The observed phenomena become very different when the roles of substrate and impactor are reversed, i.e. when the substrate is deformable and the impactor is a solid object, such as during the impact of a sphere onto a granular bed (Ruiz-Suárez Reference Ruiz-Suárez2013; Katsuragi Reference Katsuragi2016; van der Meer Reference van der Meer2017). This process leads to the formation of an impact crater, and, as early as 1993, Holsapple (Reference Holsapple1993) pointed out the analogy between the morphology and dynamic processes of high-energy impacts of asteroids and other solar system bodies onto planets and laboratory-scale, low-energy impacts on granular materials. With the development of high-speed cameras, research on these low-energy impacts has thrived. Consequently, the literature on impact cratering in sand and its subsequent dynamics is quite extensive, ranging from the formation of the crater (Uehara et al. Reference Uehara, Ambroso, Ojha and Durian2003) and the study of its characteristics (Walsh et al. Reference Walsh, Holloway, Habdas and de Bruyn2003; Zheng, Wang & Qiu Reference Zheng, Wang and Qiu2004; Pacheco-Vázquez Reference Pacheco-Vázquez2019) to the force exerted on the impactor (Lohse et al. Reference Lohse, Rauhe, Bergmann and van der Meer2003; Katsuragi & Durian Reference Katsuragi and Durian2007; Goldman & Umbanhowar Reference Goldman and Umbanhowar2008) and the study of the splash that is created upon impact, also known as the ejecta (Marston et al. Reference Marston, Thoroddsen, Ng and Tan2010; Pacheco-Vázquez Reference Pacheco-Vázquez2019).
Arguably as relevant as the above impact examples is the interaction of a liquid droplet with a granular medium, such as the impact of a raindrop onto soil. Here, both impactor and substrate are deformable, and may even mix during the impact process. In the literature, the details of crater formation (Zhang et al. Reference Zhang, Gao, Zhao and Cheng2015; de Jong, Zhao & van der Meer Reference de Jong, Zhao and van der Meer2017; Liu, Tan & Tran Reference Liu, Tan and Tran2018), liquid penetration and residue morphology (Delon et al. Reference Delon, Terwagne, Dorbolo, Vandewalle and Caps2011; Katsuragi Reference Katsuragi2011; Zhao, de Jong & van der Meer Reference Zhao, de Jong and van der Meer2015b) and maximum spreading diameter (Zhao et al. Reference Zhao, Zhang, Tjugito and Cheng2015a; Zhao, de Jong & van der Meer Reference Zhao, de Jong and van der Meer2017) of the droplets have been investigated.
It has become clear that craters formed by the impact of liquid and solid objects are different. First of all, in a direct comparison between similar-sized droplets and solid spheres at similar impact energies, it was found that impact craters from liquid impactors are systematically wider and shallower than those created by the impact of a solid sphere (de Jong et al. Reference de Jong, Zhao, Garcia-Gonzalez, Verduijn and van der Meer2021). In this context, also the results of Pacheco-Vázquez & Ruiz-Suárez (Reference Pacheco-Vázquez and Ruiz-Suárez2011) should be mentioned, who observed a similar behaviour for disintegrating granular impactors. Moreover, the diameters of craters formed by various types of impactors were found to obey different scaling when fitted to a power law in the impact kinetic energy: for solid impactors the exponent is observed to be between  $0.2$ (de Jong et al. Reference de Jong, Zhao, Garcia-Gonzalez, Verduijn and van der Meer2021) and
 $0.24$ (Uehara et al. Reference Uehara, Ambroso, Ojha and Durian2003), whereas the exponent is significantly lower for droplets, namely
 $\sim 0.17\text {--}0.18$ (Zhao et al. Reference Zhao, Zhang, Tjugito and Cheng2015a; Nefzaoui & Skurtys Reference Nefzaoui and Skurtys2012).
This raises the question as to what would happen for an impactor with properties located between those of a solid and a liquid, e.g. a highly deformable, elastic sphere. Matsuda et al. (Reference Matsuda, Fukui, Kamiya, Yamaguchi and Niimi2019) performed impact experiments onto granular media with packing fraction of  $0.618$ using elastic hydrogel spheres with a Young's modulus of several kilopascals, the results of which indicate that the crater diameter obeys a power law in the impact kinetic energy with exponent
 $0.223$ when the maximum deformation is smaller than 30 % of the sphere's diameter, and
 $0.205$ for larger maximum deformations, thus indicating a value that, while it is still consistent with solid-sphere impact, lies between those for solid and liquid impactors mentioned above.
In the present study, we aim to extend these measurements to elastic hydrogel spheres with a broader range covering almost three orders of magnitude of Young's moduli, and directly compare our findings with those of liquid-droplet and solid-sphere impacts from earlier work (de Jong et al. Reference de Jong, Zhao, Garcia-Gonzalez, Verduijn and van der Meer2021). We use granular substrates with two different size distributions and varying packing fractions for which we report both diameter and depth of the craters. Next, we measure the deformation behaviour of the hydrogel spheres and introduce an energy decomposition similar to that used in (Zhao et al. Reference Zhao, de Jong and van der Meer2015b) to estimate the portions of the impact kinetic energy invested in each of sphere deformation and crater formation. Moreover, using this energy decomposition we show that the maximum deformation data can be collapsed by means of the introduction of an (elastocapillary) Mach number, in a manner similar to that done for hydrogel spheres impacting on a solid substrate (Tanaka, Yamazaki & Okumura Reference Tanaka, Yamazaki and Okumura2003; Tanaka Reference Tanaka2005; Arora et al. Reference Arora, Fromental, Mora, Phou, Ramos and Ligoure2018). Finally, we investigate the conditions under which the spheres rebound, and analyse them in terms of the spreading and impact time scales.
The paper is structured as follows. In § 2 we discuss the experimental set-up, the production of the hydrogel spheres and the measurement of the Young's modulus. In § 3 we subsequently turn to the measurement of the crater characteristics and the comparison with liquid-droplet and solid-sphere impact. Here we also discuss the decomposition of the impact kinetic energy  $E_k$ into portions that are used for the deformation of the sphere (
 $E_d$) and the formation of the crater (
 $E_s$). We continue with a discussion of the maximum spreading diameter and spreading time of the sphere in § 4, after which we turn to the bouncing phenomenon in § 5. The paper is concluded in § 6.
2. Experimental methods
In the experiments we investigate the impact of deformable hydrogel spheres onto granular materials by varying the impact velocity  $U_{0}$ and the stiffness of the spheres, as described by their Young's modulus
 $Y$. We use a series of acrylamide gels that are prepared by the copolymerization of acrylamide (40 % stock solution) as the monomer and methylenebisacrylamide (2 % stock solution) as the comonomer. The amount of each reagent used for preparing the acrylamide gels is shown in table 1. Sodium persulfate (
 $0.93$
 $\textrm {g}\,\textrm {l}^{-1}$) and tetramethylenediamine (
 $0.6$
 $\textrm {g}\,\textrm {l}^{-1}$) were added to initiate and accelerate the radical polymerization, where the monomer and comonomer solutions were mixed before adding the initiators. Subsequently, several droplets with a volume of
 $33.6$
 $\mathrm {\mu }$l of this solution (corresponding to a hydrogel sphere with a diameter
 $D_0$ of approximately
 $4.0$ mm) were transferred into an Eppendorf tube that was filled with polyoil of density
 $1.006$
 $\textrm {g}\,\textrm {ml}^{-1}$ at
 $25\,^\circ \textrm {C}$ to match that of the solution and allowed to polymerize. The interfacial tension immediately renders the droplets spherical and the density matching ensures that the droplets float during polymerization.
Young's modulus  $Y$ of hydrogel spheres obtained after polymerization of different acrylamide and bisacrylamide concentrations. Here,
 $\Delta Y$ represents the standard deviation in the target modulus
 $Y$, obtained from different batches of hydrogel spheres using the same solutions and preparation method. Note that the variation of the modulus within a batch of particles is significantly smaller than
 $\Delta Y$ and therefore more precise values may be found within this study. In general, the value of
 $Y$ can be obtained with an error
 $< 1\,\%$, except for
 $Y \approx 100$ Pa, where the measurement is difficult due to the large gravitational deformation of the sphere. Also note that not all batches listed in this table have been used for experiments reported in this study.

The Young's modulus  $Y$ of the hydrogel sphere was tuned by varying the concentrations of the monomer and comonomer and measured using an in-house-constructed device composed of a scale and a micrometer, as sketched in figure 1(a). The hydrogel sphere is placed between the scale and a rigid plate connected to a micrometer that was mounted on a stand. By adjusting the micrometer and neglecting the very small displacement of the scale, we obtain the vertical deformation
 $\delta$ of the sphere together with the corresponding force
 $F$, as shown in figure 1(b). Now, the Young's modulus
 $Y$ of the sphere may be determined using the Hertz theory for the deformation of an elastic sphere (Matsuda et al. Reference Matsuda, Fukui, Kamiya, Yamaguchi and Niimi2019):
 \begin{equation} F(\delta)=\frac{4Y}{3\sqrt{2}(1-\nu^2)}D_{0}^{1/2}\delta^{3/2}, \end{equation}
where Poisson's ratio  $\nu =0.5$ was obtained invoking the incompressibility condition. We observe that the measurement data are well fitted by the expected power law, with the exception of the data for the smallest values of
 $Y$, which may be traced back to the fact that they suffer from very large deformation already at moderate forces. The measured Young's moduli
 $Y$ vary from approximately
 $100$ to
 $50\,000$ Pa, as reported in table 1.
(a) Sketch of the homemade Young's modulus test set-up which is composed of a scale and a plate attached to a micrometer. The hydrogel spheres are placed between the scale and the plate. The vertical deformation  $\delta$ and the corresponding force
 $F$ are measured while adjusting the micrometer. Springs connect the plate that moves downward due to the action of the micrometer to the plate above and put tension on the lower plate such that it stays horizontal while moving up and down. (b) Force
 $F$ and vertical deformation
 $\delta$ are plotted in a double-logarithmic plot. The dashed line represents the power-law scaling with exponent
 $3/2$ expected based on the Hertz theory.

For the impact experiments, the hydrogel spheres are suspended from a small nozzle which is connected to a pump that creates a suction pressure. By releasing the pressure, the spheres fall under the influence of gravity and impact a granular bed with a vertical speed  $U_0$ varying from
 $0.5$ to
 $4.5$
 $\textrm {m}\,\textrm {s}^{-1}$, which is computed from the images obtained with a high-speed camera at a frame rate of 10 000 frames per second. White hydrophobic silane-coated soda lime glass beads are used as granular target, of which the material density is
 $\rho _g = 2.5\times 10^{3}\,\textrm {kg}\,\textrm {m}^{-3}$. The beads are silane-coated to obtain a granular substrate similar to that used in de Jong et al. (Reference de Jong, Zhao, Garcia-Gonzalez, Verduijn and van der Meer2021). We use two different polydisperse batches of grains, with a mean size of
 $200$ and
 $114$
 $\mathrm {\mu }$m, respectively. In this work, we mainly focus on results obtained with the
 $200$
 $\mathrm {\mu }$m grains. The beads are dried in an oven at around
 $105$
 $^\circ$C for at least half an hour and subsequently cooled down before the experiment, for which a fixed mass of
 $42$ g of beads is poured into a container with a diameter of
 $40$ mm. The packing fraction
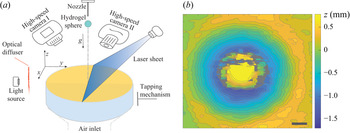
 $\phi$ of the target is tuned in the range 0.55–0.62 by air fluidization and subsequent tapping, as shown in figure 2. The packing fraction is determined by measuring the surface profile with a laser profilometer just before each impact experiment, which results in a slightly varying bed height of approximately 25 mm. It was checked that the boundaries of the container have negligible effect on the impact results.
(a) Sketch of the experimental set-up. Before impact, a granular target is prepared in a given packing fraction by fluidization with dry air and subsequent tapping. The impact of the hydrogel sphere and its deformation are subsequently imaged with one high-speed camera, while simultaneously, the deformation  $z(x,y,t)$ of the granular bed is measured using two laser sheets imaged by a second high-speed camera. A two-dimensional scan of the surface is made before and after the experiment using the same laser sheets and a translation stage (not depicted) providing the three-dimensional crater profile. (b) An example of the three-dimensional crater profile resulting from the impact of a
 $Y = 100$ Pa hydrogel sphere at an impact speed
 $V = 2.88$
 $\textrm {m}\,\textrm {s}^{-1}$ on a granular bed consisting of
 $200\,\mathrm {\mu }$m beads at a packing fraction
 $\phi = 0.592$. Note that for these impact parameters the hydrogel sphere remains visible in the centre of the crater profile. The grey colour indicates regions where height measurement data were not acquired due to partial obstruction of the laser sheet or poor reflectivity of the hydrogel sphere. The scale bar in the image has a length of
 $2.00$ mm.

Two high-speed cameras are employed to simultaneously record the deformation of the hydrogel spheres and the crater profile, determined with an in-house-developed high-speed laser profilometry set-up discussed extensively in Zhao et al. (Reference Zhao, de Jong and van der Meer2015b), from which the deformation of the granular bed can be deduced. The dynamic crater profile  $z(r,t)$ is captured using this high-speed laser profilometer under the assumption of axisymmetry, and the spreading diameter of a hydrogel sphere is determined simultaneously by monitoring the time evolution of the contour of the sphere in the images acquired by the other camera.
Before and after the impact, the surface of the granular bed is scanned using the same laser sheets and a translation stage, from which we can deduce the three-dimensional final crater profile. From this final crater profile we determine the crater diameter  $D_{c}^\infty$ as the average diameter of the protruding rim and the crater depth
 $Z_{c}^\ast$ by subtracting the hydrogel sphere diameter from the central height measurement in the case where the hydrogel sphere remains in the centre of the crater, and just the measured central depth if it does not (in the case of a rebound).
3. Target deformation: crater characteristics
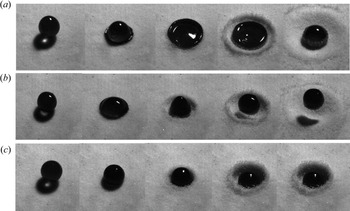
Three typical examples of the impact of hydrogel spheres of varying softness onto the granular target are shown in figure 3, where the Young's modulus  $Y$ increases from top to bottom. In all three cases, the sphere is observed to expand radially to its maximum diameter
 $d_{max}$ and then to recede, during which phase the dynamics becomes slightly more complex. Figure 3(a) illustrates how the impact process of a very soft sphere (
 $Y=100$ Pa and
 $U_{0}=1.5$
 $\textrm {m}\,\textrm {s}^{-1}$) is similar to that of droplets (Zhao et al. Reference Zhao, de Jong and van der Meer2017), except for the fact that the hydrogel sphere is of course not able to penetrate into the sand bed and becomes covered with sand particles that stick to its surface, similar to what happens during water-droplet impact on hydrophobic sand. A pronounced lamella develops and spreads outward while the bulk of the sphere continues to move downward as a truncated sphere. Meanwhile, the lamella continues to expand, developing a thicker rim at the edge until it reaches its maximal radius. A retraction phase follows where the hydrogel recovers its shape moving up in the vertical direction and eventually comes to rest under the influence of gravity. Note that the formation of a rim indicates that interfacial tension may be important for the dynamics of the sphere at this very small value of the Young's modulus, a fact that we address in greater detail when discussing the deformation of the spheres in § 4.
Snapshots from the impact of hydrogel spheres onto a sand bed with an average grain diameter of  $114$
 $\mathrm {\mu }$m, for three different values of the Young's modulus of the sphere, namely (a)
 $100$ Pa, (b)
 $5000$ Pa and (c)
 $30\,000$ Pa, each for the same impact velocity
 $U_0 = 1.5$
 $\textrm {m}\,\textrm {s}^{-1}$. Each row represents five consecutive snapshots of an impact, where the leftmost column illustrates the moment of initial contact between the hydrogel sphere and the granular target,
 $t=t^*$. The subsequent snapshots correspond to
 $t=t^*+10$ ms,
 $t=t^*+30$ ms,
 $t=t^*+70$ ms and
 $t=t^*+270$ ms.

Snapshots of the motion of a hydrogel sphere of moderate stiffness ( $Y=5000$ Pa and
 $U_{0}=1.5\,\textrm {m}\,\textrm {s}^{-1}$) are presented in figure 3(b). Shortly after impact, the shape of the visible upper part of the soft sphere is similar to that of a half-ellipsoid. Even when the spreading radius reaches its maximum value, the central thickness of the sphere is still significantly larger than its rim. Note that this behaviour is qualitatively different from that observed in figure 3(a) where the sphere spreads in its entirety before retracting. A retraction phase follows where the hydrogel elongates in the vertical direction and eventually rebounds and completely loses contact with the granular bed, as can be appreciated from the shadow cast by the sphere onto the granular bed in the last two snapshots. The bouncing phenomenon is discussed in greater detail in § 5.
Finally, for one of the stiffest spheres that we investigated in this study ( $Y=30\,000$ Pa and
 $U_{0}=1.5$
 $\textrm {m}\,\textrm {s}^{-1}$), the snapshots of the impact process are shown in figure 3(c). Upon contact, the hydrogel sphere exhibits no significant spreading phase at this impact speed and the impact resembles that of a solid sphere. At much smaller impact speeds, where the impact region becomes visible, it appears that the sphere deforms at most locally or even shows no obvious deformation. Note that for these stiffest spheres no bouncing is observed after the impact.
Craters are formed on the surface of the granular bed after impact of the hydrogel spheres, the diameter and depth of which are influenced by the spheres' Young's moduli. The crater morphology is deep and narrow for stiffer impactors, while it is shallow and wide for softer spheres. In the next subsections, we address the question as to how the stiffness of the sphere and (to a lesser extent) how the packing fraction of the granular bed affect the crater morphology. More specifically, we investigate whether the dynamics of solid and liquid impactors can be considered as the limiting cases of that of very stiff hydrogel spheres ( $Y\rightarrow \infty$) and of very soft ones (
 $Y\rightarrow 0$), respectively.
3.1. Crater diameter  $D_{c}^\infty$

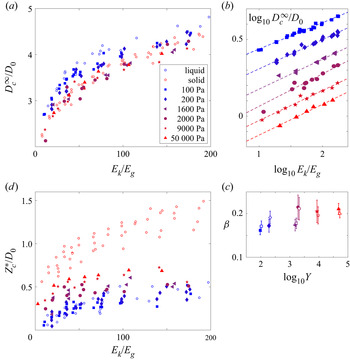
The crater diameter  $D_{c}^\infty$ is defined as the radial diameter of the top rim of the crater, taken at a moment in time after all of the dynamics associated with the hydrogel sphere impact has ceased. Figure 4(a) shows the dimensionless final crater diameter
 $D_{c}^\infty /D_{0}$, i.e. rescaled with the sphere diameter
 $D_0$, versus the dimensionless impact kinetic energy
 $E_{k}/E_{g}$ for hydrogel spheres and compared with data obtained for solid spheres and droplets under similar conditions in de Jong et al. (Reference de Jong, Zhao, Garcia-Gonzalez, Verduijn and van der Meer2021). Here,
 $E_{k}=({\rm \pi} /12)\rho _{i}D_{0}^3U_{0}^2$ is the kinetic energy just before the sphere (of density
 $\rho _i$) comes in contact with the granular bed, and
 $E_{g}=({\rm \pi} /6)\rho _{g}\phi gD_{0}^4$ is the gravitational potential energy associated with the motion of bed particles with a volume equivalent to that of the sphere is moved over a distance corresponding to the sphere diameter
 $D_{0}$ vertically. Clearly,
 $D_{c}^\infty /D_{0}$ increases with
 $E_{k}/E_{g}$ for all Young's moduli investigated. Moreover, for fixed
 $E_{k}/E_{g}$, the crater diameter tends to increase with decreasing
 $Y$. The hydrogel sphere data for
 $D_{c}^\infty /D_{0}$ are bounded on the upper side by the data for the droplet and on the lower side (although somewhat less convincingly) by the solid impactor data. For the hydrogel sphere with the lowest Young's modulus (
 $Y = 100$ Pa), the diameter of the resulting crater is consistent with that of an impacting droplet when
 $E_{k}/E_{g}<100$. When
 $E_{k}/E_{g}>100$, the crater diameter for soft hydrogel spheres is smaller than that for droplets, possibly due to the sphere not spreading as strongly as the droplet, and certainly not splashing. With an increase of
 $Y$, the data shift towards and even significantly below that obtained for a rigid sphere. This observation appears surprising at first sight, but will be revisited after introducing the reduced impact energy
 $E_s$ in § 3.4.
(a) The dimensionless maximum crater diameter  $D_{c}^\infty /D_0$ versus the non-dimensionalized kinetic energy
 $E_{k}/E_{g}$ of the impact of hydrogel spheres with different Young's moduli
 $Y$ onto a granular bed with average grain diameter of 200
 $\mathrm {\mu }$m and a packing fraction in the range 0.585–0.62. The data are compared with those obtained in de Jong et al. (Reference de Jong, Zhao, Garcia-Gonzalez, Verduijn and van der Meer2021) for the impact of solid spheres (red open circles) and water droplets (blue open circles) of similar size on a granular bed of similar grain size and packing fraction (see legend). (b) The same data as in (a), but now plotted doubly logarithmically to verify behaviour that is consistent with a power law. Note that the data have been shifted in the vertical direction to avoid overlapping of the data for different values of
 $Y$. (c) Power-law exponents
 $\beta$ (filled symbols) obtained for the data presented in (b), as a function of the Young's modulus
 $Y$ of the hydrogel spheres. The open symbols are power-law-exponent data obtained from plotting
 $D_{c}^\infty /D_0$ against the corrected kinetic energy
 $E_s/E_g$, where Young's moduli have been slightly shifted for visualization purposes. (d) The dimensionless crater depth
 $Z_{c}^\ast /D_0$ versus the non-dimensionalized kinetic energy
 $E_{k}/E_{g}$ for the same data as presented in (a), under the same conditions and again compared with the solid sphere (red dots) and droplet (blue dots) data. Note that the legend of (a) is shared by the other panels.

When we plot the same data on a double-logarithmic scale (figure 4b), where data are shifted in the vertical direction for each value of  $Y$ for clarity, we observe that the data are consistent with a power law of the form
 $D_{c}^\infty /D_0 \sim (E_{k}/E_{g})^{\beta }$. In figure 4(c) the corresponding power-law exponents
 $\beta$, obtained from a linear best fit to the data in figure 4(b), are plotted versus the logarithm of the Young's modulus
 $Y$. Clearly,
 $\beta$ increases with increasing
 $Y$ from a value close to
 $\beta =0.17$ for low Young's moduli, which is consistent with that observed for droplet impacts, to values just above
 $\beta =0.21$, which corresponds to power-law exponents for solid-sphere impact on sand reported in the literature. Finally, it is good to note that the exponent obtained for
 $Y = 2000$ Pa appears to be an outlier, when compared with the data obtained for the other Young's moduli, which is consistent with the large error margin of the best fit.
3.2. Crater depth $Z_{c}^\ast$

The maximum crater depth  $Z_{c}^\ast$ is obtained from the final crater profile by subtracting the height of the hydrogel sphere
 $h$ from the centre of the crater profile
 $Z(0,t^\infty )$ (in the case that the hydrogel sphere had not bounced out of the crater). This is consistent with the method with which the crater depth was determined in de Jong et al. (Reference de Jong, Zhao, Garcia-Gonzalez, Verduijn and van der Meer2021) and in numerous earlier papers determining the crater depth for solid-sphere impact. Note that the height
 $h$ is not exactly equal to the sphere diameter
 $D_0$, but obtained by subtracting the vertical deformation
 $\delta _0$ induced by gravity from
 $D_{0}$. The dimensionless crater depth
 $Z_{c}^\ast /D_0$ is plotted against
 $E_{k}/E_{g}$ in figure 4(d). Obviously, the crater is deeper for stiffer beads, indicating that
 $Z_{c}^\ast$ increases with
 $Y$, and its range varies between the impact depth of solid sphere and droplet, as one would expect, with the data for small
 $Y$ close to those for the droplet and increasing towards those of the solid-sphere impact for larger
 $Y$. However, it should not remain unmentioned that, whereas the impact depth for the softest spheres (
 $Y = 100$ Pa) is basically coincident with that of the droplet, the data for the largest Young's modulus,
 $Y = 50\,000$ Pa, do not come close to those of the solid-sphere impact. It could well be that the adherent character of the hydrogel spheres which makes sand grains stick to their surface during impact and even the slight deformation that the stiffest hydrogel sphere experiences both add to the friction that the sphere experiences inside the sand, thereby significantly decreasing its maximum penetration depth.
3.3. On scaling exponents and friction
We add a few words on how the different power-law exponents may be motivated from scaling arguments, and how these are related to friction. In the context of planetary impacts it was shown on dimensional grounds that, if a crater can be considered as the result of the impact of a much smaller object and if gravity is the dominant force against which the crater is excavated, the typical length scale of the crater scales as  $E_k^{1/4}$ (Holsapple & Schmidt Reference Holsapple and Schmidt1987; Holsapple Reference Holsapple1993; Katsuragi Reference Katsuragi2016). This exponent of
 $1/4$ is often rationalized by equating the impact energy
 $E_k = (\rho _i D_0^3\,V^2)/6$ with the potential energy
 $E_p \sim \rho _g \phi g (D_{c}^\infty )^2(Z_{c}^\ast )^2$ that is stored during the excavation of the crater, where
 $Z_{c}^\ast$ is the depth of the crater. Assuming that the crater shape is scale-invariant such that the ratio of the diameter and the depth is constant, or
 $D_{c}^\infty \sim Z_{c}^\ast$, immediately leads to
 $D_{c}^\infty /D_0 \sim (E_k/E_g)^{1/4}$.
The problem with this interpretation is, however, that for the small-scale experiments discussed here one can show that at most  $5\,\%$ of the impact energy is stored in potential energy of the crater and that the largest part of the impact energy is in fact dissipated by frictional processes inside the granular bed (de Jong et al. Reference de Jong, Zhao, Garcia-Gonzalez, Verduijn and van der Meer2021): as the crater is excavated in the granular bed, the impactor needs to do work against the normal and frictional forces at the contacts between the grains in the granular bed. If one now assumes that these forces are dominated by the hydrostatic (or lithostatic) pressure inside the granular bed, one may equate the impact energy and the energy that is dissipated in creating the crater, which will thus depend similarly on parameters such as
 $E_p$, i.e.
 $E_{diss} \sim \mu \rho _g \phi g (D_{c}^\infty )^2(Z_{c}^\ast )^2$, where
 $\mu$ is a macroscopic friction coefficient of order unity. This clearly leads to the same scaling exponent of
 $1/4$.
From the above discussion it becomes clear that friction plays a crucial role in determining the shape and size of the impact crater. Clearly, when the object is deforming as it impacts onto the sand bed, grains will not only be pushed downwards but also in lateral directions, which will lead to an enhanced friction in the bed and consequently to a larger drag force on the object. Moreover, if the deformation is substantial, as in the case of the impact of a droplet or a very soft hydrogel sphere, one may argue that the forcing of the granular bed due to the impact is now not concentrated in the centre of impact but spread out over a larger area, corresponding to the larger deformation of the impactor.
An exponent of  $1/6$ has been observed in experiments ranging from small-scale droplet impacts to highly energetic impacts on an astronomic scale, and it is one of the great contributions of the Minnesota group (Zhao et al. Reference Zhao, Zhang, Tjugito and Cheng2015a) to evidence this so-called Schmidt–Holsapple scaling for droplet impact and to provide an argument for the scaling. Translated to the current situation, it relies on spreading out the forcing of the impactor over an area determined by a length scale that is proportional to the diameter of the crater. As a result, the dissipated energy is multiplied by a factor
 $f^{-1} = (D_{c}^\infty )^2/D_0^2$, with which the balance of kinetic and dissipated energy reads
 $\rho _i D_0^3 V^2 \sim ((D_{c}^\infty )^2/D_0^2)\mu \rho _g \phi _0 g (D_{c}^\infty )^2(Z_{c}^\ast )^2$. With
 $D_{c}^\infty \sim Z_{c}^\ast$, this leads to
 $D_{c}^\infty /D_0 \sim (E_k/E_g)^{1/6}$.
It needs to be stressed that many of the above arguments are simplified and approximate, such as that it has been observed that the maximum spreading diameter of the droplet only approximately scales with the crater diameter (de Jong et al. Reference de Jong, Zhao, Garcia-Gonzalez, Verduijn and van der Meer2021). Also, it appears that the scaling arguments for the low-energy impacts on sand that are studied here are different from those for high-energy impacts. For example, a scaling exponent close to  $1/6$ is also observed for higher-energy impacts of solid objects on sand, which in that case is attributed to a high Mach number (Miranda & Dowling Reference Miranda and Dowling2019).
3.4. Correcting the impact kinetic energy for sphere deformation
As argued in our previous work, during impact of a droplet part of the impact energy is used for the deformation of the droplet such that only the remaining part may be used for the formation of the crater. The same argument holds for the impact of a hydrogel sphere, where part of the impact energy is used for the elastic deformation of the sphere. Following the reasoning of Clanet et al. (Reference Clanet, Béguin, Richard and Quéré2004), what happens when a droplet impacts onto a solid substrate is that it deforms as a result of a deceleration force that it experiences during impact. This force performs an amount of work on the droplet along the displacement of the centre of mass, which in this case is approximately equal to the droplet radius  $R_{0} = D_0/2$, as depicted in figure 5(a), assuming that the droplet spreads until it has a negligible thickness in its centre. Since at maximum spreading of the droplet no vertical momentum is left in the droplet, this amount of work must have transformed the impact kinetic energy
 $E_{k}$ into other forms of energy, in this case the surface energy of the droplet. In this way, the average force exerted by the solid substrate onto the droplet is equal to the impact kinetic energy divided by the displacement, i.e. equal to
 $E_{k}/R_{0}$, such that the average deceleration
 $a$ experienced by the droplet may be written as
 $a \approx U_{0}^2/(2R_{0})$.
The relevant average deceleration experienced by (a) a droplet impacting on a solid, (b) a hydrogel sphere impacting on a solid, (c) a droplet impacting on sand and (d) a hydrogel sphere impacting on sand. Here,  $R_{0}$ is the radius of the droplet, which is approximately equal to the deformation of the droplet during impact onto a solid,
 $\delta _{m}$ is the maximum vertical deformation of the hydrogel sphere, such that
 $\delta _{m}/2$ is the displacement of its centre of mass, and
 $Z_{c}^\ast$ is the maximum crater depth reached during impact.

When the same droplet, however, impacts onto a granular bed, the force that deforms the droplet acts over a larger distance, namely the sum of the droplet radius and the maximum crater depth  $Z_{c}^\ast$, and as a consequence the average deceleration is smaller in magnitude,
 $a\approx U_{0}^2/(2(R_{0}+Z_{c}^\ast ))$ (figure 5c). This implies that with the same impact kinetic energy, the deceleration decreases from
 $a\approx U_{0}^2/(2R_{0})$ to
 $a \approx U_{0}^2/(2(R_{0}+Z_{c}^\ast ))$, i.e. by a factor
 $R_0/(R_{0}+Z_{c}^\ast )$, as if the droplet had impacted a solid substrate with a lower impact velocity, corresponding to a kinetic energy
 $E_d = R_0/(R_{0}+Z_{c}^\ast )\,E_k$. Stated in a slightly different manner, one could say that a portion
 $E_d = R_0/(R_{0}+Z_{c}^\ast )\,E_k$ of the impact kinetic energy
 $E_k$ is used for droplet deformation, and the remaining portion
 $E_s = E_k - E_d = Z_{c}^\ast /(R_{0}+Z_{c}^\ast )\,E_k$ is used for the formation of the crater (Zhao et al. Reference Zhao, de Jong and van der Meer2015b).
We now use the same argument in the case of a hydrogel sphere. When the sphere impacts onto a solid substrate and vertically deforms over a maximum length  $\delta _m$, the deceleration can be found in a manner similar to that for the droplet case. Assuming that the point of maximum deformation is reached when there is no kinetic energy left in the vertical direction, one needs to divide the kinetic energy of the impactor by the displacement of the centre of mass, that is, by
 $\delta _m/2$, and divide by the impactor mass to obtain the deceleration
 $a$ (figure 5b), i.e.
 $a = U_0^2/\delta _m$.
Clearly, when the solid substrate is replaced by a sand bed, the displacement of the centre of mass of the sphere is now equal to  $\delta _m/2+Z_{c}^\ast$ and consequently the magnitude of the deceleration is decreased to
 \begin{equation} a = \frac{U_0^2}{\delta_m+2Z_c^\ast} = \frac{\delta_m}{\delta_m+2Z_c^\ast} \,\frac{U_0^2}{\delta_m} . \end{equation}
That is, again, the deformation of the hydrogel sphere impacting onto the granular bed is equal to that occurring when the sphere impacted a solid substrate at a lower kinetic energy, obtained by multiplying the impact kinetic energy by a factor  $\delta _m/(\delta _m+2Z_c^\ast )$. This leads to a distribution of the impact kinetic energy
 $E_k$ into a part
 $E_d$ that is being used for the deformation of the hydrogel sphere and another part
 $E_s$ (
 $= E_k - E_d$) that is invested in the formation of the the crater, respectively given by
 \begin{equation} E_d = \frac{\delta_m}{\delta_m+2Z_c^\ast}E_k \quad\text{and}\quad E_s = \frac{2Z_c^\ast}{\delta_m+2Z_c^\ast}E_k. \end{equation}
When we assume that the hydrogel sphere maintains an ellipsoid shape during impact, we may calculate its maximum vertical deformation  $\delta _{m}$ based on the incompressibility condition, that is,
 $\delta _{m} \approx D_{0}-{D_{0}^3}/{d_{max}^2}$, in which
 $d_{max}$ is the maximum deformation diameter of the hydrogel sphere, which is discussed extensively in § 4.
With measured  $d_{max}$,
 $Z_{C}^\ast$ and
 $E_{k}$, the portion of energy consumed by the substrate
 $E_{s}$ can be computed for all experiments. In figure 6(a) we plot the rescaled crater diameter
 $D_{c}^\infty /D_{0}$ against
 $E_{s}/E_{g}$. We find that the gap between the data points corresponding to the liquid and solid impactor is widened, with the data for the hydrogel spheres lying between, arranged strictly according to their Young's moduli
 $Y$. Most importantly, where in figure 4(a) there was significant overlap between the solid-sphere data and those of the stiffest hydrogel spheres, this overlap has disappeared after correcting the impact kinetic energy. Now all hydrogel data convincingly lie between both the droplet impact data and the solid-sphere impact data, confirming that (at least from the crater diameter perspective) solid sphere and droplet impact can indeed be interpreted as limiting hydrogel sphere impact for the stiffest (
 $Y\to \infty$) and the softest (
 $Y\to 0$) case. Clearly, the crater diameter obtained by the impact of the softest hydrogel sphere with Young's modulus of the order of 100 Pa is close to that obtained by the impact of the droplet, whereas the case with
 $Y$ of the order of several tens of thousands of pascals is close to that of a solid sphere in the low-energy impact area, and the crater diameter is increased in the high-energy range due to a more significant deformation of the hydrogel sphere. The above observations build trust in the correctness of the energy decomposition scenario introduced in this subsection, such that we will continue to use it in the rest of this study.
(a) Rescaled crater diameter  $D_{c}^\infty /D_0$ and (b) rescaled crater depth
 $Z_{c}^\ast /D_0$ versus the rescaled portion of the impact kinetic energy going into sand deformation
 $E_{s}/E_{g}$. The data in these plots are the same as presented in figure 4, where the red and blue open circles respectively represent the solid-sphere and droplet impact data of de Jong et al. (Reference de Jong, Zhao, Garcia-Gonzalez, Verduijn and van der Meer2021) and the filled symbols represent the current hydrogel sphere data.

Subsequently, we also replotted the crater diameter data versus the corrected energy on a double-logarithmic scale, verified that again the data are consistent with a power law (not shown) and determined the exponents, which are added as the open symbols in figure 4(c) and are found to lie very close to those determined from the uncorrected impact kinetic energy (the filled symbols in the same plot). The only difference is that the exponents appear to be slightly higher for small  $Y$ and slightly smaller for large
 $Y$, but no clear distinction can be made within the measurement error.
Finally, in figure 6(b) we plot the rescaled crater depth as a function of the corrected and rescaled impact kinetic energy  $E_s/E_g$. Here we clearly observe a large discrepancy between the solid-sphere impact data and the data of even the stiffest hydrogel spheres. This we tentatively attribute to the different friction that may be experienced by the hydrogel spheres inside the sand bed, combined with the fact that, even for the stiffest hydrogel spheres, there is a slight deformation of the sphere upon impact that may further increase the friction that the sphere experiences. The fact that also the softest hydrogel spheres appear to undergo increased friction moving into the bed supports this viewpoint. This increased friction may be connected to the observed tendency of the sand grains to slightly adhere to the surface of the hydrogel spheres, something that did not occur during solid-sphere impact.
4. Impactor deformation: maximum spreading diameter
Deformation occurs simultaneously for both the granular bed and the hydrogel spheres during impact. For the hydrogel spheres there are three deformation regimes within the concerned velocity range: the concave pancake regime, the quasi-ellipsoid regime and the local deformation or Hertz regime (Tanaka et al. Reference Tanaka, Yamazaki and Okumura2003). The three regimes are clearly visible in figure 3, where the concave pancake-like deformation appears in the third and fourth snapshots of figure 3(a), the quasi-ellipsoid regime is visible in the second snapshot of figure 3(b) and finally the local deformation may be inferred in figure 3(c) from the fact that there is no apparent change in the horizontal diameter of the sphere during the entire impact.
To trace the morphological evolution of the hydrogel spheres we adopted the method presented in Zhao, de Jong & van der Meer (Reference Zhao, de Jong and van der Meer2019). Due to the perspective of the camera and lighting, the sphere appears as a dark ellipse in the experimental images. To detect the deformation of the hydrogel spheres, cross-correlations are computed between dark ellipse templates and the (background-subtracted) image, and the template size corresponding to the maximum correlation provides the spreading diameter  $d$ in the direction perpendicular to the impact. From the entire time series we subsequently determine the maximum spreading diameter
 $d_m$.
In figure 7(a) we plot the maximum spreading diameter  $d_{m}$ scaled by the sphere diameter
 $D_0$ as a function of the dimensionless impact energy
 $E_k/E_g$, for the same Young's moduli
 $Y$ and impact velocities
 $U_0$ as for which we determined the crater characteristics plotted in figures 4 and 6. Two things are apparent in this figure: firstly, that the maximum spreading diameter increases significantly with decreasing
 $Y$ and, secondly, that with increasing impact kinetic energy
 $d_m$ increases as well. We even observe that for the stiffest sphere (
 $Y = 50\,000$ Pa), where for low
 $E_k$ there is no observable horizontal deformation, the impact is able to generate global deformation for the largest impact energy. For the smallest Young's modulus (
 $Y = 100$ Pa) the deformation reaches up to 200 % of its original size, comparable to the deformations experienced by impacting liquid droplets.
(a) Dimensionless maximum spreading diameter  $d_{m}/D_{0}$ of the hydrogel spheres and (b) spreading time
 $\tau _{max}$ versus dimensionless impact kinetic energy
 $E_{k}/E_{g}$ for the impact of hydrogel spheres with different Young's moduli
 $Y$ onto a granular bed with average grain diameter of 200
 $\mathrm {\mu }$m and a packing fraction in the range 0.585–0.62, i.e. for the same parameters as presented in figures 4 and 6.

In addition to the maximum spreading diameter, we measured the spreading time  $\tau _{max}$, which is defined as the time difference between the moment of impact and that at which the maximal deformation is reached, which is plotted in figure 7(b) for the same dataset as used in figure 7(a). These data will be useful when discussing the bouncing phenomenon in § 5.
Turning back to the spreading diameter, we observe a considerable spreading of the data in figure 7(a), which suggests that  $E_k/E_g$ is not the most appropriate parameter to describe the deformation of the spheres during impact. The first improvement one could think of would be to use the portion of the impact kinetic energy that is available for each sphere, i.e.
 $E_d = E_k- E_s = (\delta _{m}/(\delta _{m} + 2 Z_c^\ast ))E_k$, instead of
 $E_k$, but plotting
 $d_{m}/D_{0}$ versus
 $E_d/E_g$ does not bring the system much closer to a collapse of the data. This is easily understood, since clearly the elastic deformation should be a main ingredient of a more coherent description, for which we turn to the literature. Tanaka et al. (Reference Tanaka, Yamazaki and Okumura2003) reported the impact of a cross-linked gel with
 $Y$ around
 $2000$ Pa onto a non-sticking, rigid substrate. They showed that the spreading dynamics can be rationalized from a balance between inertia and bulk elasticity,
 $E_k = E_e$, where
 $E_k$ is the kinetic energy just before impact and
 $E_e$ is the elastic energy stored in the sphere at its maximum deformation, namely at the point where the kinetic energy can be assumed to be zero. Starting from the analysis described in Arora et al. (Reference Arora, Fromental, Mora, Phou, Ramos and Ligoure2018), the stored bulk elastic energy is expressed as a function of the maximum deformation
 $\lambda _m=d_m/D_{0}$ as
 $E_{e} \approx ({\rm \pi} D_{0}^3 G(2\lambda _m^2+\lambda _m^{-4}-3))/12$, in which
 $G$ is the shear modulus of the sphere, which is related to Young's modulus as
 $Y=2G(1+\nu )\approx 3G$ where, again, we took the Poisson ratio
 $\nu \approx 0.5$. When the maximum spreading diameter is very large (
 $\lambda _m \gg 1$), the first term dominates the elastic energy, which may than be approximated as
 $E_{e} \approx ({\rm \pi} D_{0}^3 G \lambda _m^2)/6$. Translated to the current situation, we need to equate
 $E_e$ with the portion
 $E_d$ of the impact kinetic energy that is available for sphere deformation, which leads to
 $\lambda _m^2 \approx ({1}/{2})(\delta _{m}/(\delta _{m} + 2 Z_c^\ast )) \rho _i U_0^2/G$, or
 \begin{equation} \lambda_m = \frac{d_m}{D_0} \approx \frac{1}{\sqrt{2}}\sqrt{\frac{\delta_{m}}{\delta_{m} + 2 Z_c^\ast}} \frac{U_0}{U_e}\quad\text{with}\ U_e = \sqrt{\frac{Y}{3\rho_i}}. \end{equation}
Here,  $U_e$ is the velocity of transverse sound waves in the elastic medium with which the quantity
 $M \equiv U_0/U_e$ can be interpreted as an elastic Mach number. (Clearly, we could also have inverted the function
 $f(\lambda _m^2) = 2\lambda _m^2 +\lambda _m^{-4} -3$ to obtain an expression for the full curve
 $\lambda _m^2 = g[(\delta _{m}/(\delta _{m} + 2 Z_c^\ast )) U_0^2/U_e^2]$, where
 $g(\ )$ is just the inverse of
 $f(\ )$.)
In figure 8(a) we plot the dimensionless maximum spreading diameter  $d_m/D_0$ as a function of the modified elastic Mach number
 $(\delta _{m}/(\delta _{m} + 2 Z_c^\ast ))^{1/2}(U_0/U_e)$ for an enlarged number of experiments including two granular substrates with average grain diameters of
 $114$ and
 $200$
 $\mathrm {\mu }$m, respectively, and packing fractions
 $\phi$ ranging from
 $0.55$ to
 $0.62$. Clearly, the data collapse reasonably well for smaller values of the modified elastic Mach number, but do not collapse well when that value increases.
The dimensionless maximum spreading diameter  $d_{m}/D_{0}$ of the impacting hydrogel spheres is plotted against (a) the modified elastic Mach number
 $(\delta _{m}/(\delta _{m} + 2Z_{C}^\ast ))^{1/2}(U_0/U_e)$ and (b) the modified elastocapillary Mach number
 $(\delta _{m}/(\delta _{m} + 2Z_{C}^\ast ))^{1/2}(U_0/U_{ec})$ as explained in the text. Note that the dataset of figure 7 (i.e. for average grain diameter of
 $200$
 $\mathrm {\mu }$m and a packing fraction in the range 0.585–0.62) has now been enlarged to also include smaller average grain diameter (
 $114$
 $\mathrm {\mu }$m) and smaller packing fractions (in the range 0.55–0.585).

The reason is neglecting the effect of surface tension for the small values of the Young's modulus. To incorporate surface tension we again follow Arora et al. (Reference Arora, Fromental, Mora, Phou, Ramos and Ligoure2018) and add a surface energy term  $E_c$ to the balance, which in the large-deformation limit may be approximated as the product of the surface tension coefficient
 $\gamma$ and the sum of the upper and lower surface areas of the pancake-shaped deformed sphere, i.e.
 $E_c \approx ({\rm \pi} D_0^2\gamma \lambda _m^2)/2$. Now the sum of the elastic and capillary energies needs to be equated to the portion of the impact kinetic energy available for the deformation of the sphere:
 $E_d \approx E_e + E_c$ or
 \begin{equation} \frac{{\rm \pi} D_0^3}{12}\frac{\delta_{m}}{\delta_{m} + 2 Z_c^\ast} \rho_i U_0^2 \approx \frac{{\rm \pi} D_0^3}{6}\left(G + \frac{3\gamma}{D_0}\right)\lambda_m^2, \end{equation}
where the term in parentheses may be written as  $(G + 3\gamma /D_0) = 3Y(1+l_{ec}/D_0)$, in which
 $l_{ec} \equiv 9\gamma /Y$ is the elastocapillary length. Clearly, the surface tension term becomes important when
 $l_{ec}/D_0 \gtrsim 1$. Solving the energy balance now leads to
 \begin{equation} \lambda_m \approx \frac{1}{\sqrt{2}}\sqrt{\frac{\delta_{m}}{\delta_{m} + 2 Z_c^\ast}} \frac{U_0}{U_{ec}}\quad\text{with}\ U_{ec}^2 = U_e^2 + U_c^2 = \frac{Y}{3\rho_i} + \frac{3\gamma}{\rho_i D_0} , \end{equation}
where the quantity  $U_0/U_{ec} = U_0/\sqrt {U_e^2 + U_c^2}$ can now be interpreted as an elastocapillary Mach number. Assuming that the surface tension of hydrogel spheres can be approximated as that of their main constituent, namely water, we use
 $\gamma = 7.3 \times 10^{-2}$ N m
 $^{-1}$ and plot
 $\lambda _m = d_m/D_0$ as a function of the modified elastocapillary Mach number
 $(\delta _{m}/(\delta _{m} + 2 Z_c^\ast ))^{1/2}(U_0/U_{ec})$ in figure 8(b). Here, the data now beautifully collapse onto a single curve. This implies that the spreading of the hydrogel spheres impacting onto a granular bed can be described as that of hydrogel spheres impacting on solid substrates, provided that one takes into account that only a portion
 $E_d$ of the impact kinetic energy is available for hydrogel sphere deformation.
5. Bouncing
The last subject we want to discuss is the post-impact motion of the hydrogel spheres. Clearly, an elastic sphere impacting on a solid substrate is likely to rebound (Tanaka et al. Reference Tanaka, Yamazaki and Okumura2003) and also a droplet that impacts onto a plate may under certain circumstances rebound, depending on the wetting properties of the substrate (Josserand & Thoroddsen Reference Josserand and Thoroddsen2016). The situation becomes more complex if the substrate is a granular bed, i.e. if also the substrate is deformable, as is the case in the current study.
From the snapshot series in figure 3, it is clear that in figure 3(b) a rebound occurs, whereas in figures 3(a) and 3(c) there is no evidence of bouncing. To better quantify the post-impact motion, we trace the motion of the hydrogel sphere by comparing the snapshot where the sphere first recovered its original shape after impacting and one frame later, from which one can obtain the vertical centre-of-gravity positions  $h_{1}$ and
 $h_{2}$. If
 $h_{2}-h_{1}>0$, the sphere is observed to rebound. In figure 9 we present two phase diagrams in the parameter space created by the sphere's Young's modulus
 $Y$ and its impact velocity
 $U_0$, for two different packing fraction ranges
 $0.55 < \phi < 0.585$ (figure 9a) and
 $0.585 < \phi < 0.62$ (figure 9b). For both diagrams it is clear that bouncing only occurs at intermediate Young's moduli. Hydrogel spheres with large
 $Y$ are prone to rebound at high impact energy, while spheres with small Young's modulus rebound at low impact energies. With an increase of packing fraction, the region where bouncing occurs is observed to expand towards larger Young's modulus and smaller impact energies. Physically, this implies that a stiff sphere will rebound when its deformation is large enough (i.e. at high impact energies), which in turn is influenced by the deformability of the granular bed: if the bed is relatively compact (
 $0.585 < \phi < 0.62$) a certain impact velocity may be sufficient to trigger a rebound, whereas for a loose bed (
 $0.55 < \phi < 0.585$) an even larger impact velocity is needed, because the large deformability of the bed limits the deformation of the sphere.
Phase diagrams for the bouncing of hydrogel spheres after impact on a granular bed, presented in the parameter space created by the Young's modulus  $Y$ on the vertical axis and the impact velocity
 $U_0$ on the horizontal axis. Red symbols indicate a rebound, whereas blue symbols represent impacts where bouncing is absent. The difference between the panels is in the packing fraction of the granular substrate, which in (a) ranges from
 $0.55$ to
 $0.585$ and in (b) from
 $0.585$ to
 $0.62$. In both cases, the average grain diameter is
 $200$
 $\mathrm {\mu }$m. The different symbols denote the Young's modulus and have the same meaning as in figure 7.

The above observations indicate that one of the important parameters that determine whether bouncing occurs or not may well be the ratio of the spreading time and the duration of the impact. To quantify this ratio, we turn back to the spreading time  $\tau _{max}$ plotted in figure 7(b). Clearly, the spreading time decreases significantly with increasing Young's modulus and only mildly depends on the impact energy, where
 $\tau _{max}$ changes from about
 $3.8$ ms for
 $Y = 100$ Pa, through
 $1.3$ ms for
 $Y=2000$ Pa to
 $0.7$ ms for
 $Y=9000$ Pa. Subsequently, we compare the measured spreading time
 $\tau _{max}$ with the expected oscillation time
 $\tau _{osc}$ for a hydrogel sphere with Young's modulus
 $Y$ and surface tension
 $\gamma$, namely
 \begin{equation} \tau_{osc} = \frac{{\rm \pi} D_0}{2\sqrt{2}U_{ec}} = \frac{{\rm \pi} D_0}{2\sqrt{2}\sqrt{ \dfrac{Y}{3\rho_i} + \dfrac{3\gamma}{\rho_i D_0}}}, \end{equation}
which is equal to one quarter of the oscillation period of the hydrogel sphere, i.e. the expected time it takes for the sphere to go from the undeformed to the maximally deformed state (Arora et al. Reference Arora, Fromental, Mora, Phou, Ramos and Ligoure2018). In figure 10 we plot the ratio  $\tau _{max}/\tau _{osc}$ as a function of the modified elastocapillary Mach number
 $(\delta _{m}/(\delta _{m} + 2Z_{C}^\ast ))^{1/2}(U_0/U_{ec})$. Clearly, all data again collapse onto a single master curve and
 $\tau _{max}/\tau _{osc}$ rapidly decreases towards a constant value for large Mach number. This result is consistent with the experimental observations for a (rigid) plate impacted by droplets (Chantelot et al. Reference Chantelot, Coux, Clanet and Quéré2018) and by elastic spheres (Tanaka et al. Reference Tanaka, Yamazaki and Okumura2003). For the latter, the interpretation is that for globally deformed spheres the ratio
 $\tau _{max}/\tau _{osc}$ tends to a constant value, whereas for decreasing Mach number we enter the regime where the deformation is local (the Hertzian regime), which leads to an increase of the ratio
 $\tau _{max}/\tau _{osc}$. Note that the poor collapse observed in Tanaka (Reference Tanaka2005) for larger values of the Mach number could be avoided in our case due to the incorporation of the surface energy, i.e. by the introduction of the (modified) elastocapillary Mach number as in Arora et al. (Reference Arora, Fromental, Mora, Phou, Ramos and Ligoure2018).
Measured spreading time  $\tau _{max}$ scaled by one quarter of the theoretical oscillation time (
 $\tau _{osc}$) plotted versus the modified elastocapillary Mach number
 $(\delta _{m}/(\delta _{m} + 2Z_{C}^\ast ))^{1/2}(U_0/U_{ec})$. Note that the extended dataset from figure 8 has been used to create this plot, using the same symbols and colour coding.

The inertial time scale  $\tau _{i}$, which for impact of an elastic sphere on a solid substrate can be estimated as
 $\delta _{m}/U_{0}$, needs to be corrected for the deformation of the granular target as
 $\tau _{i}=(\delta _{m}+2Z_{C}^\ast )/U_{0}$. With the above, we now are able to compute the ratio of the measured spreading time and the inertial time scale,
 $\tau _{max}/\tau _{i}$, which allows us to recast the bouncing phase diagram of figures 9(a) and 9(b), together with additional data for the granular bed consisting of smaller grains, into the new form presented in figure 11.
Ratio of the spreading time  $\tau _{max}$ and the inertial time
 $\tau _{i}=(\delta _{m}+2Z_{C}^\ast )/U_{0}$ versus the modified elastocapillary Mach number
 $(\delta _{m}/(\delta _{m} + 2Z_{C}^\ast ))^{1/2}(U_0/U_{ec})$. Note that the extended dataset from figure 8 has been used to create this plot, using the same symbols. This plot is a recast of the bouncing phase diagrams (figure 9) (for an extended dataset), where red symbols indicate a rebound and blue symbols represent impacts where bouncing is absent. The horizontal and vertical dashed black lines are located at
 $\tau _{max}/\tau _{i} = 1$ and
 $(\delta _{m}/(\delta _{m} + 2Z_{C}^\ast ))^{1/2}(U_0/U_{ec}) = 1$, respectively, and are indicative of the upper (or inertial) transition and the lower (or elastocapillary) transition between which bouncing is expected to occur, as explained in the text.

Firstly, all data appear to lie close to a straight line. This should be no great surprise since both axes represent the ratio of an elastocapillary time scale and an inertial one. This is obvious for the vertical axis, but for the horizontal this may be explained by noting that the modified impact velocity is divided by the elastocapillary velocity scale, which, combined with the fact that the length scale is determined by the size of the hydrogel sphere, is equivalent to the ratio of an elastocapillary and an inertial time scale. These are, however, obtained from very different and independent measurements.
Secondly, it is important to realize that the large time scale and velocity scale ratios in the upper right corner occur for large impact speeds and small Young's moduli. So the softest hydrogel sphere impacts are located in the upper right quadrant and the stiffest ones close to zero, in the lower left quadrant of the plot.
The third observation to be made from figure 11 is that bouncing only occurs at intermediate values of the time-scale ratio. We will now discuss why this happens. The upper transition is expected to occur when the time-scale ratio is of order unity, that is, where the spreading time  $\tau _{max}$ is approximately equal to the inertial time
 $\tau _{i}$. This upper transition is indicated by the horizontal dashed line (located at
 $\tau _{max}/\tau _{i} = 1$). The reason is the following. Already Richard & Quéré (Reference Richard and Quéré2000) noted for the impact of a droplet on a solid substrate that rebound may not occur either due to dissipative mechanisms (such as viscous dissipation and contact angle hysteresis) or due to the fact that the vertical kinetic impact energy is converted partly into pure horizontal oscillation of the droplet and is therefore unavailable for rebound. Clearly, if the spreading time of the impacting sphere is larger than the duration of the impact, then the impact energy is (necessarily) mostly converted into the horizontal direction and the hydrogel sphere may start to oscillate in the horizontal direction but no rebound will occur. This explains the location of the upper (or inertial) transition.
Note that this inertial transition is also expected to be observable for hydrogel spheres bouncing from a solid substrate. For the case of hydrogel sphere impact on a granular substrate, there may, however, be an additional mechanism that will act to decrease the location of the upper bound, namely due to the layer of grains that attaches to the surface of the sphere which increases its mass and therefore makes bouncing less likely to occur. This effect is observed especially in the case of the very soft spheres.
The lower (or elastocapillary) transition, however, is unique to impact on granular targets, and appears because of the deformability of the substrate. When the elastic energy stored in the sphere releases during the penetration of the sphere inside the sand, due to the downwards motion of the granular substrate that energy cannot be converted into a vertical motion. The granular material is simply too soft for the sphere to rebound on. This happens when the elastocapillary deformation speed of the sphere becomes larger than the impact velocity, which dictates the velocity with which the granular substrate starts to yield. Indeed, the lower transition appears to be best described by the criterion that the modified elastocapillary Mach number is of order unity. In figure 11 the location of this lower transition is approximately indicated by the vertical dashed line located at  $(\delta _{m}/(\delta _{m} + 2Z_{C}^\ast ))^{1/2}(U_0/U_{ec}) = 1$.
For this case there exists an interesting parallel with the drop trampoline of Chantelot et al. (Reference Chantelot, Coux, Clanet and Quéré2018), in which a simplified model is presented to describe the bouncing of a droplet on an elastic membrane in which both are described as a mass–spring combination. In their model, when (for comparable masses) the spring constant of the substrate is taken sufficiently smaller than the spring constant of the impactor, the velocity of the latter after the first half-oscillation will never be larger than zero. Recalling that the deformation speed is proportional to the square root of the spring constant, this implies that the impactor will not rebound if the deformation speed of the substrate (proportional to the modified impact velocity  $(\delta _{m}/(\delta _{m} + 2Z_{C}^\ast ))^{1/2}U_0$) is sufficiently smaller than that of the impactor (proportional to the elastocapillary speed
 $U_{ec}$).
6. Conclusion
We systematically studied the impact of hydrogel spheres with Young's modulus varying over almost three orders of magnitude onto a granular bed. We observed how the impact speed and Young's modulus influence the diameter and depth of the crater that is created during impact, and compared the results with those obtained in our earlier work (de Jong et al. Reference de Jong, Zhao, Garcia-Gonzalez, Verduijn and van der Meer2021) for the impact of liquid droplets and solid, undeformable spheres. To obtain a reliable comparison, we argued it to be essential to determine the portion of the impact kinetic energy that was invested in the formation of the crater by devising a method analogous to the one used for the impact of liquid drops (Zhao et al. Reference Zhao, de Jong and van der Meer2015b).
Regarding the crater diameter, the hydrogel sphere data lie between the limits set by solid and liquid impactors: for similar modified impact energies  $E_s$, spheres of large Young’s moduli create narrow craters, slightly wider than but comparable to those of solid spheres, whereas spheres with a small Young's modulus create wider craters that remain slightly narrower than those observed for the liquid impactors. The crater diameter data are consistent with a power law in the impact energy with exponents gradually varying from
 $0.17$ to
 $0.21$ from small to large Young's moduli, consistent with the values found for liquid droplets (0.17–0.18) to solid spheres (0.20–0.24), where we note that the power-law exponent drops more sharply when
 $Y$ becomes of the order of
 $200$ Pa and smaller.
Regarding the crater depth, the ordering of the data is as expected from the behaviour of solid and liquid impactors, where spheres of small Young’s modulus create shallower impact craters than those of large Young's moduli. In general, however, impact craters resulting from hydrogel sphere impact are markedly shallower even than those created by liquid droplets, and even those created by the largest Young's modulus ( $Y=50\,000$ Pa) are up to a factor two shallower than those created by the solid impactor. This could possibly be connected to the fact that the sand grains are observed to easily adhere to the surface of the hydrogel particles which may cause an increased friction experienced by the hydrogel spheres during penetration into the sand bed, leading to a smaller final depth.
Turning to the deformation of the hydrogel spheres we show that, for a very broad range of impact parameters, including two granular substrates consisting of differently sized grains and a full range of packing fractions, our data can be collapsed onto a single curve by the introduction of an elastocapillary Mach number which rescales the impact velocity with the typical elastocapillary speed introduced in Arora et al. (Reference Arora, Fromental, Mora, Phou, Ramos and Ligoure2018), provided that we correct the impact velocity for the fact that only part of the impact kinetic energy is used for the deformation of the spheres.
Finally, we observe that hydrogel spheres may bounce off the granular substrate only for a certain intermediate range of Young's moduli and impact speeds. We trace this behaviour back to the ratio of the spreading time and the impact time. For large values of this ratio a rebound is not expected to occur because most of the energy will be stored in the horizontal direction, since most of the spreading is occurring while the vertical deformations have already reached their maximum. This threshold, happening when the time ratio is of order unity, would exist for both a solid and a deformable substrate. In addition, for very small time-ratio values a rebound is not expected because the granular substrate is still in the process of moving down while the elastic sphere is already relaxing back to its original spherical shape, such that the elastic energy will not be able to propel the sphere into the upward direction. This happens uniquely for a deformable substrate, and can be traced back to the condition where the modified elastocapillary Mach number is of order unity.
Acknowledgements
The authors thank G.W. Bruggert, D. García-González, K. Harth, R. de Jong, S.-C. Zhao, T. Phou, L. Yang, P. Chantelot and D. Rana for their invaluable help in rebuilding the set-up, producing hydrogel particles and valuable discussions.
Funding
X.Y. acknowledges financial support of the National Natural Science Foundation of China (no. 11872029).
Declaration of interests
The authors report no conflict of interest.